The structure of segregation in co-authorship networks and its impact on scientific production
BioComplex Laboratory
Department of Computer Science
University of Exeter, UK
ajaramillo@biocomplexlab.org
\And
SEDA Lab
Department of Computer Science
University of Exeter, UK
\AND
School of Mathematical Sciences
Queen Mary University of London, UK
\AND
BioComplex Laboratory
Department of Computer Science
University of Exeter, UK
r.menezes@exeter.ac.uk
Abstract
Co-authorship networks, where nodes represent authors and edges represent co-authorship relations, are key to understanding the production and diffusion of knowledge in academia. Social constructs, biases (implicit and explicit), and constraints (e.g. spatial, temporal) affect who works with whom and cause co-authorship networks to organise into tight communities with different levels of segregation. We aim to look at aspects of the co-authorship network structure that lead to segregation and its impact on scientific production. We measure segregation using the Spectral Segregation Index (SSI) and find 4 ordered segregation categories: completely segregated, highly segregated, moderately segregated and non-segregated communities. We direct our attention to the non-segregated and highly segregated communities, quantifying and comparing their structural topologies and k-core positions. When considering communities of both categories (controlling for size), our results show no differences in density and clustering but substantial variability in core position. Larger non-segregated communities are more likely to occupy cores near the network nucleus, while the highly segregated ones tend to be closer to the network periphery. Finally, we analyse differences in citations gained by researchers within communities showing different segregation categories. Researchers in highly segregated communities get more citations from their community members in middle cores and gain more citations per publication in middle/periphery cores. Those in non-segregated communities get more citations per publication in the nucleus. To our knowledge, this work is the first to characterise community segregation in co-authorship networks and investigate the relationship between community segregation and author citations. Our results help study highly segregated communities of scientific co-authors and can pave the way for intervention strategies to improve the growth and dissemination of scientific knowledge.
Keywords co-authorship networks science of science k-core decomposition segregation analysis
Section 1 Introduction
The social structures behind scientific production may have profound effects on the growth and dissemination of knowledge, the well-being of our societies, and the evolution of academic research [14]. Many studies have shown how socially influenced behaviours impact different aspects of the scientific enterprise. Examples include the selection of co-authors, citation rates, and peer review processes, which are biased by author attributes such as prestige [24], gender [44], and country of affiliation [42, 32].
Co-authorship networks, where nodes represent researchers and links represent co-authorship relations between them, have been shown as key to the understanding and mapping of scientific production [50, 34, 35]. Particular attention has been devoted to their structural properties. These networks are organised in communities formed by groups of highly collaborative researchers with relatively low external interactions [29]. Looking at the evolution of these networks in time, one might see these communities going from being disconnected components to joining the giant component, as the co-authorship network coalesces. When comparing the proportion of nodes in the giant component relative to the total number of nodes, critical transition points represent the constitution of new disciplines and the growth of science [4].
As in most activities driven by human interactions, the biases mentioned above influence the processes of community formation and their connection/disconnection with other parts of the network. On one side, the previous literature has shown how the lack of exposure to individuals outside their circle can create segregated groups [45]. In different contexts of scientific production, such as discussions on social media, this “structural segregation” [21] can increase polarization [40, 36] and reinforce similar opinions [11]. High segregation levels—found in social networks with very fragmented groups—hamper the development of social capital and the emergence of cooperative behaviour, to the detriment of innovation, social learning, and problem solving [18]. In particular, computer scientists immersed in gender-segregated groups (low female-male connectivity) have disadvantaged positions in accessing information [20]. On the other side, researchers grouped into segregated communities could increase the exploitation of innovative ideas with in-depth work. For example, groups of researchers organised in efficient structures, characterised for being more interconnected and less clustered, proved to outperform others in solving complex problems [26], and researchers from evolutionary medicine produce better and longer-lasting ideas when located on the network’s periphery [33]. There is tension between consolidating and diversifying collaborations, as both might affect the growth of scientific knowledge and research impact. Our understanding of when and how collaborations across communities can help expand research methods and questions [31], as well as promote the spreading of scientific results [42, 43], is still limited.
In this context, we tackle 3 specific research questions: (i) How to identify highly segregated communities in co-authorship networks? (ii) Are there differences in the topological structure and core position of communities with different segregation levels? (iii) Does the segregation level affect success in science as measured by citations?
To answer these questions, we study co-authorship networks using a dataset of publications in Computer Science. We assume that communities of researchers with very high internal connectivity versus low external connectivity can be considered highly segregated. We use 4 ordered segregation categories and show a relationship between community size, segregation category, and core position, whereby non-segregated communities tend to be positioned near the network’s nucleus. We also find that highly segregated researchers gain more citations when positioned in the middle or periphery cores of the network. In comparison, non-segregated researchers gain more citations in cores near the nucleus. Also, highly segregated researchers gain a higher proportion of their citations from their own communities in middle cores, while non-segregated researchers do so in the nucleus.
The paper is organised as follows: Section 2 describes the dataset and network properties used in this study. Section 3 details the procedure and characterisation of the community partition. Section 4 defines the structural segregation metric used in this study and how communities are categorised as completely segregated, highly segregated, moderately segregated and non-segregated. Our analyses focus on understanding non-segregated and highly segregated communities. Section 5 shows 4 metrics related to the topology and core position of these communities, and we compare them using distributions and Z-Scores. In Section 6, we compare the number of citations per publication, and the proportion of citations received by members of the same community, to analyse the implications for researchers in communities with different segregation categories. Finally, Section 7 summarises our main contributions, limitations of this study and final remarks.
Section 2 Data and networks
We analyse the emergence of segregated communities in the scientific co-authorship network, focusing on the field of Computer Science. The choice of Computer Science here is pragmatic (manageable size) but also because we can study co-authorships in this field since its early stages; it consolidated as a discipline relatively recently (the late 60s) with the appearance of associations, undergraduate and PhD programmes, and specialised funding agencies [46]. We obtained data from the Semantic Scholar Open Research Corpus [23]. Our analyses correspond to 45 years from 1975 to 2020 for which we have sufficient data. To simplify the manuscript, we display some of the main results of our analysis using one particular year (2010) as an example. The choice of example year is somewhat arbitrary and was driven solely by the idea that approximately 10 years of work after that year should provide enough information about citation trends. For generality, we study other 2 example years (2006 and 2014) with results given in the Supplementary Material. Henceforth, all references to results in the Supplementary Material have a prefix “S” (e.g. Section S1, Figure S1, Table S1). All 3 example years have similar results regarding the structure of the communities but differ in some of the citation analyses. We leave a complete longitudinal analysis across all years for future work, noting that citation comparisons cannot be fairly performed for recent years as works have yet to accrue citations.
For each year of analysis, we build a co-authorship network. Each node represents a researcher. A link is created when 2 researchers co-author at least one scientific publication in the year of study. For the analyses in this paper, we select the Largest Connected Component (LCC) of each co-authorship network. The characteristics of the LCC co-authorship networks for the 3 years studied are shown in Table 1. Values in parentheses represent the proportion of the metric in the LCC compared with the entire co-authorship network. For example, for building the co-authorship network in 2010, we used all of the 615,737 available publications but then just analysed 294,181 publications in the LCCs (0.48 of the available publications).
| Metric per year | 2006 | 2010 | 2014 |
|---|---|---|---|
| Number of papers | 194,114 (0.43) | 294,181 (0.48) | 369,304 (0.52) |
| Number of nodes | 249,797 (0.47) | 407,532 (0.54) | 566,835 (0.57) |
| Number of edges | 292,336 (0.22) | 1,453,217 (0.29) | 1,042,623 (0.32) |
| Density | 9.37e-06 | 1.75e-05 | 6.49e-06 |
| Clustering coefficient | 0.78 | 0.99 | 0.89 |
| Mean degree | 4.97 | 13.12 | 6.48 |
| Mean weighted degree | 5.99 | 14.33 | 9.44 |
| Mean strength degree | 1.73 | 1.78 | 1.8 |
| Number of communities (3 researchers) | 24,470 | 39,998 | 54,655 |
| Number of researchers in communities (3 researchers) | 249,797 | 407,532 | 566,835 |
| Number of internal papers (all the authors within | 86,354 | 128,415 | 189,072 |
| the same community) |
There are different ways to measure the value of the links between 2 researchers. For the current analyses, we use the strength of the link between 2 researchers and as proposed by Newman [27, 7]. The strength captures the idea that 2 researchers that are the sole co-authors of a paper know each other better than 2 researchers that co-authored a paper with many other co-authors, hence giving more importance to those papers with fewer co-authors. The strength is calculated as , where takes the value of 1 if the researcher co-authored the paper and refers to the number of authors of the paper . To sum the strength of the links of leads to the strength degree, which differs from the 2 well-known options of giving a value of 1 to each link (leading to the degree) or using the number of co-authorships as the weight of the link [2] (leading to the weighted degree). In Table 1, we compare the mean value of the 3 degrees (degree, weighted degree and strength degree) computed for the LCC. In Section S2, we give toy examples showing how the 3 degrees are calculated and compare their distributions over the years.
Section 3 Community detection and description
To compute the community partition of the entire co-authorship network, we tested 6 commonly used community detection algorithms divided into 2 categories: modularity optimisation (Leading-eigenvector [30], Multilevel [5], Fast-greedy [8]) and dynamical processes (Infomap [39], Walktrap [37], Label-propagation [38]) [15]. To select which algorithm represents a better community detection, we must consider that all the co-authors of one publication form a clique [28], resulting in high clustering coefficients for co-authorship networks (Table 1). Following the methodology proposed by Fortunato and Hric [15], we select the results from the Label-propagation algorithm [38] because it finds communities that are less confounded by fully connected cliques and have higher average embeddedness of their nodes. The embeddedness of a node is its internal (inside the community) strength degree over its total strength degree [22]. The results of each algorithm are included in Section S3. In addition, we analyse if our results depend on the community partition in Section S9, where we repeat some of the analyses for communities computed with Infomap [39].
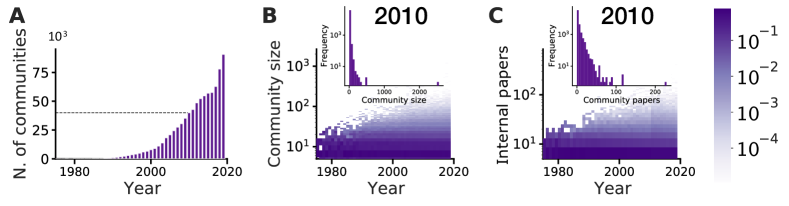
Figure 1 shows the evolution of community structure from 1975 to 2020 based on outputs from the Label-propagation algorithm. The number of communities has grown above 50,000 by the end of the study period (Figure 1A). The distributions of community sizes (number of nodes in each community) for each year are shown in Figure 1B; the community size frequencies for 2010 are presented in the inset. Interestingly, of the studied communities have fewer than 20 researchers, a constant tendency each year. The maximum community size in the last five years of data (2015-2020) is more than 2,000. Finally, analysing the number of internal papers (i.e. papers with all the authors within the same community) written by each community, we found that of communities publish less than 10 papers, with an upper limit slightly above 200 papers (Figure 1C). On average, for all the years, there are 0.38 internal papers per researcher (average number of internal papers over the number of researchers). The last results indicate that most researchers in Computer Science work in medium size groups, with the majority working on a few papers, differing from other disciplines with solo authors or large working groups [13].
Section 4 Community segregation
From this section, all analyses are done considering the researchers, internal papers and communities in the LCC co-authorship network. In addition, because we study the internal connectivity structure of the communities, we analyse communities with at least 3 researchers. Hence, for 2010, we analysed 128,415 papers authored by 407,532 researchers grouped in 39,998 communities, as shown in the last 3 rows of Table 1.
4.1 Spectral segregation index
We use the Spectral Segregation Index (SSI) proposed by Echenique and Fryer [12] to measure structural segregation in the detected communities of the LCC. The SSI measures individual segregation as the linear combination of a node’s and its neighbours’ fraction of internal connectivity inside the group defined (internal refers to links inside the community in our case). The SSI implies a reinforcing process in which a node with a high SSI value has neighbours with a high SSI. There are various segregation metrics, and an interested reader should refer to Bojanowski and Corten [6].
We compute the SSI following the procedure defined by Echenique and Fryer [12]: First, we normalise the LCC’s adjacency matrix (which contains the strength of the link between 2 researchers and ). To achieve this, we take the original adjacency matrix and normalise their rows, to sum up to 1 (one). Then, we select a submatrix for each community, , which contains only internal interactions within the community . The value of corresponds to the largest eigenvalue of the submatrix [12].
The eigenvalue is computed as the stationary state of a “random walk” process. Hence, the connectivity patterns within the community shape the values of , which is, in turn, the average of the individual segregation values within the community. Values of SSI near 0 represent a low segregation level, while values near 1 represent high segregation. Communities that are disconnected components have an SSI equal to 1, meaning perfect segregation [12], hereafter referred to as completely segregated communities.
4.2 Defining segregation categories
We compute the SSI considering only the connections within a calendar year in the co-authorship network, and we use communities with 3 nodes, considering only the LCC. For 2010, we worked with 39,998 communities (29% from the original 136,967 communities of the entire co-authorship network in 2010). The other communities are completely segregated and do not connect to the LCC. Completely segregated communities: (i) can be cliques (i.e., fully connected subgraphs), (ii) have few internal papers (1.44 on average), and (iii) do not have a core position (computed from the k-core decomposition of the communities network). Their presence is partially due to the time-window considered (i.e., one year); the longer the period considered, the larger the LCC becomes and, consequently, the fewer the isolated components. Then, we do not analyse the structural properties or core positions of completely segregated communities in Section 5 because they could skew our results. However, we include a category of completely segregated communities in Section 6 when we analyse the relationship between different segregation levels and citations.
The values of SSI are continuous, and there are no clearly defined categories, so we developed a procedure to identify ordered categories. First, we compute the probability density function PDF of the SSI, its mean () and standard deviation (). Second, we select as highly segregated those communities with a relatively high , and non-segregated those communities with a relatively low . This approach naturally leads to 3 categories of segregation: highly, moderately, and non-segregated. In Figure 2C, we show the PDF of SSI for 2010, the division of segregation categories, and the number of communities in each category. This procedure ends with 7,539 non-segregated, 27,524 moderately segregated, and 4,935 highly segregated communities. We compute the same analysis in Section S4 for 2006 and 2010.
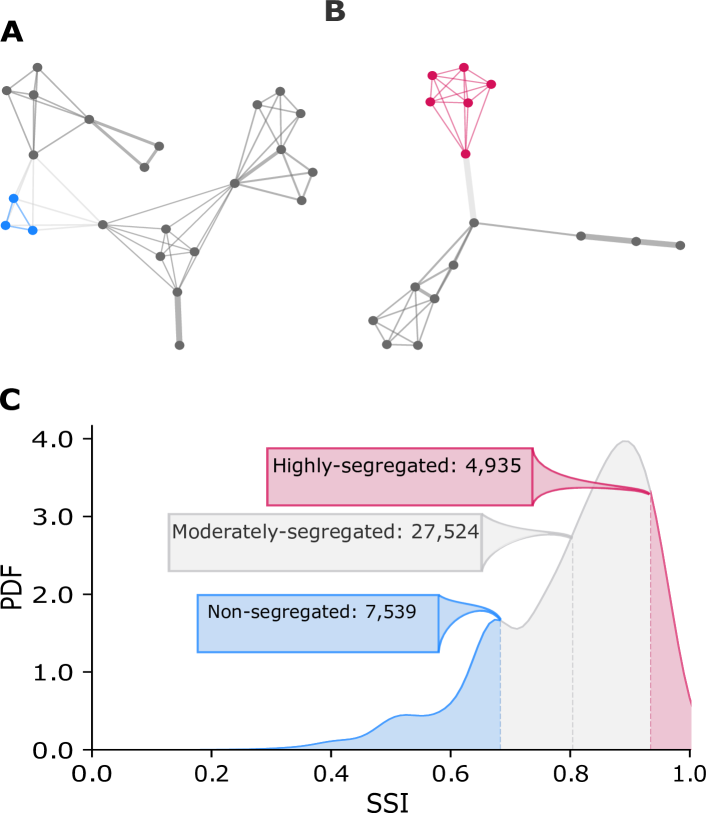
In Figure 2, we show toy networks of non-segregated and highly segregated communities in panels A and B, respectively. Those toy networks show communities with their members in colour, grey for nodes from other neighbouring communities and in light grey links among different communities.
In the following analyses, we concentrate on studying 2 categories: non-segregated and highly segregated communities, as we want to study the extremes of the SSI spectrum. However, in the first subsection of Section 6, we compare the citation patterns of the 4 ordered segregation categories: completely segregated, highly segregated, moderately segregated and non-segregated communities.
Section 5 Characterisation of communities in different segregation categories
We compare 4 metrics in total to investigate the characteristics of non-segregated and highly segregated communities. The first 3 metrics refer to the structural properties of the communities to understand if the segregation categories are related to a community’s internal connections. We compute the size (measured as the number of researchers), density (measured as the proportion of internal links over the set of all possible internal links), and clustering coefficient (measured as the number of triangles over the number of triplets within the community) [30].
The fourth metric refers to the core position of the communities because the core/periphery position of segregated communities in online social networks (i.e. echo chambers) [48] has been shown to influence their ability to spread information during social movements [1]. Therefore, in the context of scientific production, we want to understand if the communities’ position in the co-authorship network also relates to their segregation category. We first create a network in which each community is a node, and links between these nodes exist if their members share co-authorships. Then, we apply the k-core decomposition algorithm [3] and assign each community to a correspondent core. The core values range from 1 (periphery) to N (nucleus), where N depends on how many cores we have in a particular year, 11 in the case of 2010. See Section S5 for more details about calculating the core decomposition of the communities networks.
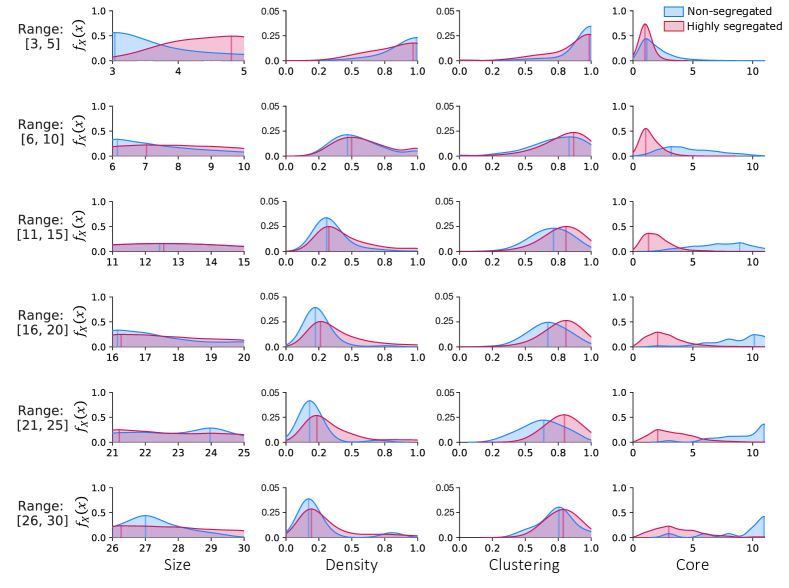
As a previous step, we group the communities by different size ranges (detailed explanation and more analyses in Section S6). For the comparison, we first separate the communities by size range and segregation category (i.e., highly or non-segregated). Then, we perform a statistical analysis to compare the PDF of the 4 metrics (size, density, clustering, and core position) of the non-segregated and highly segregated communities, with results for the 2010 network in Figure 3 and analogous plots for different years in Section S7. The sixth range of communities’ size shown in Figure 3 goes up to 30 as this value is the largest communities’ size where there are at least 30 non-segregated communities. The last suggests that it is difficult for large communities to be non-segregated.
Our results show that for small communities, there are no differences between non-segregated and highly segregated communities in terms of density, clustering or core position. However, as the communities grow, the density column shows both types of communities decreasing their peak values from 1 to 0.2. The clustering column shows decrements from 1 to 0.5 for non-segregated and 0.8 for highly segregated communities. We infer that these decrements are expected for larger communities, as they can be formed by different groups with enough intergroup co-authorships. For the core position, there are no differences when communities are smaller than 5, with both types being in the periphery. However, when the size increases, on one side, non-segregated communities start to be in higher-value cores until the largest ones reach the nucleus. And on the other side, highly segregated communities remain in peripheral cores.
To highlight the importance of disaggregating communities by size, we perform the same analyses without separating them by size in Section S7.1. The results are indeed misleading when communities with different size ranges are mixed, as the number of nodes and links affect density and clustering and hide the differences in the core position.
In conclusion, small communities tend to be denser, more clustered and toward the network’s periphery. As expected, their densities and clustering decrease when they increase in size, though less visibly for clustering. There are mild differences in density and clustering between non-segregated and highly segregated communities, with values mainly driven by community size. Moreover, there is a difference in their core position, with more large non-segregated communities in the nucleus and more highly segregated communities in peripheral cores.
We performed 3 additional analyses, reported in the Supporting Materials: i) We repeat this analysis for the years 2006 and 2014 in Section S7.1 with similar results: The communities located in the network’s periphery are more numerous and smaller, and those highly segregated in the nucleus have larger sizes. ii) We compare the Z-Score of the metrics, and compute kernel density estimators for comparing size, SSI, and core position at the same time in Section S7.2. The results remain congruent with statistical differences between non-segregated and highly segregated communities for the core position when communities are large. iii) We repeat the procedures of this section in Section S9.2 with the results of Infomap. We found that both algorithms have similar results. However, Label-propagation always has more highly segregated researchers than non-segregated (if we use the same characterisation we have done here), while it changes for Infomap: there are more highly segregated researchers in the periphery and more non-segregated researchers in the nucleus.
Section 6 The effect of segregation on citations
This work’s third and final research question relates to understanding the relationship between segregation and citation levels. Citations are a well-known measure of scientific success, but we also encourage reading our results critically, as citations have been related to selection biases, mainly affecting underrepresented communities, e.g. women and non-western researchers publishing non-English content [9]. Here, we consider both the number of citations and the origin of the citations (in terms of the community partition) to characterise whether highly segregated communities have more self-citations than non-segregated ones. For each researcher in non-segregated and highly segregated communities, we analyse the citations received until 2020 by the publications of 2010.
First, we investigate whether the number of internal papers correlates with i) the total number of citations and iii) the average number of citations per paper as in previous literature, the number of citations an author receives has been related to their number of publications [19]. We find low correlations of 0.29 (-value ) and 0.10 (-value ), respectively. We use the Spearman correlation in both cases because the number of papers has a non-linear relationship with citations and citations per paper (Figure S13).
Second, we compute the cumulative density function CDF of 4 variables for researchers within the specific category of communities: (i) total number of citations, (ii) citations per paper, (iii) proportion of citations from the same community, and (iv) proportion of all citations from the same year’s co-authors (2010 for the main manuscript).
For each variable, we analyse researchers at 2 levels of granularity. (i) All researchers without grouping them by core position for the 4 categories: completely segregated, highly segregated, moderately segregated and non-segregated in Figure 4 (definition of each category in Section 4), and (ii) researchers grouped by the core position of their communities for 2 categories: non-segregated and highly segregated in Figure 5. We did not analyse our results by different ranges of internal papers due to the low correlation with the citation variables.
We use 2 statistical tests to compare the CDFs of non-segregated and highly segregated communities: Kolmogorov-Smirnov (KS) and Mann-Whitney (MW). The first test compares the shape of the distributions, and the second compares the differences between medians.
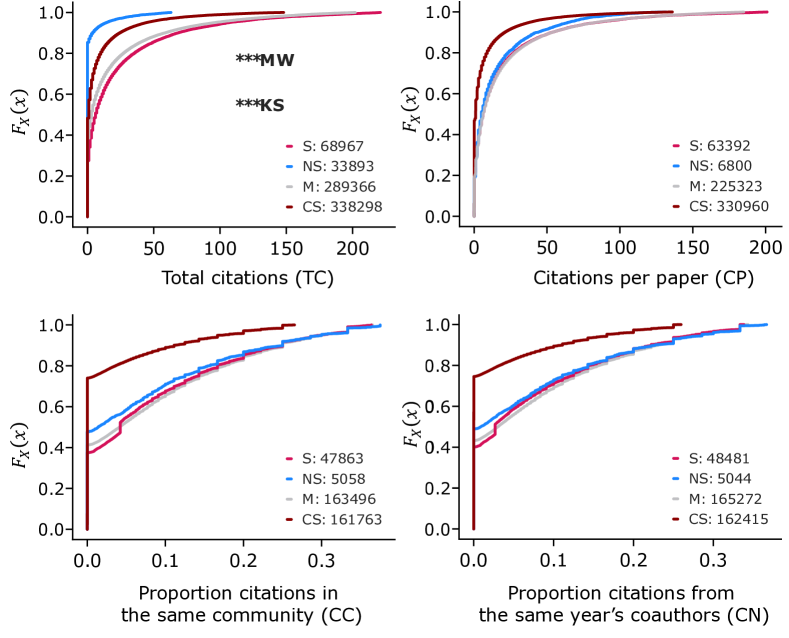
We first analyse the CDFs for the (i) total number of citations TC and (ii) citations per paper CP. On an aggregated level, in Figure 4 top row, our results indicate that highly segregated researchers have more TC than non-segregated researchers. Considering the number of CP, we see that completely segregated researchers (darker red in the plot) have smaller values than other researchers, with no significant differences. However, the previous results hide some information because they are averaging over all network cores. Then, in Figure 5, we group the researchers by the core position of their communities, and we split the results into the nucleus, middle, and periphery. In middle and periphery cores, highly segregated researchers have more TC than non-segregated ones, with opposite results in the nucleus (top row). For the CP (second row), there are no differences in the middle or periphery cores, but non-segregated researchers have more CP in the nucleus.
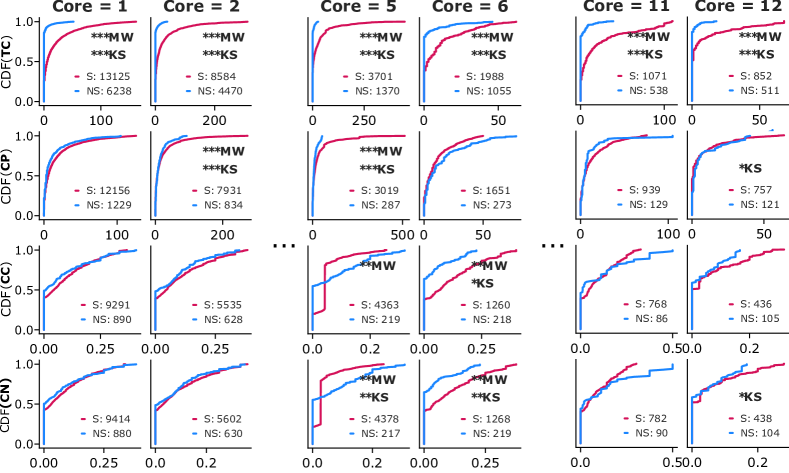
The results of TC and CP in 2010 are similar in 2006 and 2014. For TC, highly segregated researchers outperform non-segregated in the periphery and middle cores, but there are no significant differences for CP. In the nucleus, for both TC and CP, non-segregated researchers do better (detailed results of 2006 and 2014 in Section S8).
Then, we analyse the CDFs for (iii) the proportion of citations from the same community CC and (iv) the proportion of citations from the same year’s co-authors CN. For computing these proportions, we count the number of publications with at least one of the authors in the citing publication satisfying the rule of being in the same community (for CC) or co-author (for CN, regardless of the community). Then, we divide these counts by the total number of citations.
On an aggregated level (Figure 4 second row), our results show no statistically significant differences when researchers are in highly or non-segregated communities. However, completely segregated researchers (darker red) receive lower CC and CN than others. When we group by the core position (Figure 5 third and fourth rows), there are no differences in the periphery. However, in middle cores, highly segregated researchers have more CC and CN, and in the nucleus, non-segregated researchers have larger values. When we compare these results with the other years, for 2006, there are no differences in CC and CN for non-segregated and highly segregated researchers, but for 2014 the trends are similar to those in 2010 (Section S8).
In summary, highly segregated researchers tend to have more citations per paper when they locate in peripheral cores and more citations from their communities in middle cores. At the same time, non-segregated researchers show higher values for the 4 metrics when they are in cores near the nucleus.
Section 7 Discussion
Due to a range of social mechanisms, processes, and biases, co-authorship networks are organised in communities [29]. Within-group dynamics might lead to the emergence of segregation and polarisation, hampering innovation, social learning, and problem-solving [21, 40, 36, 18]. Nevertheless, cohesive groups allow for the development of common narratives and language, offer support and share knowledge. As such, they have been identified as a locus for exploitation (when large in central locations) and exploration (when small in the periphery) of ideas, results, and methods [33, 49]. Still, understanding segregated groups in co-authorship networks and their possible effects is limited. Here, we tackle this problem by quantifying segregation levels of communities in co-authorship networks and characterising their topological properties and position in the network.
For our case study, we analyse the co-authorship network of Computer Science in the Semantic Scholar Open Research Corpus [23]. We detect communities with the Label-propagation algorithm and compute a structural segregation metric considering the community’s links: the Spectral Segregation Index (SSI). Based on the distribution of the SSI, we identify 3 main categories and focus on just the 2 opposite limits: non-segregated and highly segregated communities. Then, we compare the communities’ size, density, clustering, and core position between categories. Furthermore, we study the relationship between segregation and impact using citations from the community’s publications.
Our results indicate that highly segregated communities tend to be more on the periphery, with some differences in density and clustering with non-segregated communities. This finding aligns with previous results [25], where the k-core structure of some empirical and randomised networks were shown to be explained by their community structure. When we analyse the total number of citations, researchers in highly segregated communities receive more citations than non-segregated ones in middle and peripheral cores. In addition, when we analyse the sources of those citations, for researchers in highly segregated communities, up to 5% more of those citations come from the same community than non-segregated communities in middle cores. Combining both results and based on previous literature, we speculate that in terms of spreading ideas and knowledge in the co-authorship network: (i) researchers in highly segregated communities attract more citations in the periphery of the network because most cited papers are not the internal ones but rather those across communities with diverse disciplines and co-authors [51]. And (ii) researchers in non-segregated communities in the nucleus are citing themselves more and are exploiting/echoing scientific research [26].
Both effects need further analysis because, as expected, highly segregated communities located on the periphery have a larger impact. Individual success correlates with the exploitation of ideas [26], but also the most innovative research (exploration of new concepts and persistent citations) comes from the periphery of networks [33], and it is done by smaller groups of researchers [49]. Here, our results align with previous evidence showing nodes in the periphery being less active [48] (i.e. publishing less in our case) but having more impact. In addition, researchers in those communities are a large population that could become a collective power that can mobilise and spread information [1] (such as scientific theories).
Researchers in larger and non-segregated communities in the nucleus also increase their impact. These results need further exploration because their central positions in the network’s nucleus increase their chance of outside interactions with highly segregated communities, which can accelerate the propagation of echoed information (ranging from biased theories to new paradigms) from local groups to reach the entire network [10]. The inner impact of highly segregated communities and their impact on the whole network should be measured to intervene, if necessary, and tackle or boost the spread of echoed information to different groups [20].
7.1 Limitations
First, our analysis does not generalise for all the years of Computer Science papers available in the Semantic Scholar database because we study just 3 years. We have developed a repeatable methodology and replicated our findings over several years. Still, further analysis is needed to understand how the transitions of researchers between different segregation levels affect their research impact over time.
Second, our analyses only generalise to some co-authorship networks because the publications of Computer Science in the Semantic Scholar Open Research Corpus represent a vast amount of literature in a discipline prone to working in small teams [28]. Further analysis of other fields is needed to understand how these patterns apply to different co-authorship structures.
Third, we did not classify the core-periphery type of our network. Recent work has highlighted the importance of understanding if the network is prone to be divided into cores as layers (as we did with the k-core decomposition algorithm) or if a hub/spoke core division is a better descriptor [16]. However, their results show that authorship networks are the most prone to have a core-layered typology, as we used in the current work. In further analyses, the definition of segregated communities should also consider the co-authorship network’s core typology.
Finally, our fourth limitation relies on using the extreme values of the SSI’s PDF from the co-authorship networks to define segregation categories of communities. A more precise analysis could consider continuous values of the SSI, other features and data to represent better the consumption and production of scientific knowledge [50]. Future work could consider a continuous comparison of the metrics used in this analysis, publications’ content, researchers’ demographic diversity, and interdisciplinary citations.
7.2 Future research
Future research on this topic could consider: (i) the temporal analysis of segregated communities and their relation to gaining more or fewer citations over time, (ii) the analysis of the diversity of the scientific publications inside the communities using opinion distance [40] and their demographic diversity to understand if the segregated and isolated communities are not diverse and echoing research to the point of becoming polarised, (iii) the definition of lead researchers (using the hub/spoke core or author position in the publications) and the understanding of their relationship to segregated communities [17], iv) the measurement of the impact of segregated communities on the topology of the network formation and the spreading processes of scientific theories [47].
Declarations
Availability of data and materials
The datasets generated and/or analysed during the current study are available in the Semantic Scholar repository, https://www.semanticscholar.org/product/api
Competing interests
The authors declare that they have no competing interests.
Author’s contributions
All authors conceived and designed the research. AMJ acquired the data. AMJ, HTPW, NP and RM analysed the data. All authors discussed the research, wrote and approved the final version of the manuscript.
Acknowledgements
The authors would like to thank the U.S. Army Research Office for the partial support provided to RM under grant number W911NF-18-1-0421. AMJ is funded by a PhD studentship from the UK Engineering and Physical Sciences Research Council. No funding bodies had any influence over the content of this report.
References
- [1] P. Barberá, N. Wang, R. Bonneau, J. T. Jost, J. Nagler, J. Tucker, and S. González-Bailón. The critical periphery in the growth of social protests. PLoS ONE, 2015.
- [2] A. Barrat, M. Barthélemy, R. Pastor-Satorras, and A. Vespignani. The architecture of complex weighted networks. Proceedings of the National Academy of Sciences, 101(11):3747–3752, 2004.
- [3] V. Batagelj and M. Zaversnik. An O(m) algorithm for cores decomposition of networks. arXiv:0310049, 2003.
- [4] L. M. Bettencourt, D. I. Kaiser, and J. Kaur. Scientific discovery and topological transitions in collaboration networks. Journal of Informetrics, 3(3):210–221, 2009.
- [5] V. D. Blondel, J. L. Guillaume, R. Lambiotte, and E. Lefebvre. Fast unfolding of communities in large networks. Journal of statistical mechanics: theory and experiment, 2008(10):P10008, 2008.
- [6] M. Bojanowski and R. Corten. Measuring segregation in social networks. Social Networks, 2014.
- [7] T. J. Cann, I. S. Weaver, and H. T. Williams. Is it Correct to Project and Detect? Assessing Performance of Community Detection on Unipartite Projections of Bipartite Networks, volume 812. Springer International Publishing, 2019.
- [8] A. Clauset, M. E. Newman, and C. Moore. Finding community structure in very large networks. Physical review E, 70(6):066111, 2004.
- [9] B. Cronin and C. R. Sugimoto. Scholarly Metrics under the Microscope: From Citation Analysis to Academic Auditing ASIST Monograph Series, Medford, NJ, medford, n edition, 2015.
- [10] J. T. Davis, N. Perra, Q. Zhang, Y. Moreno, and A. Vespignani. Phase transitions in information spreading on structured populations. Nature Physics, 2020.
- [11] M. Del Vicario, G. Vivaldo, A. Bessi, F. Zollo, A. Scala, G. Caldarelli, and W. Quattrociocchi. Echo Chambers: Emotional Contagion and Group Polarization on Facebook. Scientific Reports, 6:1–12, 2016.
- [12] F. Echenique and R. G. Fryer. A measure of segregation based on social interactions. Quarterly Journal of Economics, 2007.
- [13] D. Fanelli and V. Lariviere. Researchers’ individual publication rate has not increased in a century. PLOS ONE, 11(3):1–12, 2016.
- [14] S. Fortunato, C. T. Bergstrom, K. Börner, J. A. Evans, D. Helbing, S. Milojević, A. M. Petersen, F. Radicchi, R. Sinatra, B. Uzzi, A. Vespignani, L. Waltman, D. Wang, and A. L. Barabási. Science of science. Science, 359(6379), 2018.
- [15] S. Fortunato and D. Hric. Community detection in networks : A user guide. Physics Reports, 659:1–44, 2016.
- [16] R. J. Gallagher, J. G. Young, and B. F. Welles. A clarified typology of core-periphery structure in networks. Science Advances, 2021.
- [17] L. Guo, J. A. Rohde, and H. Wu. Who is responsible for Twitter’s echo chamber problem? Evidence from 2016 U.S. election networks. Information Communication and Society, 23(2):234–251, 2020.
- [18] A. D. Henry, P. Prałat, and C. Q. Zhang. Emergence of segregation in evolving social networks. Proceedings of the National Academy of Sciences of the United States of America, 108(21):8605–8610, 2011.
- [19] J. Huang, A. J. Gates, R. Sinatra, and A. L. Barabási. Historical comparison of gender inequality in scientific careers across countries and disciplines. Proceedings of the National Academy of Sciences of the United States of America, 117(9):4609–4616, 2020.
- [20] Z. S. Jalali, W. Wang, M. Kim, H. Raghavan, and S. Soundarajan. On the information unfairness of social networks. Proceedings of the 2020 SIAM International Conference on Data Mining, SDM 2020, pages 613–621, 2020.
- [21] S. Kim. Directionality of information flow and echoes without chambers. PLoS ONE, 14(5):1–22, 2019.
- [22] A. Lancichinetti, J. Saramäki, M. Kivelä, and S. Fortunato. Characterizing the community structure of complex networks. PLoS ONE, 2010.
- [23] K. Lo, L. L. Wang, M. Neumann, R. Kinney, and D. Weld. S2ORC: The Semantic Scholar Open Research Corpus. 2020.
- [24] F. B. Lynn. Diffusing through disciplines: Insiders, outsiders, and socially influenced citation behavior. Social Forces, 93(1):355–382, 2014.
- [25] I. Malvestio, A. Cardillo, and N. Masuda. Interplay between $$k$$-core and community structure in complex networks. Scientific Reports, 10(1):14702, 2020.
- [26] W. Mason and D. J. Watts. Collaborative learning in networks. Proceedings of the National Academy of Sciences of the United States of America, 109(3):764–769, 2012.
- [27] M. E. Newman. Who is the best connected scientist?a study of scientific coauthorship networks. Complex Networks, pages 337–370, 2004.
- [28] M. E. J. Newman. The structure of scientific collaboration networks. PNAS, 2001.
- [29] M. E. J. Newman. Finding community structure in networks using the eigenvectors of matrices. Phys. Rev. E, 74:036104, Sep 2006.
- [30] M. E. J. Newman and M. Girvan. Finding and evaluating community structure in networks. Phys. Rev. E, 69:026113, Feb 2004.
- [31] M. W. Nielsen, C. W. Bloch, and L. Schiebinger. Making gender diversity work for scientific discovery and innovation, 2018.
- [32] T. Opthof, R. Coronel, and M. J. Janse. The significance of the peer review process against the background of bias: priority ratings of reviewers and editors and the prediction of citation, the role of geographical bias. Cardiovascular Research, 56(3):339–346, 12 2002.
- [33] D. T. Painter, B. C. Daniels, and M. D. Laubichler. Innovations are disproportionately likely in the periphery of a scientific network. Theory in Biosciences, 140(4):391–399, 2021.
- [34] R. K. Pan, K. Kaski, and S. Fortunato. World citation and collaboration networks: uncovering the role of geography in science. Scientific Reports, 2(1):902, 2012.
- [35] R. K. Pan, A. M. Petersen, F. Pammolli, and S. Fortunato. The memory of science: Inflation, myopia, and the knowledge network. Journal of Informetrics, 12(3):656–678, 2018.
- [36] N. Perra and L. L. E. Rocha. Modelling opinion dynamics in the age of algorithmic personalisation. Scientific Reports, 9(1):1–11, 2019.
- [37] P. Pons and M. Latapy. Computing communities in large networks using random walks.. Computer and Information Sciences-ISCIS 2005: 20th International Symposium, Istanbul, Turkey, October 26-28, 2005. Springer, 2021.
- [38] U. N. Raghavan, R. Albert, and S. Kumara. Near linear time algorithm to detect community structures in large-scale networks.. Physical review E, 76(3):036106, 2007.
- [39] M. Rosvall and C. T. Bergstrom. Maps of random walks on complex networks reveal community structure. Proceedings of the national academy of sciences, 105(4):1118–1123, 2008.
- [40] K. Sasahara, W. Chen, H. Peng, G. L. Ciampaglia, A. Flammini, and F. Menczer. Social influence and unfollowing accelerate the emergence of echo chambers. Journal of Computational Social Science, 2021.
- [41] D. W. Scott. Multivariate density estimation: theory, practice, and visualization. John Wiley & Sons, 2015.
- [42] M. J. Smith, C. Weinberger, E. M. Bruna, and S. Allesina. The scientific impact of nations: Journal placement and citation performance. PLoS ONE, 9(10):1–6, 2014.
- [43] D. H. Sonnenwald. Scientific collaboration. Annual Review of Information Science and Technology, 2007.
- [44] C. R. Sugimoto, V. Lariviere, C. Ni, Y. Gingras, and B. Cronin. Global gender disparities in science. Nature, 504:211–213, 2013.
- [45] C. R. SUNSTEIN. #Republic. Princeton University Press, ned - new edition edition, oct 2018.
- [46] M. Tedre The science of computing: shaping a discipline. CRC Press, 2014.
- [47] P. Törnberg. Echo chambers and viral misinformation: Modeling fake news as complex contagion. PLoS ONE, 2018.
- [48] H. T. Williams, J. J. R. McMurray, T. Kurz, and F. Hugo Lambert. Network analysis reveals open forums and echo chambers in social media discussions of climate change. Global Environmental Change, 32:126–138, 2015.
- [49] L. Wu, D. Wang, and J. A. Evans. Large teams develop and small teams disrupt science and technology. Nature, 566(7744):378–382, 2019.
- [50] A. Zeng, Z. Shen, J. Zhou, J. Wu, Y. Fan, Y. Wang, and H. E. Stanley. The science of science: From the perspective of complex systems, 2017.
- [51] C. Zingg, V. Nanumyan, and F. Schweitzer. Citations driven by social connections? A multi-layer representation of coauthorship networks. Quantitative Science Studies, 1(4):1493–1509, 2020.