2 Lund Observatory, Department of Astronomy and Theoretical Physics, Lund University, Box 43, 221 00 Lund, Sweden,
e-mail: Anders.Johansen@sund.ku.dk
Anatomy of rocky planets formed by rapid pebble accretion
I. How icy
pebbles determine the core fraction and FeO contents
We present a series of papers dedicated to modelling the accretion and differentiation of rocky planets that form by pebble accretion within the lifetime of the protoplanetary disc. In this first paper, we focus on how the accreted ice determines the distribution of iron between the mantle (oxidized FeO and FeO1.5) and the core (metallic Fe and FeS). We find that an initial primitive composition of ice-rich material leads, upon heating by the decay of 26Al, to extensive water flow and the formation of clay minerals inside planetesimals. Metallic iron dissolves in liquid water and precipitates as oxidized magnetite Fe3O4. Further heating by 26Al destabilizes the clay at a temperature of around 900 K. The released supercritical water ejects the entire water content from the planetesimal. Upon reaching the silicate melting temperature of 1,700 K, planetesimals further differentiate into a core (made mainly of iron sulfide FeS) and a mantle with a high fraction of oxidized iron. We propose that the asteroid Vesta’s significant FeO fraction in the mantle is a testimony of its original ice content. We consider Vesta to be a surviving member of the population of protoplanets from which Mars, Earth, and Venus grew by pebble accretion. We show that the increase in the core mass fraction and decrease in FeO contents with increasing planetary mass (in the sequence Vesta – Mars – Earth) is naturally explained by the growth of terrestrial planets outside of the water ice line through accretion of pebbles containing iron that was dominantly in metallic form with an intrinsically low oxidation degree.
Key Words.:
Earth – meteorites, meteors, meteoroids – planets and satellites: formation – planets and satellites: atmospheres – planets and satellites: composition – planets and satellites: terrestrial planets1 Introduction
How our Earth formed is a question of major importance in contemporary astrophysics, cosmochemistry, and geochemistry, not only to explain the origin of our own planet but also to understand the prevalence of potentially habitable planets orbiting other stars (Anglada-Escudé et al., 2016; Gillon et al., 2017; Raymond et al., 2021). The classical theory of terrestrial planet formation was developed around mutual collisions within a population of large protoplanets and smaller planetesimals. The runaway phase of planetesimal accretion terminates when the protoplanets reach the oligarchic growth phase, characterized by a low number of regularly spaced planetary embryos orbiting within an excited planetesimal population (Kokubo & Ida, 1998). Subsequent growth occurs by orbital perturbations and giant impacts over approximately 30–100 Myr (Chambers, 2001). The moon-forming giant impact is envisioned to be the last major mass contribution to Earth (Canup & Asphaug, 2001).
If the terrestrial planets did form through planetesimal accretion, then it should in principle be possible to match the composition of Earth to an extant asteroid or meteorite class that is a remnant of the planetesimal population that formed around 1 AU in the solar protoplanetary disc. The enstatite chondrites, a class of very chemically-reduced meteorites associated with the inner Solar System (Warren, 2011), do have the right isotopic composition of elements such as Cr and Ti, but the moderately volatile elements (such as Na and K) and moderately refractory elements (such as Si) in the enstatite chondrites are much less depleted than on our Earth (Javoy, 1995; Javoy et al., 2010; Braukmüller et al., 2019). It has therefore been proposed that the enstatite chondrites constitute a sister clade to the unknown reservoir that formed Earth (Dauphas, 2017; Morbidelli et al., 2020).
In contrast, the isotopic composition of Earth can also be matched by an approximately equal contribution of inner Solar System material, with meteorites from the early formed and thermally processed ureilite parent body as one extreme endmember and outer Solar System material akin to CI chondrites as the other (Schiller et al., 2018, 2020). This combination of inner and outer Solar System material intriguingly also agrees with the depletion of moderately volatile elements of Earth compared to the solar abundance: the depletion pattern of volatile elements on Earth has a similar shape to that found for carbonaceous chondrites (Palme & O’Neill, 2003; Mahan et al., 2018; Braukmüller et al., 2019), with a particular affinity for the chondrule component of these meteorites (Amsellem et al., 2017). Chondrules from carbonaceous chondrites in fact have elevated Mg/Si ratios similar to Earth (Hezel & Palme, 2010); thus the thermal processing that caused Earth’s low Si abundance may have occurred already during the chondrule formation step rather than being inherited from accretion of internally heated planetesimals that experienced evaporative mass loss of both volatile elements and moderately refractory elements (Hin et al., 2017).
The pebble accretion model was developed mainly to explain the formation of the cores of gas-giant planets within the lifetime of the gaseous protoplanetary disc (Ormel & Klahr, 2010; Lambrechts & Johansen, 2012). Johansen et al. (2015), Schiller et al. (2018), Schiller et al. (2020) and Johansen et al. (2021) found evidence from cosmochemical isotope data and pebble accretion theory that the Earth formed mainly by the accretion of chondrules and primitive dust-aggregate pebbles. A pebble accretion model is appealing to match the isotopic constraints since the incorporation of pebbles of outer Solar System composition is naturally achieved by the radial drift of these pebbles (Schiller et al., 2018). Importantly, the pebble accretion model connects the formation of terrestrial planets to the formation of super-Earths, which is a widespread outcome of planet formation around other stars, with these two different outcomes of planet formation only being distinguished by the magnitude of the pebble flux through the protoplanetary disc (Lambrechts et al., 2019).
The thermal processing of highly volatile species, such as H2O and organics, in the envelope of a planet growing by pebble accretion naturally limits the accreted volatile budgets to amounts similar to what is inferred for Earth (Johansen et al., 2021). This implies that terrestrial planets could have formed outside of the water ice line, without invoking ice-poor conditions in this cool region (Morbidelli et al., 2016). The amount of water and carbon delivered to the growing planets by pebble snow will be relatively constant, in contrast to the traditional picture of volatile delivery through impacts that deliver a stochastic water amount with an intrinsically large variation (Raymond et al., 2004). In contrast to the water ice, more refractory minerals such as enstatite and forsterite (MgSiO3 and Mg2SiO4, the main carriers of magnesium and silicon) and iron (either pure or bound with sulfur to form FeS) survive down to the planetary surface without significant sublimative mass loss, when planets are in the mass range of the terrestrial planets (Brouwers et al., 2018).
Pebble accretion also differs from classical terrestrial planet formation models by its rapid accretion timescale, which implies that the continuous release of accretion energy is the major contributor to the temperature distribution within a growing protoplanet. The formation of the terrestrial planets beyond the water ice line furthermore implies that the growing protoplanet initially contains a significant ice fraction. Lichtenberg et al. (2019) modelled the efficient loss of water from planetesimals after heating and melting by decay of the short-lived radionuclide 26Al. However, chemical reaction between water and metal also leads to the formation of oxidized iron (denoted here FeO although it covers more oxidized FeO1.5 as well) that resides in the silicates and does not enter the core. Hence planetary growth exterior of the water ice line will have important consequences for the core mass fraction of terrestrial planets. The FeO fraction of the building blocks of the terrestrial planets is normally considered to be an increasing function of the distance from the Sun (Righter & O’Brien, 2011; Rubie et al., 2015), inspired by the low FeO fraction of Mercury and the enstatite chondrites representing the inner Solar System and the high FeO fraction of Vesta and the carbonaceous chondrites representing the outer Solar System. The core mass fraction thus becomes a decreasing function of the distance from the Sun in the classical terrestrial planet formation model.
The pebble accretion model for terrestrial planet formation was proposed very recently but has already been challenged, particularly on the cosmochemical evidence for an outer Solar System material contribution to Earth. The isotopic composition of Earth and Mars plot among meteorites from the inner Solar System (the non-carbonaceous chondrites) but lean towards meteorites from the outer Solar System (the carbonaceous chondrites) in the major lithophile (rock-loving) elements such as Cr, Ti and Ca (Trinquier et al., 2009; Warren, 2011; Schiller et al., 2020). However, other elements tell a more complex story. For the siderophile trace element Mo, whose isotope signature in Earth is controlled by the last few percent of accretion (Dauphas, 2017), bulk silicate Earth falls between an outer and inner Solar System isotope composition – but such mixing seems to require an s-process rich source that has not been identified in the meteoritic record so far (Budde et al., 2016). Two-isotope plots of Mo show a line of depletion of s-process enriched Mo that likely resides within presolar SiC grains formed in outflows from AGB stars (Dauphas et al., 2002; Sanders & Scott, 2021).
The lack of outer Solar System meteorites enriched in s-process Mo relative to the Earth led Burkhardt et al. (2021) to propose that Earth formed from an unseen reservoir of planetesimals, thereby ’refuting’ a pebble accretion origin of Earth. The matrix of CV chondrites is nevertheless enriched in s-process Mo while the chondrules are strongly depleted (Budde et al., 2016), likely due to thermal destruction of SiC grains in the chondrule formation process. This raises the question why the CI chondrites, otherwise considered to represent the final accretion of Earth from primitive outer Solar System material (Schiller et al., 2020), are not similarly enriched as CV matrix in s-process Mo. We speculate here that CI chondrites have undergone substantial heating and aqueous alteration and that matrix therefore became mixed with dissolved chondrules, in line with other studies showing that CI may not represent the most primitive material (Asplund et al., 2021). The CV chondrite parent body, on the other hand, experienced less water flow and hence its matrix maintained a primordial signature of s-process enriched Mo. Using CV matrix as representative of outer Solar System material, Mo isotopes then actually do record an outer Solar System contribution to Earth – and this makes models constructed to avoid outer Solar System contamination of Earth unnecessary (Izidoro et al., 2021a; Mah et al., 2021; Izidoro et al., 2021b; Morbidelli et al., 2021). In the pebble accretion model, the presence of Jupiter in the Solar System mainly affected terrestrial planet formation by preventing large chondrules and CAI from passing its gap (Desch et al., 2018; Haugbølle et al., 2019) while at the same time allowing small dust aggregates to drift to the inner Solar System where it recoagulated to form pebbles (Dr\każkowska et al., 2019; Liu et al., 2022). These pebbles then fed the final accretion stages of the terrestrial planets.
This paper is the first in a series of papers where we explore the interior structure and outgassed atmosphere of rocky planets that formed by pebble accretion. The pebble accretion model has a number of important differences from classical terrestrial planet formation: (i) the terrestrial planets in the Solar System formed exterior of the water ice line, (ii) water, carbon and nitrogen are delivered in predictable amounts through accretion of cold pebbles, (iii) the immense pebble accretion energy leads to formation of a global magma ocean on the growing planets, (iv) metal separates from the silicates in this basal magma ocean to form a core and mantle during the main accretion phase and (v) the early-delivered volatiles are continuously distributed between core, mantle and atmosphere by their partition coefficients and solubility. This coupling, together with early mass loss driven by XUV radiation from the young star, defines the composition of the outgassed atmosphere and hence the conditions for prebiotic chemistry on the planetary surface.
We start here in Paper I by describing the core design of our planetary differentiation code ADAP (Accretion and Differentiation of Asteroids and Planets). We use the code first to model the thermal evolution and differentiation of a planetesimal with a radius of 250 km, to demonstrate that Vesta is a surviving protoplanet that lost out in the competition for pebbles to other protoplanets that grew to form Mars, Earth and Venus. We show that the melting of Vesta’s primordially accreted ice led to oxidation of the iron to form magnetite. Coupling this model to the terrestrial planet growth tracks of Johansen et al. (2021), we show that the FeO mass fraction of a planet is a decreasing function of the planetary mass and that the FeO contents of Vesta, Mars and Earth all fit with the expectations from early oxidation by interaction with water after the seed protoplanet melted, combined with later accretion of relatively reduced material whose iron is predominantly (approximately 90%) in metallic form. The core mass fraction thus becomes an increasing function of the planetary mass – and this way pebble accretion naturally provides a prediction for how the core mass fraction depends on the planetary mass, without invoking a spatially dependent oxidation state of the source material.
This paper is organized as follows. In Section 2 we describe the basic functionality of the ADAP code in terms of planetary heating and differentiation. We present the results from the code in Section 2 on the internal evolution of Vesta-sized planetesimals that form with various initial abundances of radioactive 26Al/27Al. We use these simulations to map out the time-dependent formation regions of different planetesimal types characterized by their degree of internal differentiation and their mantle FeO contents. In Section 4 we apply the results of Section 3 to calculate the core mass fraction and FeO mantle fraction for terrestrial planets that form by pebble accretion using the growth tracks presented in Johansen et al. (2021). We find that the FeO mass fraction is a decreasing function of planetary mass, while the core mass fraction shows the opposite trend. These results are in good agreement with the measured core mass fractions and FeO mantle fractions of Vesta, Mars and Earth. Finally, in Section 5 we summarize the results of Paper I.
2 The ADAP code
We present here the ADAP code (Accretion and Differentiation of Asteroids and Planets). The code solves the 1-D thermal conduction equation on a spherically symmetric grid. Importantly, the code includes the time-dependent melting of the layers and the sinking of denser material through lighter material, while conserving the total energy. The code considers three heat sources: (1) decay of short-lived radionuclides, (2) accretion and (3) differentiation.
2.1 Basic materials
ADAP bundles, for simplicity, the interior composition of asteroids and planets into five basic materials:
-
1.
Metal (Met)
-
2.
Silicate (Sil)
-
3.
Water (Wat)
-
4.
Clay (Cla)
-
5.
Oxidized metal (MeO)
Here, Met represents metal (consisting of iron Fe, iron-sulfide FeS and nickel Ni) that will enter the core upon planetary melting due to their higher density than the silicates. Sil represents the silicates (consisting of SiO2 and MgO) with lower density and higher melting points than metal. Wat represents water, a major planetary building block beyond the ice line. Using the standard solar abundance values from Lodders (2003), we use normalized metal and silicate mass fractions and . We assume further that all carbon in the protoplanetary disc binds with oxygen to form the ultravolatile molecule CO and that all Si atoms bind with two O and all Mg atoms with one O. This yields a surplus oxygen abundance to produce water with an additional mass fraction , for a total mass of 1.38 of MetSilWat when normalized to the sum of metal and silicates.
Clay (Cla) is simplified as an attachment of a water molecule to a silicate mineral; we assume 15% water mass fraction in clay minerals with an Mg:Si ratio of approximately one (Lange & Ahrens, 1982). Considering clay as a single species is a simplification (Wilson et al., 2006), but this approach is designed to capture in the simplest fashion the main storage of water in silicates as well as its desiccation upon further heating. We treat oxidized metal (MeO) by attaching oxygen atoms to the available iron and nickel atoms to form FeO4/3 and NiO after the ice melts (see discussion in Section 2.2). Iron atoms bound with sulfur (FeS) are assumed to be protected from oxidation and hence provide a baseline amount of core-forming Met material even when the water abundance is high enough to oxidize all metal.

2.2 Material transitions
We show an overview of how ADAP treats materials and their transitions in Figure 1. The three fundamental species (Met, Sil and Wat) combine into the primitive starting material MetSilWat. We assume that this material melts in several distinct stages. At the melting temperature of water ( K), the primitive and volatile-rich material MetSilWat splits into Wat and MetMeOCla, with the relative fractions of siderophile Met and lithophile MeO set by the available sulfur (we set S/Fe 0.5 by number, following the solar composition of Lodders, 2003). The surplus water separates into a pure water annulus containing all the water molecules that were not consumed by clay formation and metal oxidation.
Metallic iron and metallic nickel dissolve readily in water to form ferrous hydroxide and nickel hydroxide . Here iron and nickel are doubly ionized (Fe2+ and Ni2+). Further oxidation of to occurs at temperatures above (Fattah-alhosseini et al., 2016), precipitating out as insoluble magnetite by the Schikorr reaction
| (1) |
We can consider CI chondrites as samples of a minor body that oxidized its iron during aqueous alteration. Iron in the CI chondrites have an average valence state of 2.77 (Sutton et al., 2017). This corresponds approximately to magnetite that has a mean valence state of . We therefore bind water molecules to each iron above the melting temperature of water to mimic the formation of magnetite. The CI chondrites are part of the CC (carbonaceous chondrite) group of meteorites, but we note that evidence of oxidation of metallic iron by water has also been found in the ureilites from the NC (non-carbonaceous) group, from the measured correlation between oxidized iron and enrichment in the two heavy isotopes of oxygen that are associated with water (Sanders et al., 2017). Nickel has only two valence electrons and hence oxidation can not proceed beyond Ni2+.
The clay is assumed to desiccate at 900 K, releasing its (super-critical) water contents. We use here a characteristic desiccation temperature for the clay mineral serpentine; see Lange & Ahrens (1982) for a discussion of the possible range of desiccation temperatures for a range of clay minerals. The remaining solid has the composition MetMeOSil.
The next melting event is the Fe-Ni-FeS mixture which is assumed to have a solidus (0% melting) and liquidus (100% melting) temperature following
| (2) |
with for the solidus and for the liquidus of Fe-Ni-FeS, and (Sahijpal & Bhatia, 2015). We assume here that the metallic melt does not percolate to form a core until the silicates have melted significantly (see discussions on the efficiency of percolation in Monteux et al., 2018). However, we do include the latent heat of the melting metal (see Section 2.6).
The metal and the silicates finally split from the MetMeOSil at the silicate melting temperature to form liquid Met and liquid MeOSil. We assume that MeO is minerally bound to the silicates and therefore remains in the mantle. For the melting temperature of Sil we consider two branches (Monteux et al., 2016). For low pressures, GPa, we use equation (2) with , and for the solidus and , and for the liquidus. For GPa we use instead , and for the solidus and , and for the liquidus.
After the temperature in the envelope of the planet reaches the sublimation temperature of water, which is the case for protoplanet masses above approximately (Johansen et al., 2021), we no longer allow the planet to accrete water. Instead the basic accreted material becomes MetSil, which separates to Met and Sil at the silicate melting temperature. The mantle of the final planet thus consists of the two components FeOSil and Sil.
2.3 Material densities
For the five basic material densities we choose:
-
1.
(Fe+Ni+FeS) or
(pure FeS after melting MetSilWat) -
2.
-
3.
-
4.
(Sil+H2O)
-
5.
(FeO+NiO)
Here the low density of Met reflects its high contents of sulfur (Morard et al., 2018; Johnson et al., 2020) and the density of Sil is based on the uncompressed density of iron-depleted mantle material (Elkins-Tanton & Seager, 2008). We assume for simplicity that the densities are constant irrespective of temperature and pressure. The densities of composite layers made out of these five base materials are constructed using volume partitioning,
| (3) |
where is the normalized mass fraction, with for each layer. Clay contains 15% by mass; we include here the full mass of the H2 molecule and ignore any outgassing of hydrogen in the clay formation process. The formation of oxidized metal MeO, on the other hand, is associated with hydrogen loss. We do not keep track of this lost hydrogen since clay formation happens in the earliest stages of planetary growth where the protoplanet cannot yet hold onto an outgassed atmosphere.
2.4 Differentiation
We require that the material density decreases outwards from the centre for stability. If a denser layer lies on top of a lighter layer, then we swap the two layers. We calculate the new gravitational binding energy after the swap and add the binding energy difference to the thermal energy of the two layers. We require the two layers to maintain a shared temperature after the addition of the thermal energy. This approach conserves total energy (gravitational plus thermal) in the differentiation process.
2.5 Heat transport
We solve for the total energy present in each spherical shell. We choose to have as the evolved variable because this eases the division of the total energy between latent heat and temperature (see Section 2.6). We numerically solve the heat transfer equation
| (4) |
Here is the heat flux and is the heat conductivity. We follow Desch et al. (2009) and discretize the heat transport across the interface between shell and shell in an upwinded fashion,
| (5) |
Here is the radial grid size. We consider the mean of the heat conductivities across the interface to avoid building up spuriously large temperature gradients at interfaces between liquid and solid layers. The evolution equation for the energy of cell , , becomes
| (6) |
2.6 Heat capacities and latent heat
We translate the energy in a cell to temperature taking into account both the heat capacity and the latent heats. Heat capacities and latent heats are assumed to be constant, independent of pressure and temperature. This way the translation from energy to temperature can be calculated quickly and precisely using analytical formulae. We use the NIST Chemistry Handbook (Linstrom & Mallard, 2021) and Lange & Ahrens (1982) to identify approximate values for the heat capacity relevant at high temperatures:
-
1.
-
2.
-
3.
-
4.
-
5.
We ignore the increase in as the temperature reaches the critical temperature for the material. The combined heat capacities of composite materials are calculated from
| (7) |
where are the mass fractions and .
The latent heats of melting of the basic materials are assumed to take the constant values (Sahijpal et al., 2007)
-
1.
-
2.
-
3.
We ignore heat consumption in clay desiccation and set . The latent heats of the composite materials are calculated from
| (8) |
where represents Met, Sil and Wat and their total mass fractions in a composite material. In this approach, the O in MeO is inherited from oxidation of Fe and Ni by water and hence the translation of the energy of a liquid MeO layer to temperature must, for consistency, take into account the latent heat of both iron and water. Similar considerations apply to the Cla material component.
2.7 Thermal expansion coefficient
The coefficient of thermal expansion is defined as
| (9) |
where denotes the volume. The coefficient enters calculations of the adiabat and the convective heat conduction. For the basic materials we take pressure and temperature-dependent parametrizations for from Chen et al. (2007), from Abe (1997) and for ice from Desch et al. (2009) and for water from the IAPWS database (see Paper II).
2.8 Conduction and convection
Equation (4) describes heat transport by conduction with conductivity . We take approximate heat conductivity values from Desch et al. (2009) and Neumann et al. (2012):
-
1.
-
2.
-
3.
The heat conductivity of mixed layers is calculated using the geometric mean model (Neumann et al., 2012)
| (10) |
where is the volume fraction of component , is the mass fraction and is the component density.
Convection is treated as an increased effective heat conduction (Hevey & Sanders, 2006). The Nusselt number, defined as
| (11) |
with denoting the energy flux divided by the temperature difference and the length-scale of the layer, describes the effective heat conduction due to convection relative to the microscopic heat conduction, . We consider convection to be a localized increased heat transport with conductivity . We can thus write the Nusselt number as
| (12) |
The effective heat conductivity depends on the melting degree defined by
| (13) |
The solidus temperature and liquidus temperature are composition dependent and follow equation (2).
Computer simulations of convection can be used to connect the Nusselt number to the Rayleigh number , which describes the stability criterion for convection. The Rayleigh number is defined as
| (14) |
where is the coefficient of thermal expansion, is the heat capacity of the fluid, is the density, is the gravitational acceleration, is the drop in potential temperature over the convective layer (i.e. the temperature drop relative to the adiabatic temperature drop), is the length-scale of the layer, is the heat conduction coefficient and is the dynamic viscosity of the fluid. We follow Monteux et al. (2016) and define the dynamic viscosity between the solid end member value and the liquid end member value as
| (15) |
However, this expression is simplified compared to Monteux et al. (2016) in that we do not include the difference between the solid and molten density. The viscosity displays here an abrupt fall to around a melting degree of . We assume that the dynamic viscosity of the solid state is a constant for all materials. For the dynamical viscosity of the molten phase we take
Solomatov (2015) and Monteux et al. (2016) describe two branches to connect and . The soft turbulent regime is valid for . Here the Nusselt number is
| (16) |
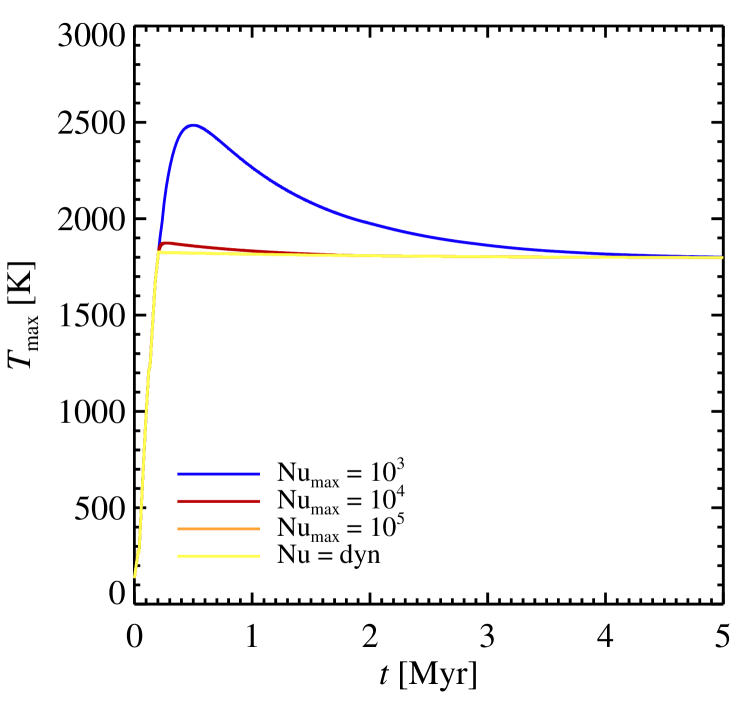
The critical Rayleigh number is approximately 1,000. The models of the asteroid Vesta analysed in this paper has Rayleigh numbers up to approximately . At Rayleigh numbers above the convective heat transport is reduced in the hard turbulence regime, with Nusselt number
| (17) |
and . This yields maximal Nusselt numbers of around for the Vesta model.
2.9 Radioactive heating
We add to the energy equation (equation 6) also the heating by decay of 26Al,
| (18) |
Here is the energy released by each decay minus the energy carried by neutrinos (Castillo-Rogez et al., 2009), is the decay rate per kg of Sil material at , is the mass of the 26Al atom and is the decay constant. We have normalized to the Sil component only. Thus is the fraction of aluminium in the silicate part the solar composition; we calculate by normalizing first relative to hydrogen and helium and then relative to the total silicate contents (Lodders, 2003). We take a base value of , but note that the initial amount of 26Al may have been lower in the terrestrial planet forming region than in the CAI forming regions closer to the star (Larsen et al., 2011; Connelly et al., 2012; Schiller et al., 2015). This gives an initial heating rate of for the silicates. By construction, the Met and Wat components have no radiogenic heating. Normalized to MetSil the heating rate is lower, . This is about 1.5 times the value considered by Hevey & Sanders (2006) for CI chondrites. However, the CI chondrites have a density of only and contain a significant amount of oxidized metal and clay.
2.10 Accretion of mass and energy
ADAP allows the planetesimal to grow in mass by accretion and includes the accretional heating of the surface. The mass accreted in each time-step is accumulated until it reaches a high enough value to create an additional grid shell on top of the existing planetesimal. This new cell inherits the temperature of the underlying grid cell. We add in each time-step accretion heat to the outermost cell,
| (19) |
Here is the gravitational constant, is the mass of the protoplanet, is the growth rate and is the radius of the protoplanet. We nevertheless ignore the accretion phase here in Paper I and we checked that indeed the accretion energy is negligible for the small planetesimals considered here. The accretion heat does become important for massive, accreting protoplanets when released under the thermal blanketing by a dense outgassed atmosphere (Matsui & Abe, 1986a, b). We discuss this further in Paper II.
2.11 Removal of outgassed atmosphere
Planetesimals and terrestrial planets forming by pebble accretion grow and evolve within the protoplanetary gas disc and hence the outgassed volatiles can escape by gas drag for low protoplanet masses. The gas flow around the protoplanet is dominated by the sub-Keplerian shear flow for low-mass objects and by the Keplerian shear flow beyond the so-called transition mass (Lambrechts & Johansen, 2012). For protoplanets below this transition mass from headwind flow to shear flow, the mass removal by the sub-Keplerian headwind can be quantified as
| (20) |
Here is the density of the atmosphere of outgassed volatiles. We assume now that , where is the scale-height of the outgassed atmosphere. That gives then
| (21) |
We rewrite the mass loss in terms of the mass removal timescale,
| (22) |
Here the removal timescale is
| (23) |
This should now be compared to the timescale for outgassing via thermal desorption,
| (24) |
Here is the saturated vapour density which describes both the equilibrium vapour density above a solid surface as well as the outgassing rate in the absence of a bound atmosphere. We consider here only outgassing by sublimation or evaporation of volatiles from the surface of planetesimals and small protoplanets; larger bodies experience instead outgassing of volatiles from the magma ocean but these protoplanets will be massive enough to retain their outgassed atmosphere. We rewrite the thermal outgassing timescale using the ideal gas law as
| (25) |
Here we made use of the fact that the surface pressure and the atmospheric mass are connected through with denoting the gravitational acceleration at the surface ( is the internal density of the protoplanet). The mass of the saturated atmosphere, , is the maximal atmosphere mass that can be sustained by thermal outgassing. The outgassing timescale is thus
| (26) | |||||
Here is the thermal speed of the molecules, here scaled to the mass of the water molecule. Comparing this expression to the mass loss timescale of equation (23), we see that the hydrodynamical timescale is longer than the outgassing timescale for all relevant and . We therefore remove the outgassed atmosphere on the hydrodynamical timescale when the protoplanet is below the transition mass between headwind flow and Keplerian shear flow. The transition mass is derived by Lambrechts & Johansen (2012) to be
| (27) |
Here is the Keplerian frequency at distance from the central star of mass . The transition mass is approximately for a nominal protoplanetary disc at 1 AU with . We hence remove the outgassed atmosphere in our model when the planetary mass is below .
3 Heating and differentiation of planetesimals
We consider Vesta as a prototype of the population of protoplanets (Russell et al., 2012) that formed in the terrestrial planet region and competed for pebbles to grow to planetary sizes. Vesta is differentiated and has an iron core of approximately 110 km in radius, giving a core mass fraction of approximately 18% (Russell et al., 2012). Its thermal evolution may be connected to that of Ceres, which remained volatile-rich and avoided core formation, with the main difference being the formation time and hence the amount of radiogenic heating available (McCord & Sotin, 2005). The mantle of Vesta contains a large fraction of oxidized iron FeO, approximately 24% inferred from HED meteorites, observations with the Dawn spacecraft and comparisons with the H-chondrites (Toplis et al., 2013; Trønnes et al., 2019). We take the high oxidation as evidence that Vesta formed exterior of the ice line with a substantial water fraction. This ice then formed clays and oxidized metallic iron when it melted, leaving the core to form mainly from FeS, which is siderophile and provides the main sulfur carrier at high temperatures (Scott et al., 2002). The clays would have subsequently dried out after heating above 900 K, leaving water only as structurally bound remnants in apatite minerals (Sarafian et al., 2014).
3.1 Planetesimal model setup
To facilitate comparisons with Vesta data and to differences between Vesta and Ceres, we fix the planetesimal radius to and the background temperature of the protoplanetary disc is set to . The radial resolution element is chosen to be . The initial composition is given in the relative proportions . This yields a total water mass fraction of 28% relative to the sum of metal and silicates. The metal material includes here sulfur in FeS and its fraction is therefore larger than the core mass fraction of Earth, which likely contains far less than the solar abundance of sulfur. The sum of Met, Sil and Wat forms the primitive MetSilWat material with a density of approximately 2,000 . We ignore for simplicity the porosity evolution of the planetesimal as well as the possibility that Al is transferred to the first melts and hence concentrated near the surface (Neumann et al., 2012; Golabek et al., 2014).
We start by testing the robustness of the numerical scheme and our treatment of convection in 1-D. In Figure 2 we show the maximum temperature within the planetesimal as a function of time for a simulation with a dynamical calculation of the Nusselt number Nu and three simulations where Nu is capped at values of , and , respectively. Evolving the planetesimal at an artificially capped Nu allows for a much longer time-step but at the expense of an exaggerated temperature in the interior. We therefore opt to run the simulations with a dynamical Nusselt number. For the planetesimal case, the dynamical Nusselt number of the water and magma layers is approximately , but for larger planets considered in Paper II and Paper III the Nusselt number reaches values 2-3 orders of magnitude larger.
3.2 Interior temperature and composition of planetesimals
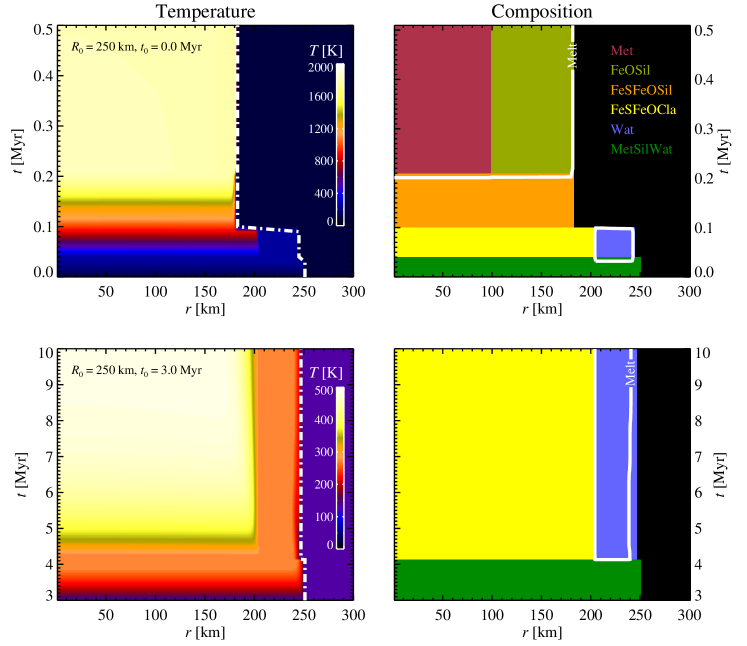
We show space-time plots of the results of our heating and differentiation model in Figure 3 for two different starting times. Our planetesimals start with a significant fraction of water mixed with metal and silicates (MetSilWat). As the water melts at the triple point of H2O, the ice component transforms to phyllosilicates, oxidized iron and a surface water layer. The water layer is expelled immediately due to its high temperature in case of the early-formed Vesta analogue. Troilite FeS remains with the silicates and is the main core forming material since it is protected from oxidation. As the temperature reaches 900 K, the water in the clay is released and expelled from the planetesimal. The iron sulfide melts at 1213 K but does not separate from the silicates before the silicates melt at approximately 1700 K. This leads to the formation of an FeS core surrounded by a mantle of silicates and oxidized iron. The results of the early-formed planetesimal agree well with other Vesta models (Ghosh & McSween, 1998; Grimm & McSween, 1989, 1993), although we demonstrate here how the high FeO contents of Vesta are likely not a consequence of any increased oxidation of iron with distance from the Sun (Righter & O’Brien, 2011), but rather a fingerprint of the accretion of Vesta outside of the water ice line with a substantial amount of ice.
The lower panels of Figure 3 show the results of forming the planetesimal later, at Myr or after approximately four 26Al half-lives. Here the maximum temperature reached is 400 K and the interior structure is dominated by a phyllosilicate ’core’ surrounded by a mantle of excess water that could not enter the clays. The water ocean crystallizes slowly after the 26Al heat runs out.
3.3 Varying the 26Al abundance
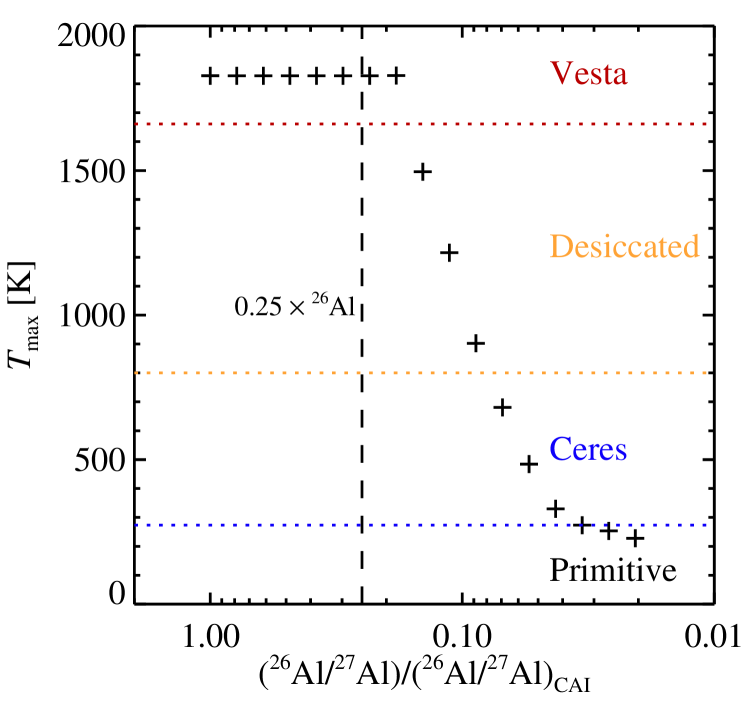
In Figure 4 we show the maximum temperature of the planetesimal as a function of the starting ratio of 26Al/27Al. The starting amount of 26Al plays a decisive role in the final composition of the planetesimal. Planetesimals that form within two half-lives of 26Al undergo the sequence of melting and differentiation that happened to Vesta; the water is then only present in the form of FeO in the final body. Forming in the interval between two and three half-lives instead leads to the formation of a desiccated body that lost its water but did not heat enough to differentiate into a silicate mantle and a metal core. Formation in the interval between three and four lifetimes gives maximum temperatures below the desiccation temperature of clay. These Ceres analogues are dominated in their interiors by clay and the mantle consists of the excess water that could not enter the phyllosilicates. Finally, primitive bodies akin to comets and Kuiper belt objects form after four half-lives of 26Al.
3.4 Mapping the thermal evolution of planetesimals
The maximum interior temperature and the initial composition can be mapped onto the thermal evolution of the inner regions of the solar protoplanetary disc. We adopt the protoplanetary model of Johansen et al. (2021), which considers the irradiation from the forming star as well as viscous heating close to the star where the ionization degree is high enough to trigger the magnetorotational instability (Desch & Turner, 2015). We take into account here that the initial 26Al/27Al ratio in the formation region of asteroids in the Solar System appears to have been lower outside of the CAI-forming region (Larsen et al., 2011; Connelly et al., 2012); we thus use 1/4 of the CAI value to be consistent with these measurements (Schiller et al., 2015). This yields the planetesimal map displayed in Figure 5. Exterior of the water ice line, FeO-rich planetesimals form by melting of the ice, unless the planetesimal forms after 1.8 Myr or so. Between the silicate sublimation front and the water ice line, we have FeO-poor bodies akin to enstatite chondrites or aubrites (Keil, 2010).

4 Core mass fraction and FeO fraction in the mantle
We will present full models of heating and differentiation of terrestrial planets forming by pebble accretion in Paper II and Paper III. Here we show an important intermediate result, namely that the core mass fraction and FeO mantle fraction of planets can be generalized directly from the planetesimal heating model presented in the previous section.
4.1 Core and mantle iron in Solar System bodies
The distribution of iron between metal core and mantle FeO within a differentiated body carries a history of the amount of water that was accreted. The fraction of FeO in the mantle is known for Venus, Earth, Mars and Vesta. The FeO fraction increases with distance from the Sun (Righter & O’Brien, 2011) and this increase is traditionally ascribed to an increasing oxidation state of the dust with increasing distance from the star. The high FeO fraction in the matrices of carbonaceous chondrites is taken as support for this picture (Rubie et al., 2015). However, the carbonaceous chondrites likely accreted with significant ice fractions and experienced extensive aqueous alteration; hence the primordial oxidation state of the iron in the pebbles that orbited around the young Sun is not known.
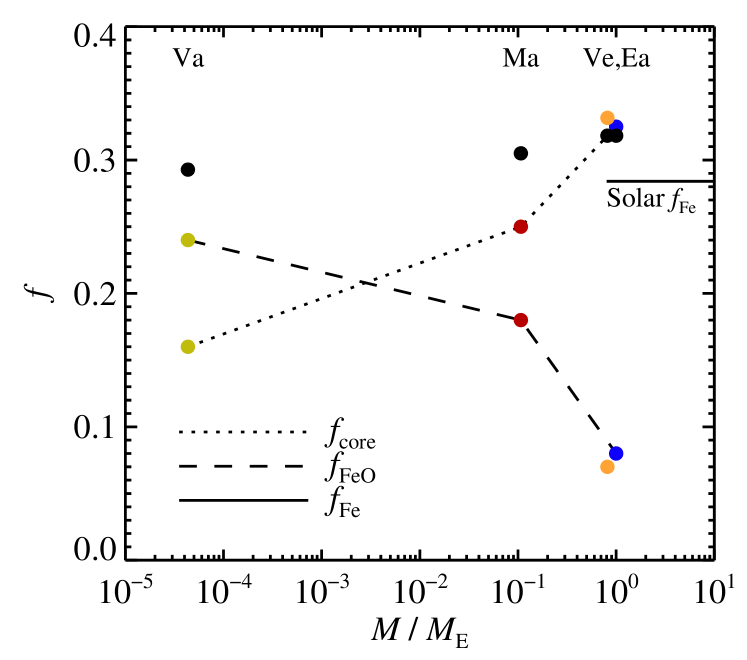
We plot the core mass fraction and the FeO mantle fraction of Vesta, Mars, Earth and Venus in Figure 6. The core size of Vesta is constrained to be approximately 110 km from the gravitational moment measured by Dawn and by geochemical measurements of HED meteorites (Ruzicka et al., 1997; Righter & Drake, 1997; Russell et al., 2012). This gives a core mass fraction of approximately 18% of the total mass of Vesta. The FeO mantle fraction is inferred to be 24% from HED meteorites that originate from Vesta (Toplis et al., 2013; Trønnes et al., 2019). For Mars, we take a core mass fraction of 25% (Rivoldini et al., 2011; Stähler et al., 2021) and the FeO mass fraction in the mantle to be 18% (Robinson & Taylor, 2001). For Earth, the core mass is , the core mass fraction is 32.5% and the FeO mass fraction in the mantle is 8% (Robinson & Taylor, 2001). For Venus, the core mass is not known but the FeO mass fraction in the mantle is estimated between 6.5% and 8.1% from the Venera landers (Surkov et al., 1984, 1986; Robinson & Taylor, 2001). The total iron is typically larger than the solar abundance of 28.4% (Lodders, 2003); this could be due to uncertainties in the measurements of core mass and FeO fraction or loss of silicon and magnesium relative to iron prior to accretion (Hin et al., 2017). Figure 6 shows that the FeO mantle fraction is a monotonically decreasing function of planetary mass, while the core mass fraction is monotonically increasing.
4.2 Light elements in the core
When discussing core mass fractions, the possible presence of lighter elements in the core becomes important to take into consideration. The density of the Earth’s core is consistent with incorporation of both Si and O into the metallic melt during differentiation (Badro et al., 2015). The cores of Vesta and Mars could both contain approximately 15% weight sulfur (Rivoldini et al., 2011). The sulfur weight fraction can be maximally 36% if the core consists entirely of FeS. Using the solar composition (Lodders, 2003) we have in number, which would yield a core mass fraction of at least 27% if all S is transported to the core in the form of siderophile FeS. This is clearly above the estimate for Vesta and Mars. Sulfur could nevertheless have entered the core and expelled later due to its incompatibility with solid iron (Johnson et al., 2020). Steenstra et al. (2019) infer 15% sulfur in the core of Vesta from chalcophile elements. This is consistent with measurements of the original S contents of iron meteorites (Chabot, 2004), later expelled due to incompatibility with the solid iron phase. We therefore consider 53% of the iron to have been originally in the form of FeS. This attachment is important, since the iron is protected from oxidation by the sulfur. We additionally consider 5% Ni in the cores and furthermore 10% light elements by mass for Venus, Earth and Vesta. For Mars, based on seismic measurements by the Insight mission, we take 5% Ni and 15% light elements in the core (Stähler et al., 2021).
4.3 The sulfur content of chondrites
The CI chondrites contain an approximately solar composition of S, with S/Fe = 0.5 – all other meteorite classes are depleted relative to this value (Ebel, 2011). FeS sublimates at approximately 700 K under nominal protoplanetary disc abundances and pressures (Lodders, 2003). This temperature makes S volatile in the envelopes of the more massive planets. S should therefore strongly record the temperature of the envelope of the parent body, with asteroids accreting nominal values and planets successively missing more S with increasing mass. Earth’s mantle contains only approximately 200 ppm of sulfur (Jackson et al., 2021), while the core of Earth may hold significant S due to metal-silicate partition coefficients in the range 100–1,000 for the relevant pressures at the core-mantle boundary (Boujibar et al., 2014; Jackson et al., 2021). Chondrules were already depleted in sulfur (Marrocchi & Libourel, 2013) and hence accretion of thermally processed chondrules constitutes an additional pathway to S depletion before accretion.
4.4 Planet formation model
We use the planet formation model of Johansen et al. (2021) to test if the pattern evident in Figure 6 is consistent with oxidation of iron by interaction with water outside of the water ice line. This model considers the formation and migration of terrestrial planets that accrete both pebbles and planetesimals. The planetesimals are assumed to form within a ring of width 0.1 AU at a distance of 2.3 AU from the host star, hence the protoplanet can only accrete planetesimals until it migrates out of the ring. The pebbles are assumed to drift through the protoplanetary disc. The planetesimal contribution is high (50%) as a protoplanet grows up to the mass of Mars; for higher masses pebble accretion strongly dominates.
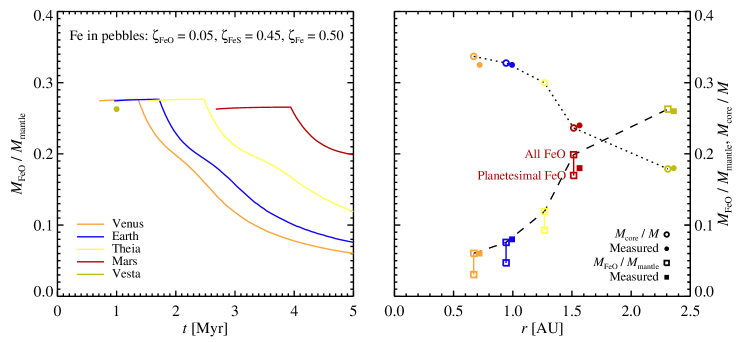
We calculate for each time-step in the planet formation model of Johansen et al. (2021) the accreted iron mass, with the iron fraction based on the total amount calculated per body in Figure 6 to take into account a varying iron content in the accreted material for the different bodies. We assume that the iron in the accreted pebbles has a low oxide fraction (FeO, 5%) and high sulfide fraction (FeS, 45%), broadly consistent with spectral analysis of interstellar dust (Westphal et al., 2019)111These authors find oxide fraction of total iron and sulfide fraction , with the remaining fraction in metallic iron form. These values are also consistent with the low FeO contents of enstatite chondrites and H ordinary chondrites where the iron has likely been reduced by chondrule formation in a reducing gas (Connolly et al., 1994). Even H chondrites, with their contents of metallic iron, are overall iron poor compared to the solar composition and may have preferentially accreted rocky chondrules over the metal nuggets that carry most of the metallic iron.. We assume that the iron accreted together with water becomes 100% oxidized. We furthermore assume that iron in the accreted planetesimals is 100% oxidized, except for the iron bound in FeS. All the protoplanets are started at AU.
4.5 Oxidation state of Vesta
The oxidation of iron by dissolution in hot water through the Schikorr reaction (equation 1) should yield an average iron oxidation similar to magnetite (Fe3O4), containing two Fe3+ and one Fe2+ to balance the four O2-. This would imply a strongly oxidizing mantle near the QFM (Quartz-Fayalite-Magnetite) buffer (Ortenzi et al., 2020). From the abundances of siderophile elements in meteorites from Vesta, on the other hand, the oxidation state seems to have been much lower, perhaps a logarithmic unit below the IW (Iron-Wüstite) buffer with very low Fe3+ fractions (Righter et al., 2016; Steenstra et al., 2019). This would seem to contrast with our oxidation mechanism presented in Section 3. However, Vesta is a small body and may have been effectively an open system in contact with the protoplanetary gas disc. The removal timescale by gas flows for an outgassed atmosphere was identified in equation (23) to be a few hours only. The QFM buffer has an oxygen fugacity (partial pressure of oxygen measured in bars) of . The mass of an outgassed oxygen atmosphere is
| (28) |
where is the radius and is the surface gravity. This yields for Vesta at the QFM buffer. With a removal timescale of from equation (23), the oxygen removal rate is . The mass of Vesta is . With an iron mass fraction of , 55% of this iron oxidized to magnetite with 4/3 O for each Fe, we get a mass of of oxygen bound with iron. The removal time of the oxygen is thus only approximately 3 Myr. Once the mantle has been reduced enough that Fe3+ becomes scarce, then the oxygen fugacity is set by the Iron-Wüstite buffer instead, approximately four orders of magnitude lower than the QFM buffer. Hence the removal timescale goes from millions of years to billions of years and the oxygen is largely protected and the oxidation state is maintained. Motivated by these considerations, we therefore assume that the magnetite formed by water flows on planetesimals is reduced to fayalite (Fe2SiO4) through oxygen outgassing and loss to the protoplanetary disc222We note that we do not take into account that the growing protoplanets may accrete planetesimals that have not yet reduced their magnetite to fayalite, nor do we include the possibility of increasing the FeO mass fraction by transfer of oxygen from SiO2 to metallic Fe (Rubie et al., 2015) or the oxidation of FeO to FeO3/2 accompanied by reduction of another FeO to Fe at high pressures in the magma ocean (Armstrong et al., 2019)..
4.6 Calculated FeO fractions
In Figure 7 we show the calculated FeO mantle fraction and core mass fraction from the planet formation model of Johansen et al. (2021). We show in the figure both the total FeO mantle fraction in the model and that of planetesimals separately, to illustrate that particularly Mars has a large contribution of FeO from accreting Vesta-like planetesimals. Overall, and despite uncertainties in both model and data, we find an intriguing match between model and measurements. The model nevertheless overpredicts the FeO fraction of the martian mantle by a few percent. This could indicate either that our source material (pebbles and differentiated planetesimals) is too rich in FeO or that some FeO has been transferred from the mantle to the core after core formation (Frost et al., 2010; Davies et al., 2020).
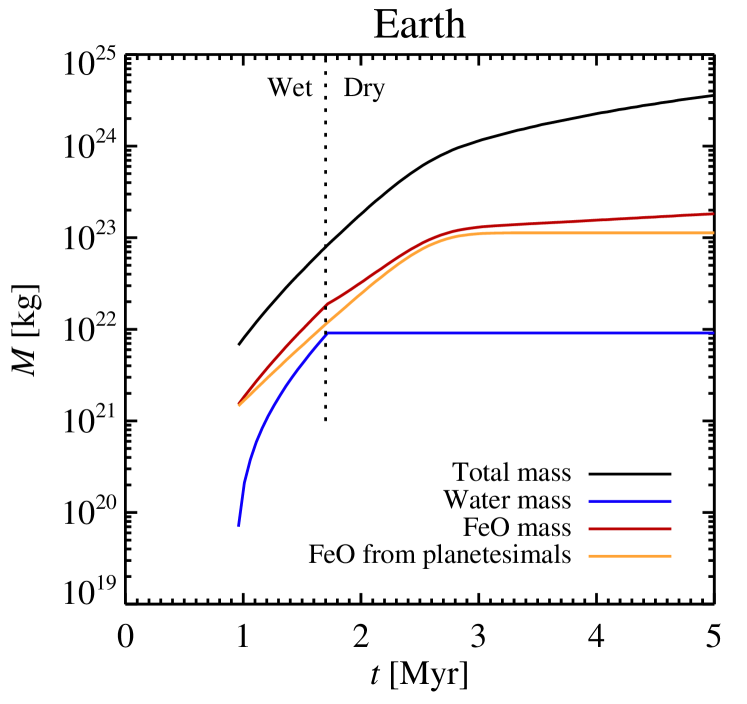
We analyse the growth and accretion of FeO for our Earth analogue more in Figure 8 to support the interpretation of the results presented in Figure 7. We ignore here, as in Figure 7, any addition of FeO to the terrestrial mantle from the impactor in the moon-forming impact. Earth starts its growth at a mass of after 1 Myr. The planet accretes initially together with significant amounts of ice, but the gas envelope becomes hot enough to sublimate water after reaching K in the envelope at a mass of approximately . The FeO accretion is at first contributed equally by iron oxidized by water flows on the growing protoplanet and by accretion of FeO-rich planetesimals (that were oxidized by a similar process on their parent bodies). Planetesimal accretion nevertheless dominates after the protoplanet stops accreting ice, but planetesimal accretion ceases as the protoplanet migrates out of its birth planetesimal ring after 2.3 Myr. The final FeO budget in the mantle is dominated by iron from the late-accreted pebbles drifting in from the outer Solar System, in agreement with the match between the iron in CI chondrites and the iron of bulk silicate Earth (Schiller et al., 2020).
4.7 Varying the pebble composition
The final FeO mass fraction depends sensitively on our assumption that the accreted pebbles were very reduced. This assumption is partially balanced by the oxidation of this iron by dissolution in hot water; particularly the early-formed planetesimals deliver a large fraction of the oxidized iron to the growing protoplanet. While the iron in the chondrules from enstatite chondrites is nearly 100% in metallic form, the ordinary chondrites contain approximately even mixtures of highly reduced Type I chondrules and oxidized Type II chondrules (Zanda et al., 2006). The chondrules from carbonaceous chondrites are dominated by reduced Type I chondrules again. This may indicate formation of chondrules under different oxygen fugacities, with the ordinary chondrite chondrules tracing a formation region interior of the water ice line where the water vapour density was high or, alternatively, formation in a denser environment where the oxygen from sublimated ices would have retained a higher partial pressure after the flash heating that melted the chondrule precursors, compared to the carbonaceous chondrite chondrules that formed further from the Sun (Jacquet et al., 2015).
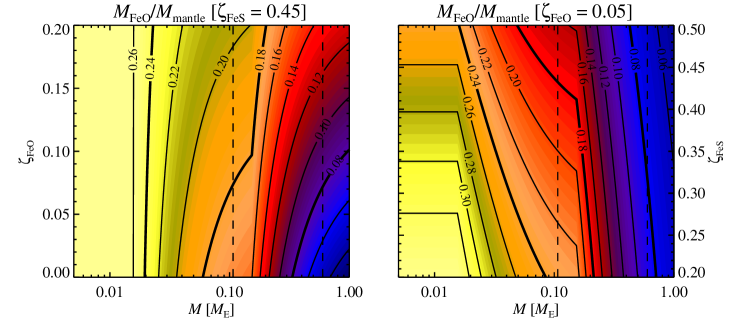
Our basic assumption of oxidation degree and sulfurization degree in the pebbles therefore needs to be interrogated. In order to make quick calculations of the final FeO mantle fraction of planetary bodies under variations of the assumptions, we employ here a simpler model compared to Figure 7. We calculate only the final FeO fraction based on the simple model: (i) the FeO fraction of the iron accreted in the first is the maximum possible given the sulfur fraction, , (ii) the FeO fraction of the accreted planetesimals is the same as the early-accreted material from (i), and (iii) 50% of the accreted mass is contributed by planetesimals up to a planetary mass of , the remaining accretion is contributed 100% by pebbles. Maps of the FeO mantle fraction are shown in Figure 9. We vary from 0 to 0.2 and from 0.2 to 0.5. The FeO mantle fraction of Mars is fit well in either case; this is due to the large contribution from accreted planetesimals with high FeO fractions so that the value of does not affect the final FeO budget of Mars strongly. Earth, on the other hand, clearly benefits from a low value of . The FeO mantle fraction of Vesta depends strongly on the assumed value of . With low values, , the core mass of Vesta becomes too small (and the FeO mantle fraction too large). The terrestrial planets, on the other hand, have FeO mantle fractions relatively insensitive to the FeS fraction. As discussed above, planets as massive as Earth and Venus may have experienced reduced S accretion due to the sublimation of sulfur from FeS in the hot envelope. Hence, Earth’s core may contain only up to one percent of sulfur (Jackson et al., 2021), while Mars’ core could be much more rich in sulfur and other moderately volatile elements (Stähler et al., 2021).
Overall, our pebble accretion model agrees well with the core mass fractions and FeO mantle fractions of Vesta, Mars and Earth when the accreted pebbles have a low degree of oxidation and a high degree of sulfurization. These values are broadly consistent with constraints from spectra of interstellar dust (Westphal et al., 2019). The oxidation degree of planetesimals and planets may therefore be largely a consequence of oxidation of metallic iron on the parent body. This view in turn implies that the core mass fraction is an increasing function of the planetary mass, a scaling that will extend also to more massive super-Earths that form in the inner regions of the protoplanetary disc.
5 Discussion and implications
We demonstrate in this paper how a high primordial ice content of planetesimals is remembered even after the bulk of the water has been expelled, through the high fraction of oxidized iron (FeO) in the mantle. Lichtenberg et al. (2019) proposed that the devolatilization of planetesimals by decay of 26Al would lead to a dichotomy of terrestrial planets: planets with a high water fraction (ocean planets) form in protoplanetary discs with a low initial abundance of 26Al, while relatively dry planets akin to Earth emerge when the 26Al value is at the solar level or higher. However, accretion of devolatilized planetesimals would still leave an imprint through their high FeO fractions that store a significant amount of the oxygen originally present in the ices. Vesta has an FeO fraction in the mantle of 25%–30%, much higher than the 8% FeO mantle fraction of Earth. Hence it seems unlikely that desiccated planetesimals akin to Vesta were a major mass source for the accretion of Earth.
Instead, we propose that Vesta belongs to a population of planetesimals that formed in the earliest stages of the evolution of the solar protoplanetary disc. Most of these planetesimals were prevented from growing by pebble accretion after their eccentricities and inclinations were pumped up by close encounters with one or more of the protoplanets that would later successfully grow to form Mars, Theia, Earth or even Venus. In some parallel to the model of Lichtenberg et al. (2019), we do find that the planetesimal accretion contribution to these planets could have been dominated by differentiated objects akin to Vesta. Such planetesimals delivered a significant fraction of the oxidized FeO to the planets. However, we argue that the bulk delivery of water to Earth happened through the early accretion of icy pebbles, while the metallic iron was delivered later with pebbles whose volatile contents sublimated off while the pebble fell through the envelope of the accreting planet.
An important implication of the pebble accretion model for terrestrial planet formation is the emergence of a natural connection between the planetary mass and the core mass fraction (increasing with mass) as well as the FeO fraction in the mantle (decreasing with mass). Indeed such a trend is clearly seen for Vesta (low core fraction, high FeO fraction), Mars (medium core fraction, medium FeO fraction) and Earth (high core fraction, low FeO fraction). The initial accretion of highly oxidized material (or rather, material containing a high ice fraction) followed by later accretion of highly reduced material contrasts with the prevailing view that the Earth accreted increasingly oxidized material (Waenke & Dreibus, 1988; Wade & Wood, 2005; Rubie et al., 2015). However, Badro et al. (2015) demonstrated that oxidation models that match the siderophile element abundance of the terrestrial mantle are not unique and that solutions can be obtained both for accretion paths that start oxidized and for those that start reduced. The initially oxidized accretion paths nevertheless give best fits to the inferred abundance of Si and O in the core in the models of Badro et al. (2015). Our pebble accretion model thus agrees well with these initially oxidized differentiation models.
Our match of the pebble accretion model to the core mass fractions of Vesta, Mars and Earth implies that the terrestrial planets in the Solar System can be used to correlate fundamental properties of planets with the planetary mass. Our model thus predicts that super-Earths formed in the terrestrial planet region will have very high core mass fractions and low FeO contents in the mantle (super-Earths forming in the giant planet region could obviously accrete significant amounts of ice and gases). This may have implications for the habitability of terrestrial planets and super-Earths, since the core mass affects the magnetic field and hence the protection of the atmosphere against the solar wind (Elkins-Tanton & Seager, 2008). The FeO mass fraction, on the other hand, will determine the flux of Fe2+ from the mantle into the oceans, which affects the oxygen production level needed by the biosphere before oxygen can build up in the atmosphere rather than being spent on oxidizing the Fe2+ that is continuously dissolved in the oceans. The timing of the great oxidation of Earth (Lyons et al., 2014) may thus have depended on the FeO mass fraction in the mantle of our planet, which in our view was generously reduced by the accretion of very dry and metal-rich pebbles.
Acknowledgements.
We thank an anonymous referee for carefully reading the three papers in this series and for giving us many comments and questions that helped improve the original manuscripts. We are also grateful to the second referee for reading the revised manuscript carefully. A.J. acknowledges funding from the European Research Foundation (ERC Consolidator Grant 724687-PLANETESYS), the Knut and Alice Wallenberg Foundation (Wallenberg Scholar Grant 2019.0442), the Swedish Research Council (Project Grant 2018-04867), the Danish National Research Foundation (DNRF Chair Grant DNRF159) and the Göran Gustafsson Foundation. M.B. acknowledges funding from the Carlsberg Foundation (CF18_1105) and the European Research Council (ERC Advanced Grant 833275-DEEPTIME). M.S. acknowledges funding from Villum Fonden (grant number #00025333) and the Carlsberg Foundation (grant number CF20-0209). The computations were enabled by resources provided by the Swedish National Infrastructure for Computing (SNIC), partially funded by the Swedish Research Council through grant agreement no. 2020/5-387.References
- Abe (1997) Abe, Y. 1997, Physics of the Earth and Planetary Interiors, 100, 27
- Amsellem et al. (2017) Amsellem, E., Moynier, F., Pringle, E. A., et al. 2017, Earth and Planetary Science Letters, 469, 75
- Anglada-Escudé et al. (2016) Anglada-Escudé, G., Amado, P. J., Barnes, J., et al. 2016, Nature, 536, 437
- Armstrong et al. (2019) Armstrong, K., Frost, D. J., McCammon, C. A., et al. 2019, Science, 365, 903
- Asplund et al. (2021) Asplund, M., Amarsi, A. M., & Grevesse, N. 2021, A&A, 653, A141
- Badro et al. (2015) Badro, J., Brodholt, J. P., Piet, H., et al. 2015, Proceedings of the National Academy of Science, 112, 12310
- Boujibar et al. (2014) Boujibar, A., Andrault, D., Bouhifd, M. A., et al. 2014, Earth and Planetary Science Letters, 391, 42
- Braukmüller et al. (2019) Braukmüller, N., Wombacher, F., Funk, C., et al. 2019, Nature Geoscience, 12, 564
- Brouwers et al. (2018) Brouwers, M. G., Vazan, A., & Ormel, C. W. 2018, A&A, 611, A65
- Budde et al. (2016) Budde, G., Burkhardt, C., Brennecka, G. A., et al. 2016, Earth and Planetary Science Letters, 454, 293
- Burkhardt et al. (2021) Burkhardt, C., Spitzer, F., Morbidelli, A., et al. 2021, Science Advances, 7, eabj7601
- Canup & Asphaug (2001) Canup, R. M. & Asphaug, E. 2001, Nature, 412, 708
- Castillo-Rogez et al. (2009) Castillo-Rogez, J., Johnson, T. V., Lee, M. H., et al. 2009, Icarus, 204, 658
- Chabot (2004) Chabot, N. L. 2004, Geochim. Cosmochim. Acta., 68, 3607
- Chambers (2001) Chambers, J. E. 2001, Icarus, 152, 205
- Chen et al. (2007) Chen, B., Gao, L., Funakoshi, K.-. ichi ., et al. 2007, Proceedings of the National Academy of Science, 104, 9162
- Connelly et al. (2012) Connelly, J. N., Bizzarro, M., Krot, A. N., et al. 2012, Science, 338, 651
- Connolly et al. (1994) Connolly, H. C., Hewins, R. H., Ash, R. D., et al. 1994, Nature, 371, 136
- Dauphas et al. (2002) Dauphas, N., Marty, B., & Reisberg, L. 2002, ApJ, 569, L139
- Dauphas (2017) Dauphas, N. 2017, Nature, 541, 521
- Davies et al. (2020) Davies, C. J., Pozzo, M., Gubbins, D., et al. 2020, Earth and Planetary Science Letters, 538, 116208
- de Wijs et al. (1998) de Wijs, G. A., Kresse, G., Vočadlo, L., et al. 1998, Nature, 392, 805
- Desch et al. (2009) Desch, S. J., Cook, J. C., Doggett, T. C., et al. 2009, Icarus, 202, 694
- Desch & Turner (2015) Desch, S. J. & Turner, N. J. 2015, ApJ, 811, 156
- Desch et al. (2018) Desch, S. J., Kalyaan, A., & O’D. Alexander, C. M. 2018, ApJS, 238, 11
- Dr\każkowska et al. (2019) Dr\każkowska, J., Li, S., Birnstiel, T., et al. 2019, ApJ, 885, 91
- Linstrom & Mallard (2021) Linstrom, P. J. & Mallard, W. G., Eds., NIST Chemistry WebBook, NIST Standard Reference Database Number 69, National Institute of Standards and Technology, Gaithersburg MD, 20899 (retrieved December 11, 2021).
- Ebel (2011) Ebel, D. S. 2011, Reviews in Mineralogy and Geochemistry, 73, 315
- Elkins-Tanton & Seager (2008) Elkins-Tanton, L. T. & Seager, S. 2008, ApJ, 688, 628
- Fattah-alhosseini et al. (2016) Fattah-alhosseinia. A., Yazdani Khana, H,, & Heidarpour, A. 2016, Journal of Alloys and Compounds, 676, 484
- Frost et al. (2010) Frost, D. J., Asahara, Y., Rubie, D. C., et al. 2010, Journal of Geophysical Research (Solid Earth), 115, B02202
- Ghosh & McSween (1998) Ghosh, A. & McSween, H. Y. 1998, Icarus, 134, 187
- Gillon et al. (2017) Gillon, M., Triaud, A. H. M. J., Demory, B.-O., et al. 2017, Nature, 542, 456
- Golabek et al. (2014) Golabek, G. J., Bourdon, B., & Gerya, T. V. 2014, Meteoritics and Planetary Science, 49, 1083
- Grimm & McSween (1989) Grimm, R. E. & McSween, H. Y. 1989, Icarus, 82, 244
- Grimm & McSween (1993) Grimm, R. E. & McSween, H. Y. 1993, Science, 259, 653
- Haugbølle et al. (2019) Haugbølle, T., Weber, P., Wielandt, D. P., et al. 2019, AJ, 158, 55
- Hevey & Sanders (2006) Hevey, P. J. & Sanders, I. S. 2006, Meteoritics and Planetary Science, 41, 95
- Hezel & Palme (2010) Hezel, D. C. & Palme, H. 2010, Earth and Planetary Science Letters, 294, 85
- Hin et al. (2017) Hin, R. C., Coath, C. D., Carter, P. J., et al. 2017, Nature, 549, 511
- Izidoro et al. (2021a) Izidoro, A., Bitsch, B., & Dasgupta, R. 2021a, ApJ, 915, 62
- Izidoro et al. (2021b) Izidoro, A., Dasgupta, R., Raymond, S. N., et al. 2021b, Nature Astronomy
- Jacquet et al. (2015) Jacquet, E., Alard, O., & Gounelle, M. 2015, Geochim. Cosmochim. Acta., 155, 47
- Jackson et al. (2021) Jackson, C. R. M., Cottrell, E., Du, Z., et al. 2021, Geochemical Perspectives Letters, 18, 37-42
- Javoy (1995) Javoy, M. 1995, Geochim. Res. Lett., 22, 2219
- Javoy et al. (2010) Javoy, M., Kaminski, E., Guyot, F., et al. 2010, Earth and Planetary Science Letters, 293, 259
- Johansen et al. (2015) Johansen, A., Mac Low, M.-M., Lacerda, P., et al. 2015, Science Advances, 1, 1500109
- Johansen et al. (2021) Johansen, A., Ronnet, T., Bizzarro, M., Schiller, M., Lambrechts, M., Nordlund, Å, & Lammer, H.. 2021, Science Advancs, 7, eabc0444
- Johnson et al. (2020) Johnson, B. C., Sori, M. M., & Evans, A. J. 2020, Nature Astronomy, 4, 41
- Keil (2010) Keil, K. 2010, Chemie der Erde / Geochemistry, 70, 295
- Kokubo & Ida (1998) Kokubo, E. & Ida, S. 1998, Icarus, 131, 171
- Lambrechts & Johansen (2012) Lambrechts, M., & Johansen, A. 2012, A&A, 544, A32
- Lambrechts et al. (2019) Lambrechts, M., Morbidelli, A., Jacobson, S. A., et al. 2019, A&A, 627, A83
- Lange & Ahrens (1982) Lange, M. A. & Ahrens, T. J. 1982, Icarus, 51, 96
- Larsen et al. (2011) Larsen, K. K., Trinquier, A., Paton, C., et al. 2011, ApJ, 735, L37
- Lichtenberg et al. (2019) Lichtenberg, T., Golabek, G. J., Burn, R., et al. 2019, Nature Astronomy, 3, 307
- Liu et al. (2022) Liu, B., Johansen, A., Lambrechts, M., et al. 2022, Science Advances, 8, eabm3045. doi:10.1126/sciadv.abm3045
- Lodders (2003) Lodders, K. 2003, ApJ, 591, 1220
- Lyons et al. (2014) Lyons, T. W., Reinhard, C. T., & Planavsky, N. J. 2014, Nature, 506, 307
- Mah et al. (2021) Mah, J., Brasser, R., Bouvier, A., et al. 2021, MNRAS
- Mahan et al. (2018) Mahan, B., Moynier, F., Siebert, J., et al. 2018, Proceedings of the National Academy of Science, 115, 8547
- Marrocchi & Libourel (2013) Marrocchi, Y. & Libourel, G. 2013, Geochim. Cosmochim. Acta., 119, 117
- Matsui & Abe (1986a) Matsui, T. & Abe, Y. 1986a, Nature, 319, 303
- Matsui & Abe (1986b) Matsui, T. & Abe, Y. 1986b, Nature, 322, 526
- McCord & Sotin (2005) McCord, T. B. & Sotin, C. 2005, Journal of Geophysical Research (Planets), 110, E05009
- Monteux et al. (2016) Monteux, J., Andrault, D., & Samuel, H. 2016, Earth and Planetary Science Letters, 448, 140
- Monteux et al. (2018) Monteux, J., Golabek, G. J., Rubie, D. C., et al. 2018, Space Sci. Rev., 214, 39
- Morard et al. (2018) Morard, M., Bouchet, J., Rivoldini, A., et al. 2018, American Mineralogist, 103, 1770
- Morbidelli et al. (2016) Morbidelli, A., Bitsch, B., Crida, A., et al. 2016, Icarus, 267, 368
- Morbidelli et al. (2020) Morbidelli, A., Libourel, G., Palme, H., et al. 2020, Earth and Planetary Science Letters, 538, 116220
- Morbidelli et al. (2021) Morbidelli, A., Baillié, K., Batygin, K., et al. 2021, Nature Astronomy
- Neumann et al. (2012) Neumann, W., Breuer, D., & Spohn, T. 2012, A&A, 543, A141
- Ormel & Klahr (2010) Ormel, C. W. & Klahr, H. H. 2010, A&A, 520, A43
- Ortenzi et al. (2020) Ortenzi, G., Noack, L., Sohl, F., et al. 2020, Scientific Reports, 10, 10907
- Palme & O’Neill (2003) Palme, H. & O’Neill, H. S. C. 2003, Treatise on Geochemistry, 2, 568
- Raymond et al. (2004) Raymond, S. N., Quinn, T., & Lunine, J. I. 2004, Icarus, 168, 1
- Raymond et al. (2021) Raymond, S. N., Izidoro, A., Bolmont, E., et al. 2021, Nature Astronomy
- Reid et al. (1987) Reid, R. C., Prausnitz, J. M, & Poling, B. W. 1987, The properties of gases and liquids, McGraw-Hill
- Righter & Drake (1997) Righter, K. & Drake, M. J. 1997, Meteoritics and Planetary Science, 32, 929
- Righter & O’Brien (2011) Righter, K. & O’Brien, D. P. 2011, Proceedings of the National Academy of Science, 108, 19165
- Righter et al. (2016) Righter, K., Sutton, S. R., Danielson, L., et al. 2016, American Mineralogist, 101, 1928
- Rivoldini et al. (2011) Rivoldini, A., Van Hoolst, T., Verhoeven, O., et al. 2011, Icarus, 213, 451
- Robinson & Taylor (2001) Robinson, M. S. & Taylor, G. J. 2001, Meteoritics and Planetary Science, 36, 841
- Rubie et al. (2015) Rubie, D. C., Jacobson, S. A., Morbidelli, A., et al. 2015, Icarus, 248, 89
- Russell et al. (2012) Russell, C. T., Raymond, C. A., Coradini, A., et al. 2012, Science, 336, 684
- Ruzicka et al. (1997) Ruzicka, A., Snyder, G. A., & Taylor, L. A. 1997, Meteoritics and Planetary Science, 32, 825
- Sahijpal et al. (2007) Sahijpal, S., Soni, P., & Gupta, G. 2007, Meteoritics & Planetary Science 42, 1529
- Sahijpal & Bhatia (2015) Sahijpal, S. & Bhatia, G. K. 2015, Journal of Earth System Science, 124, 241
- Sanders et al. (2017) Sanders, I. S., Scott, E. R. D., & Delaney, J. S. 2017, Meteoritics and Planetary Science, 52, 690
- Sanders & Scott (2021) Sanders, I. S. & Scott, E. R. D. 2021, Meteoritics and Planetary Science, 1-22
- Sarafian et al. (2014) Sarafian, A. R., Nielsen, S. G., Marschall, H. R., et al. 2014, Science, 346, 623
- Schiller et al. (2015) Schiller, M., Connelly, J. N., Glad, A. C., et al. 2015, Earth and Planetary Science Letters, 420, 45
- Schiller et al. (2018) Schiller, M., Bizzarro, M., & Fernandes, V. A. 2018, Nature, 555, 507
- Schiller et al. (2020) Schiller, M., Bizzarro, M., & Siebert, J. 2020, Science Advances, 6, eaay7604
- Scott et al. (2002) Scott, H. P., Williams, Q., & Ryerson, F. J. 2002, Earth and Planetary Science Letters, 203, 399
- Solomatov (2015) Solomatov, V. S. 2015, Treatise on Geophysics (Second Edition), 9, 81-104
- Steenstra et al. (2019) Steenstra, E. S., Dankers, D., Berndt, J., et al. 2019, Icarus, 317, 669
- Stähler et al. (2021) Stähler, S. C., et al. 2021, Science, 373, 443
- Surkov et al. (1984) Surkov, Y. A., Barsukov, V. L., Moskalyeva, L. P., et al. 1984, Lunar and Planetary Science Conference Proceedings, 89, B393
- Surkov et al. (1986) Surkov, Y. A., Moskalyova, L. P., Moskaleva, L. P., et al. 1986, J. Geophys. Res., 91, E215
- Sutton et al. (2017) Sutton, S., Alexander, C. M. O., Bryant, A., et al. 2017, Geochim. Cosmochim. Acta., 211, 115
- Toplis et al. (2013) Toplis, M. J., Mizzon, H., Monnereau, M., et al. 2013, Meteoritics and Planetary Science, 48, 2300
- Trinquier et al. (2009) Trinquier, A., Elliott, T., Ulfbeck, D., et al. 2009, Science, 324, 374
- Trønnes et al. (2019) Trønnes, R. G., Baron, M. A., Eigenmann, K. R., et al. 2019, Tectonophysics, 760, 165
- Wade & Wood (2005) Wade, J. & Wood, B. J. 2005, Earth and Planetary Science Letters, 236, 78
- Waenke & Dreibus (1988) Waenke, H. & Dreibus, G. 1988, Philosophical Transactions of the Royal Society of London Series A, 325, 545
- Warren (2011) Warren, P. H. 2011, Earth and Planetary Science Letters, 311, 93
- Westphal et al. (2019) Westphal, A. J., Butterworth, A. L., Tomsick, J. A., et al. 2019, ApJ, 872, 66
- Wilson et al. (2006) Wilson, J., Savage, D., Cuadros, J., et al. 2006, Geochim. Cosmochim. Acta., 70, 306
- Zanda et al. (2006) Zanda, B., Hewins, R. H., Bourot-Denise, M., et al. 2006, Earth and Planetary Science Letters, 248, 650