11email: Valentina.R11@yandex.ru
Detailed spectroscopy of post-AGB supergiant GSC 0405002366 in IRAS Z02229+6208 IR source system
In the optical spectra of the cold post-AGB supergiant GSC 0405002366, obtained with the 6-meter BTA telescope with a spectral resolution of R60 000 on arbitrary dates over 20192021, a radial velocity variability is found. Heliocentric Vr based on the positional measurements of numerous absorptions varies from date to date with a standard deviation of Vr1.4 km/s about the average value of Vr=24.75 km/s, which may stem out of the low-amplitude pulsations in the atmosphere. The spectra of the star are purely absorption type, there are no obvious emissions. Intensity variability of most of absorptions and Swan bands of the C2 molecule was discovered. A slight asymmetry of the H profile is observed at some observation dates. The position of H absorption core varies within 27.330.6 km/s. Splitting into two components (or asymmetry) of strong low-excitation absorptions (YII, ZrII, BaII, LaII, CeII, NdII) was found. The position of the long-wavelength component coincides with the position of other photospheric absorptions, which confirms its formation in the atmosphere of the star. The position of the shortwave component is close to the position of the rotational features of Swan bands, which indicates its formation in the circumstellar envelope expanding at a velocity of about Vexp=16 km/s.
1 Introduction
In recent decades, a detailed spectroscopy of by far evolved stars that have passed evolutionary stages with nucleosynthesis in the stellar cores and episodes with mass loss due to the stellar wind and ejection of the envelope is carried out at the 6-meter BTA telescope of the Special Astrophysical Observatory RAS. Numerous results obtained within the framework of the program are briefly presented in the survey Klochkova et al. (2022). One of the main areas of our research is spectroscopy of massive hypergiants with initial masses of 2040 near the luminosity limit on the Hertzsprung–Russell diagram. Results of spectral monitoring at the BTA of these extremely rare objects are summarized in a recent survey Klochkova (2019a). Less massive evolved far stars with initial masses of around 28 are observed on the asymptotic giant branch (hereinafter, AGB) in the form of red supergiants with an effective temperature of T3000–4500 K. By far evolved AGB stars at the stages of hydrogen and helium layer burning experience a significant mass loss due to the forceful (the rate in the interval of /year) stellar wind (Höfner and Olofsson, 2018). Owing to the wind, an expanding envelope of gas and dust is formed around the star, the presence of which manifests itself in the excess IR flux, specific features in the radio, IR and optical spectra. Circumstellar gas and dust envelopes formed at the RGB, AGB, and post-AGB stages of evolution appear in large excesses of IR radiation, which serves as the main selection criterion for these objects (Kwok, 1993).
Interest in AGB stars and their nearest descendants—post-AGB stars in particular stems from the fact that it is in these stars, being in the short-term evolutionary stage, that physical conditions arise for the synthesis of nuclei of heavy metals and their subsequent dredge-up into the stellar atmosphere. Owing to these processes AGB stars are the main suppliers (over %) of all elements heavier than iron, synthesized as a result of the -process, the essence of which consists in a slow (compared to -decay) neutronization of nuclei. The main features of stellar evolution near the AGB and the results of up-to-date calculations of synthesis and dredge-up of elements are given in the papers by Bloecker (1995); Herwig (2005); Di Criscienzo et al. (2016); Liu et al. (2018).
A part of AGB and post-AGB supergiants is accessible to optical spectroscopy with high spectral resolution. We have published the surveys of these studies performed on the 6-meter telescope in the papers Klochkova (1997, 2014, 2019b). This program of observations also includes a cool supergiant GSC 0405002366, associated with an IR source IRAS Z02229+6208 (hereinafter IRAS Z02229). This star of spectral type G8–K0 Ia (Hrivnak and Kwok, 1999) is faint in the visible range due to a significant interstellar and circumstellar extinction, hence it has a short and uncomprehensive history of study.
The data of the InfraRed Astronomical Satellite (IRAS) indicated the presence of a powerful flux at the 25 m band from the IRAS Z02229 source. This has stimulated the beginning of an active study of the object. 1999 turned out to be especially fruitful in the study of the IRAS Z02229 system. Hrivnak and Kwok (1999), using low-resolution optical spectra revealed the presence of absorption bands of the C2 and C3 molecules and assigned the object to a scanty group of protoplanetary nebulae (PPN) with an emission at the wavelength of =21 m. The same (Hrivnak and Kwok, 1999) authors summarized the information about the IRAS Z02229 system, published by the time of their study: a two-humped shape of SED, a color excess , a considerable expansion of the circumstellar envelope, including its expanse in H; an intense envelope emission in the band of the CO molecule, which made it possible to determine the systemic velocity of this object Vsys=+24.3 km/s and the envelope expansion rate Vexp=+15.2 km/s. The main data required for our work, published on the star GSC 0405002366, associated with the IR source IRAS Z02229, are listed in Table 1. With such a high color excess, the object, the predecessor of GSC 0405002366 at the previous AGB stage, refers to the so-called ERO C-rich stars, according to the classification of stars with mighty envelopes (Extremely Red Objects) introduced by Groenewegen (2022). It is important to note here a significant difference between the effective temperature and color excess values for this star, determined by various methods: the method of atmospheric models in Reddy et al. (1999) and Spectral Energy Distribution (SED) modeling using the Gaia EDR3 parallaxes (Kamath et al., 2022).
| Parameter | Value |
|---|---|
| 02h 26m 41.8s | |
| +62°21` 22″ | |
| l/b | 133.7/1.5° |
| 0.3806 mas Brown et al. (2021) | |
| Sp | G8-K0 Ia: Hrivnak and Kwok (1999) |
| L/L⊙ | 12959 Kamath et al. (2022) |
| Teff | 5400 K Reddy et al. (1999) |
| 5952 K Kamath et al. (2022) | |
| E(B-V) | 1.0 Hrivnak and Kwok (1999) |
| 1.9 Kamath et al. (2022) | |
| Reddy et al. (1999) |
The next important step of GSC 0405002366 research was the widely cited work of Reddy et al. Reddy et al. (1999). These authors, based on a high-resolution optical spectrum, obtained with the 2.7-m telescope echelle spectrograph of the McDonald observatory, determined the parameters of the stellar atmosphere model and its detailed chemical composition. As a result, Reddy et al. (1999) came to a conclusion that metallicity of the stellar atmosphere is reduced: at large excesses of carbon and heavy metals of the -process . Such peculiarities of the chemical composition indicate that the star has passed the evolutionary AGB stage and the 3-d dredge-up episode.
So far, there has been no further of the optical spectroscopy of GSC 0405002366, which prompted us to start spectral monitoring of the star with high spectral resolution. In this paper we present the results of the analysis of several optical spectra of GSC 0405002366, obtained with the 6-m BTA telescope on arbitrary dates over 20192021. The primary purpose of our work is to search for the possible variability of the spectral feature profiles and studying the temporal behavior of the Vr pattern. Section 2 of the paper briefly describes techniques of observation and data analysis. Section 3 shows our results in comparison with those published earlier, in Section 4 we present a discussion of the results obtained, while the main conclusions are listed in Section 5.
| Date/JD | Vr, km/s | |||
|---|---|---|---|---|
| Absorptions | H(core) | Swan | DIBs | |
| 1 | 2 | 3 | 4 | 5 |
| 19-23.12.19961 | 18 | 6 | ||
| 06.12.2019 | 20.37 (283) | 32.2 | 8.8 (24) | (7) |
| 2458824.3 | ||||
| 26.10.2020 | 25.62 (327) | 27.9 | 8.6 (87) | (9) |
| 2459149.3 | ||||
| 29.11.2020 | 25.81 (330) | 29.9 | 9.0 (11) | (3) |
| 2459182.5 | ||||
| 23.10.2021 | 26.10 (466) | 26.1 | 9.7 (29) | |
| 2459511.2 | ||||
| 1 – mean Vr for 1996 based on the data from Reddy et al. (1999) | ||||
2 Observational material and its reduction
The spectra of GSC 0405002366 were obtained with the NES echelle spectrograph (Panchuk et al., 2017), stationary located at the Nasmyth focus of the 6-meter BTA telescope. The moments of observation of the star are listed in Table 2. At present, the NES spectrograph is fitted up with a large-format CCD with 46082048 elements sized 0.01350.0135 mm, readout noise 1.8 e-. The registered spectral range in our spectra is nm. To reduce flux losses not falling of spectral resolution, the NES spectrograph is equipped with an image slicer with a configuration for 3 slices. Spectral resolution is 60 000, the ratio of signal to the level of noise along the echelle order in the spectra varies from 40 to 70. Moreover, the signal is significantly reduced in the short-wavelength part of the echelle frame due to a significant absorption of stellar radiation in the circumstellar medium.
3 Spectral features and radial velocity behaviour
To identify the features in the spectra of GSC 0405002366 we used the spectral atlas (Klochkova et al., 2007a, b) based on detailed spectroscopy of a related post-AGB star HD 56126 (IRAS 07134+1005), as well as the spectral atlas (Barnbaum, 1994) for carbon stars.
3.1 Radial velocity
All results of heliocentric velocity Vr measurements are given in columns – of Table 2. The average Vr values for symmetrical absorptions, rotational components of Swan bands and interstellar features of the DIBs are given for the samples of details and the errors of these means.
From the comparison of high-accuracy data in the second column of the Table, we obtain the radial velocity variability: the average Vr value over the measurements of positions of many metal absorptions varies from date to date around the mean value Vr=24.75 km/s with the standard deviation from the mean Vr=1.4 km/s, which may be a consequence of low-amplitude pulsations in the atmosphere.
3.2 Swan bands
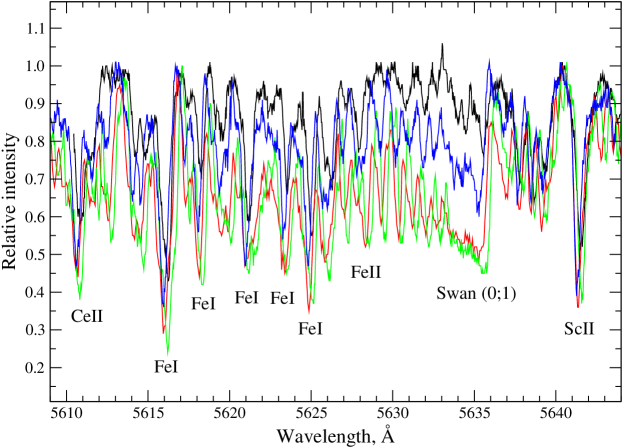
As shown in Hrivnak and Kwok (1999); Reddy et al. (1999), one of the most noticeable features of the optical spectrum of this star are the bands of carbon-containing CN, C2 and C3 molecules. All our spectra also contain the Swan bands of the C2 molecule. Moreover, in the spectra we recorded over 20192021, all Swan bands are present as absorptions. For illustration, Fig. 1 shows a fragment of the spectrum, including the Swan band molecules C2 () with the head on =5635 Å for four moments of observations. The variation in the intensity of the band cannot be explained by the difference in the observation conditions, since the spectra of 2019–2020 are obtained on the observation nights with excellent transparency and seeing . Only at one night of 23.10.2021 the seeing was slightly worse: .
The variability of the band’s intensity in this figure can be explained by non-sphericity of the envelope, which causes different extents of its contribution to the observed spectrum. This assumption is consistent with the “elongated” morphology type for the image of IRAS Z02229 obtained with the HST (Sahai et al., 2007). Nonsphericity of the dust envelope in the IRAS Z02229 system is also confirmed by a high level of polarization (Ueta et al., 2005, 2007; Akras et al., 2017). The influence of a powerful envelope on the observed spectrum of the star as a whole is manifested in such a way.
3.3 H profile
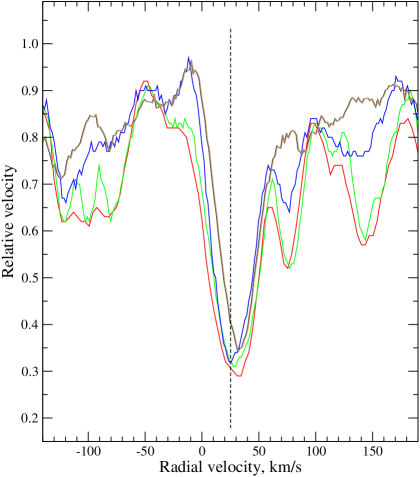
The spectra of GSC 0405002366 do not contain explicit emission features or wind components typical of early post-AGB stars. As seen in Fig. 2, the H profile in the GSC 0405002366 spectra is almost symmetrical, only at some dates there is a slight asymmetry of the profile in the form of an elevation of its short-wave wing. Moreover, this is observed only for those two observation time instants for which the Swan band is significantly weakened in Fig. 1. As follows from the data in the third column of the Table 2, the position of the H absorption core varies within 27.330.6 km/s. For most of the dates, the core is redshifted by about 2 km/s. This difference, according to the data of Reddy et al. (1999), is many times higher in the spectrum.

In the spectra of the cool supergiant with a slight metallicity deficit ([Fe/H]= (Reddy et al., 1999)) the absorptions of rotational transitions in the Swan system bands are mostly blended. However, the high spectral resolution of our data allows to single out selected features of the rotational transitions of the Swan bands, focusing on their profiles, which are more narrow compared to the photospheric absorptions. The average values of the measured velocities Vr(Swan), their errors and the number of used features are given in the fourth column of the Table 2.
3.4 Split absorptions
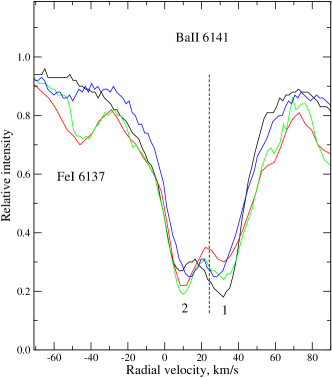
Reddy et al. (1999) noted that intensity of the BaII ion lines in the GSC 0405002366 spectrum is too high, which makes it difficult to model them and calculate the barium abundance in the atmosphere of the star. Figure 3 demonstrates the BaII 6141 line profile in our spectrum for 06.12.2019. Here you can clearly see the complex structure of the profile of this line, split into two components. The “1” component is marked in this figure, the position of which is consistent with the position of other photospheric absorptions, which indicates its formation in the atmosphere of the star. The shortwave component “2” is an envelope component, since its position corresponds to the velocity of Vr9.0 km/s close to the Vr calculated from the positions of rotational features of Swan bands. The same figure additionally shows the profiles of strong absorptions LaII 6390 and YII 5200 split into similar components. As you can see in Fig. 3, the width of the shortwave component of each line is significantly lower than the one of the long-wavelength one, which confirms formation of the short-wavelength component in the envelope.
In the spectra of GSC 0405002366, the strongest absorptions of metals or ions (KI, NaI, YII, ZrII, BaII, LaII, CeII, NdII) with a lower energy level low excitation potential ( eV) are split into two components or have asymmetrical profiles. In the presence of an explicit splitting, the position of their long-wavelength component coincides with the position of unsplit absorptions of other metals, which confirms its formation in the atmosphere of the star. Position of the shortwave component is close to the position of Swan bands features, which reflects its formation in the circumstellar environment. This splitting effect obviously increases the equivalent width of the corresponding absorptions and given a reduced spectral resolution it has to be taken into account in determining the abundance of heavy metals.
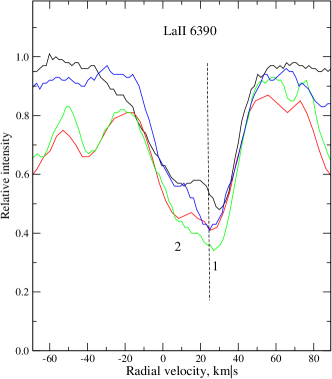
Figure 4 compares the profiles of the split BaII 6141 and LaII 6390 profiles in the spectra over four dates of our observations. In general, the character of splitting is the same for all observation dates.
3.5 Interstellar features
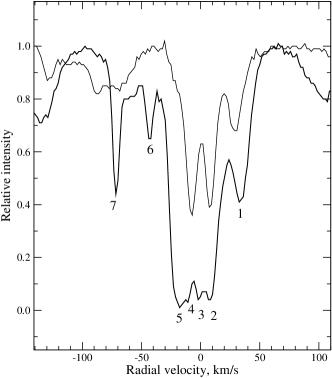
In the spectrum of a distant star near the Galactic plane we naturally expect to find the presence of a set of interstellar features, which is rather well illustrated by the profiles of the NaI 5895 (thick line) and KI 7699 lines in Fig. 5. Here, the component “1” (Vr km/s) is formed in the stellar atmosphere, the component “2” (Vr km/s)—in the circumstellar envelope, where the Swan bands are also formed. Only the “6” and “7” components are reliably identified in the NaI 5895 line profile. The component Vr= km/s is present in the KI 7699 line profile, its interstellar origin is confirmed by the agreement of this velocity with the velocities in the last column of Table 2 by the identified DIBs. The velocity range from Vr= km/s to Vr= km/s, which contains the “3–5” components of the NaI profile, is a set of interstellar absorptions, not resolvable at the spectral resolution of the NES spectrograph. It should also be taken into account that during long exposures of a faint star, a NaI emission of telluric origin may be registered, the position of which in the heliocentric system of velocities varies from date to date of observations.
Let us mention that the close interstellar components (Vr= km/s) of the NaI 5889 and 5895 lines profile have been identified earlier in the spectra of the central star of the IRAS 02441+6922 (Klochkova et al., 2017), whose galactic coordinates differ little from the coordinates of IRAS Z02229. In the spectrum of this object, the DIB sample positions were reliably measured: their position corresponds to the velocity of Vr= km/s. Interstellar components of the NaI doublet with close velocities were registered by Miroshnichenko et al. (2021) and in the spectrum of a distant hot star VES 723, whose galactic coordinates are also close to the coordinates of GSC 0405002366: .
It is difficult to identify the diffuse bands of DIBs in the spectra of the cool star with a rich absorption spectrum combined with molecular bands. In addition to the strongest DIBs at Å and Å, we managed to identify only a few DIBs whose average position, Vr km/s, agrees with the position of the interstellar component KI.
To conclude this Section, let us note that Reyniers et al. (2002) showed that the absorption at Å should be identified with CeII Å. For example, the authors of Reddy et al. (1999); Klochkova et al. (2008) identified this absorption in the spectra of post-AGB stars with the LiI Å line and concluded that there is an excess of lithium in the atmospheres of these stars. Reddy et al. (1999) noted unreliability of finding the lithium abundance in the atmosphere of GSC 0405002366 based on absorption intensity near Å due to the possible blending by the CN and Ce lines. We have reliably identified this absorption with the CeII Å line, since the radial velocity measurements based on the position of this feature are in excellent agreement with the mean Vr from the metal lines.
4 Discussion of the results
All the GSC 0405002366 spectra we have are purely absorption spectra. At the same time, we have revealed the variability of the spectrum and the peculiarities of the behavior of a number of absorptions. Photometric observations of this star also indicate a significant variability. According to the observations of GSC 0405002366 in 20142018 from the ASAS-SN survey of (Kochanek et al., 2017), the apparent brightness of the star varies in the range of –. Based on the analysis of these long observations, the period P=443 and variability amplitude estimates are made in the ASAS-SN database. Somewhat earlier, the photometric features of GSC 0405002366 among the sample of related post-AGB stars were studied by Hrivnak et al. (2010). These authors revealed a long-term brightness variability, the presence of several periods with a dominant one of around days, as well as a combination of deep minima (up to ) with flatter ones. The set of photometric data for IRAS Z02229 and related objects allowed these authors to make a choice in favor of pulsations, and not binarity, as the cause of variability.
There are no wind components in the GSC 0405002366 spectra and emissions typical for the spectra of post-AGB stars, occurring in the atmosphere of a star or in its circumstellar environment. For example, in the spectrum of HD 56126 (IRAS 07134+1005), the time-variable H profile usually contains an emission (Klochkova et al., 2007b; Lebre et al., 1996). In the optical spectra of V510 Pup (IRAS 080052356), a powerful emission component is present both in the profiles of hydrogen lines, including the Paschen series lines, and in the selected lines of metal ions (Klochkova and Chentsov, 2004).
The spectrum of the central star of the IR source RAFGL 5081 is quite peculiar. This star, like GSC 0405002366, has an effective temperature T K (Klochkova et al., 2017) close to the evolutionary transition from AGB to post-AGB, according to Soker (2008). In the spectrum of RAFGL 5081, the H line has a multicomponent and time-variable profile, containing a weak emission (Klochkova et al., 2017). However, as follows from Fig. 2, H profile in the spectra of GSC 0405002366 is almost symmetrical, its absorption core is located near the average velocity Vr=+24.8 km/s for all times of observation.
In the spectrum of GSC 0405002366 only forbidden emissions [O I] , Å of telluric origin are registered. A weak emission raises the shortwave H profile wing only for those two observation dates for which the C2 molecule Swan band is significantly weakened in Fig. 1. This coincidence suggests the presence of asymmetry (or inhomogeneities) in the envelope.
The difference of radial velocities given in columns (2) and (4) of Table 2, allows us to estimate the envelope expansion velocity, Vexp16 km/s, which agrees with the result based on the CO profile (Hrivnak and Kwok, 1999). If we consider the summary of Vexp values for post-AGB stars from Klochkova (2014), we can see that the envelope expansion velocity in the IRAS Z02229 system is typical for the objects of this type. Note here that most of the post-AGB stars with the envelopes enriched in carbon have a similar envelope morphology (bipolar or elongated halo) and an emission at m.
Comparison of results of positional measurements in the spectra we obtained on arbitrary dates of 20192021 revealed a variability of the heliocentric radial velocity: averaged over the measurements of the positions of the set of absorptions, the velocity varies in the range of Vr= km/s. The presence of Vr variability is also confirmed by the earlier velocity value Vr=18 km/s, given in the paper of Reddy et al. (1999) based on December 1996 observations. The most probable cause of the radial velocity variability with the amplitude of about Vr km/s can be the low-amplitude pulsations that are typical for post-AGB stars (Aikawa, 2010). The star GSC 0405002366 with its fundamental parameters falls into the region of Figure 1 in Aikawa (2010), populated with variable post-AGB stars. The presence of pulsations in the atmosphere of this star is also confirmed by the photometric variability with the amplitude of based on the observations in the ASAS-SN database.
As a result of studying over the past – decades of the candidates in post-AGB stars, a group of objects with atmospheres enriched in -process heavy metals has been identified. A complete list of stars of this type with a large set of data (T, luminosity, color excesses, SED, chemical composition of the atmosphere) is published in the survey by Kamath et al. (2022). Counterparts of GSC 0405002366 based on the totality of the observed properties (excess of carbon and heavy metals in the atmospheres, a large color excess owing to the powerful dust envelopes, spectral features of carbon-containing molecules, emission at m) are the central stars of the IR-sources IRAS 04296+3429, IRAS 195001709, IRAS 20000+3239, IRAS 22223+4327 and IRAS 23304+6147. Post-AGB stars—the members of this group—when the main parameters are close, have their own specific differences as well. For example, in the optical spectrum of the post-AGB star V448 Lac in the IR source system IRAS 22223+4327, all group indications are registered: radial velocity variability, manifestations of the circumstellar envelope in in the form of Swan system bands of the C2 molecule, the asymmetry of strong absorptions of SiII, YII, LaII, BaII ions (Klochkova et al., 2010). At the same time, at certain dates of observations the spectrum of V448 Lac revealed an emission in the Swan band (Klochkova et al., 2010). V448 Lac is also included in the reserved group of post-AGB stars with an emission at the wavelength of m (Volk et al., 1999). This emission does not yet have a specific identification, despite the many proposed versions of (Zhang et al., 2009).
The IR source IRAS 04296+3429 system is also intriguing, which, similar to IRAS Z02229 has a powerful infrared flux. The central star GSC 023810104 in this system has further advanced to the planetary nebula stage than GSC 0405002366, but in general, its fundamental parameters and energy distribution in the spectrum of this system (Klochkova et al., 1999) are close to those of the IR-source IRAS Z02229 system. The distant star GSC 023810104 is faint for the high-resolution spectroscopy (apparent brightness V), but its optical spectrum (G8 Ia) is close to that of GSC 0405002366, while it holds the record for emission intensity in the () and () Swan bands (Klochkova et al., 1999). A greater farness of this object from the AGB-phase probably leads to a significant expansion of the enevelope, which contributes to the formation of emission in the circumstellar details.
A nearby relative of GSC 0405002366 is a post-AGB supergiant V5112 Sgr (IRAS 195001709), whose envelope is also enriched in heavy metals, which manifests itself in the splitting of resonance absorption profiles (Klochkova, 2013). Along with this, the peculiarity of the optical spectrum of V5112 Sgr is more pronounced: the profiles of strong BaII absorptions are split into three components. Two shortwave components origin in two different layers of the structured envelope of the star, formed at two previous stages of the evolution of the star and expanding with the velocities of Vexp and 30 km/s.
The cool post-AGB supergiant GSC 0405002366 belongs to the group of single post-AGB stars that have passed the stage with the effective -process and the third mixing. This group currently includes about two dozen stars, all of them are listed in the surveys by Klochkova (1997, 2019b); Kamath et al. (2022). The splitting of resonant absorptions of metals due to their removal to the circumstellar environment was found in the spectra of only four of them.
5 Main conclusions
The main new results of this study are as follows:
-
1) detection of a temporal radial velocity variability based on the positional measurements of a great many of metal absorptions. The velocity Vr varies around the mean value of Vr=24.75 km/s with the standard deviation from the mean of Vr=1.4 km/s, which may be a consequence of low-amplitude pulsations in the atmosphere;
-
2) detection of a temporal variability of the profiles of spectral features, including the intensity of most of absorptions and Swan bands of the C2 molecule, as well as a weak H profile variability;
-
3) detection of splitting into two components (or asymmetries) of strong low excitation absorptions (YII, ZrII, BaII, LaII, NdII). The longwave component, whose position is consistent with the position of symmetrical absorptions of other metals is formed in the atmosphere of the star;
-
4) the position of the short-wave component of the split absorptions coincides with the position of the Swan bands features, which points to its formation in the circumstellar envelope expanding at a velocity of about Vexp=16 km/s. Therefore, the post-AGB supergiant GSC 0405002366 is the fourth object in the group of stars for which the takeaway of the -process heavy metals into the circumstellar envelope was discovered.
Acknowledges
Observational data were obtained at the unique scientific facility, the 6-m Big Telescope Alt-azimuth of the SAO RAS. The study made use of the SIMBAD, VALD, SAO/NASA ADS, ASAS-SN and Gaia DR3 astronomical databases.
Funding
The work on the spectroscopic data reduction and analysis of results has been carried out within the framework of a grant of the Ministry of Science and Higher Education of the Russian Federation number 075-15-2022-262 (13.MNPMU.21.0003).
Conflict of interest
The authors declare no conflict of interest.
References
- Aikawa (2010) T. Aikawa, A&A 514, A45 (2010).
- Akras et al. (2017) S. Akras, J. C. Ramírez Vélez, N. Nanouris, et al., MNRAS 466 (3), 2948 (2017).
- Barnbaum (1994) C. Barnbaum, ApJS 90, 317 (1994).
- Bloecker (1995) T. Bloecker, A&A 297, 727 (1995).
- Brown et al. (2021) A. G. A. Brown et al. (Gaia Collab.), A&A 649, id. A1 (2021).
- Di Criscienzo et al. (2016) M. Di Criscienzo, P. Ventura, D. A. García-Hernández, et al., MNRAS 462 (1), 395 (2016).
- Groenewegen (2022) M. A. T. Groenewegen, A&A 659, id. A145 (2022).
- Herwig (2005) F. Herwig, ARA&A 43 (1), 435 (2005).
- Höfner and Olofsson (2018) S. Höfner and H. Olofsson, Astron. Astroph. Rev. 26 (1), id. 1 (2018).
- Hrivnak and Kwok (1999) B. J. Hrivnak and S. Kwok, ApJ 513 (2), 869 (1999).
- Hrivnak et al. (2010) B. J. Hrivnak, W. Lu, R. E. Maupin, and B. D. Spitzbart, ApJ 709 (2), 1042 (2010).
- Kamath et al. (2022) D. Kamath, H. Van Winckel, P. Ventura, et al., ApJ 927 (1), id. L13 (2022).
- Klochkova (1997) V. G. Klochkova, Bull. Spec. Astrophys. Obs. 44, 5 (1997).
- Klochkova (2013) V. G. Klochkova, Astronomy Letters 39 (11), 765 (2013).
- Klochkova (2014) V. G. Klochkova, Astrophys. Bull., 69 (3), 279 (2014).
- Klochkova (2019a) V. G. Klochkova, Astrophys. Bull., 74 (4), 475 (2019a).
- Klochkova (2019b) V. G. Klochkova, Astrophys. Bull., 74 (4), 475 (2019b).
- Klochkova and Chentsov (2004) V. G. Klochkova and E. L. Chentsov, Astronomy Reports 48 (4), 301 (2004).
- Klochkova et al. (2017) V. G. Klochkova, E. L. Chentsov, V. E. Panchuk, N. S. Tavolzhanskaya, M. V. Yushkin, Astronomy Reports 61, (11) 962 (2017).
- Klochkova et al. (2008) V. G. Klochkova, E. L. Chentsov, and V. E. Panchuk, Astrophys. Bull., 63 (2), 112 (2008).
- Klochkova et al. (2007a) V. G. Klochkova, E. L. Chentsov, V. E. Panchuk, et al., Baltic Astronomy 16, 155 (2007a).
- Klochkova et al. (2007b) V. G. Klochkova, E. L. Chentsov, N. S. Tavolganskaya, and M. V. Shapovalov, Astrophys. Bull., 62 (2), 162 (2007b).
- Klochkova et al. (2010) V. G. Klochkova, V. E. Panchuk, and N. S. Tavolzhanskaya, Astronomy Reports 54 (3), 234 (2010).
- Klochkova et al. (2022) V. G. Klochkova, V. E. Panchuk, and M. V. Yushkin, Astrophys. Bull., 77 (1), 84 (2022).
- Klochkova et al. (1999) V. G. Klochkova, R. Szczerba, V. E. Panchuk, and K. Volk, A&A 345, 905 (1999).
- Kochanek et al. (2017) C. S. Kochanek, B. J. Shappee, K. Z. Stanek, et al., PASP 129 (980), 104502 (2017).
- Kwok (1993) S. Kwok, ARA&A 31, 63 (1993).
- Lebre et al. (1996) A. Lebre, N. Mauron, D. Gillet, and D. Barthes, A&A 310, 923 (1996).
- Liu et al. (2018) N. Liu, R. Gallino, S. Cristallo, et al., ApJ 865 (2), 112 (2018).
- Miroshnichenko et al. (2021) A. S. Miroshnichenko, V. G. Klochkova, E. L. Chentsov, et al., MNRAS507 (1), 879 (2021).
- Panchuk et al. (2017) V. E. Panchuk, V. G. Klochkova, and M. V. Yushkin, Astronomy Reports 61 (9), 820 (2017).
- Reddy et al. (1999) B. E. Reddy, E. J. Bakker, and B. J. Hrivnak, ApJ 524 (2), 831 (1999).
- Reyniers et al. (2002) M. Reyniers, H. Van Winckel, E. Biémont, and P. Quinet, A&A 395, L35 (2002).
- Sahai et al. (2007) R. Sahai, M. Morris, C. Sánchez Contreras, and M. Claussen, AJ 134 (6), 2200 (2007).
- Soker (2008) N. Soker, ApJ 674 (1), L49 (2008).
- Ueta et al. (2005) T. Ueta, K. Murakawa, and M. Meixner, AJ 129 (3), 1625 (2005).
- Ueta et al. (2007) T. Ueta, K. Murakawa, and M. Meixner, AJ 133 (4), 1345 (2007).
- Volk et al. (1999) K. Volk, S. Kwok, and B. J. Hrivnak, ApJ 516 (2), L99 (1999).
- Zhang et al. (2009) K. Zhang, B. W. Jiang, and A. Li, MNRAS 396 (3), 1247 (2009).