Early results from GLASS-JWST. III: Galaxy candidates at z9-15111Based on observations collected with JWST under the ERS programme ID 1324 (PI T. Treu)
Abstract
We present the results of a first search for galaxy candidates at z9–15 on deep seven-bands NIRCam imaging acquired as part of the GLASS-JWST Early Release Science Program on a flanking field of the Frontier Fields cluster A2744. Candidates are selected via two different renditions of the Lyman-break technique, isolating objects at z9-11, and z9-15, respectively, supplemented by photometric redshifts obtained with two independent codes. We find five color-selected candidates at z9, plus one additional candidate with photometric redshift z9. In particular, we identify two bright candidates at that are unambiguously placed at and , respectively. The total number of galaxies discovered at is in line with the predictions of a non-evolving LF. The two bright ones at are unexpected given the survey volume, although cosmic variance and small number statistics limits general conclusions. This first search demonstrates the unique power of JWST to discover galaxies at the high redshift frontier. The candidates are ideal targets for spectroscopic follow-up in Cycle.
1 Introduction
Since the discovery of the first object at a cosmological distance (Schmidt, 1963), the quest for “the most distant source ever seen” has been both a motivation and a powerful mean to expand our understanding of cosmology and of how astronomical objects formed and evolved. Substantial progress in the study of distant, star-forming galaxies has been enabled by the Lyman-break technique yielding to samples of so-called Lyman-break galaxies (LBGs) at progressively higher redshifts (e.g. Giavalisco, 2002).
In recent years, the combination of Hubble Space Telescope (HST) and ground-based data enabled the selection of relatively large samples of LBGs at z2–8 (e.g. Reddy & Steidel, 2009; McLure et al., 2013; Finkelstein et al., 2015; Roberts-Borsani et al., 2016; Ono et al., 2018; Atek et al., 2018). The inferred UV luminosity functions (LF), together with assumptions on the ionizing output of LBGs, enabled the first investigations of the epoch of reionization (EoR, e.g., Dayal & Ferrara, 2018). The data are consistent with a scenario in which the Universe was still largely neutral at z8 and was rapidly reionized by (e.g. Mitra et al., 2015; Greig & Mesinger, 2017; Mason et al., 2018), likely by faint star-forming galaxies (e.g. Castellano et al., 2016a; Yue et al., 2018; Finkelstein et al., 2019; Dayal et al., 2020).
Very few constraints are available at higher redshifts. Small samples of increasingly bright objects have been selected up to z9–11 (Zheng et al., 2012; Oesch et al., 2013; Coe et al., 2013; McLeod et al., 2016; Hashimoto et al., 2018; Ishigaki et al., 2018; Morishita et al., 2018; Rojas-Ruiz et al., 2020; Bouwens et al., 2021; Roberts-Borsani et al., 2022a; Bagley et al., 2022). The available estimates of the Schechter UV LF show significant discrepancies, with some results in agreement with a smooth evolution from lower redshifts, driven either by a decrease of or by a dimming of (e.g. McLeod et al., 2016), other analysis suggesting either a dearth (Oesch et al., 2018) or an excess (Bagley et al., 2022) of bright galaxies at z10. As a result, the cosmic star-formation rate density (SFRD) is poorly constrained, and it is not clear whether the ratio between star-formation rate and dark matter accretion rate remains approximately constant at z9-11 as found at z7 (Harikane et al., 2022a).
The discovery of the population of galaxies that ended the so-called “dark ages” at z12 and beyond has been so far prevented by the limited IR spectral coverage of HST, and by the insufficient sensitivity and resolution of Spitzer and ground-based telescopes. In fact, at such high-redshifts only tentative candidates have been found (Harikane et al., 2022a). The highest spectroscopically confirmed redshift is that of LBG GN-z11 at (Oesch et al., 2016; Jiang et al., 2021). Even with their limitations, current observations have challenged our understanding of galaxy build-up in the early universe. The number densities of bright candidates and GN-z11 lie above the typical empirical Schechter function (e.g., Bowler et al., 2020) while theoretical models are in tension with the abundance of bright galaxies (Finkelstein et al., 2022). Thus, these remarkably bright galaxies may mark a significant transition in the mode of galaxy formation in the early universe: likely significantly less dust-obscured and with a higher star formation efficiency enabling more stars to form in high mass halos, and/or the presence of young quasars. Understanding how these galaxies formed requires building a census of the galaxy population at with deeper photometric data, especially at longer wavelengths than those covered by HST.
In this paper we present the search for LBG candidates at z9–15 in the first NIRCam imaging data from the GLASS-JWST Early Release Science Program (JWST-ERS-1324, Treu et al., 2022, T22 hereafter). GLASS-JWST targets the HFF galaxy cluster A2744 (Lotz et al., 2014; Merlin et al., 2016a; Castellano et al., 2016b) with NIRISS and NIRSpec spectroscopy, while obtaining coordinated parallel observations with NIRCam on two flanking fields. The GLASS NIRCam parallels are the deepest images collected by the 13 ERS programs. Details on the design and strategy of the GLASS-JWST survey can be found in T22.
Throughout the paper we adopt AB magnitudes (Oke & Gunn, 1983), and a flat -CDM concordance model ( = 70.0 km s-1 Mpc-1, ).
2 GLASS-JWST NIRCam imaging
The GLASS-JWST NIRCam observations discussed in this paper were taken in parallel to NIRISS on June 28-29 2022, They are centered at RA deg and Dec deg, and consist of images in seven bands: F090W (total exposure time: 11520 seconds), F115W (11520 s.), F150W (6120 s.), F200W (5400 s.), F277W (5400 s.), F356W (6120 s.), and F444W (23400 s.). The image reduction and calibration, and the methods used to detect sources and measure multi-band photometry are described in a companion paper (paper II in this series, Merlin et al., 2022, M22 hereafter). The NIRISS observations are described in paper I (Roberts-Borsani et al., 2022b).
For convenience of the reader, we briefly summarise below the information relevant for the present paper. Data reduction and flux calibration were obtained using the official JWST pipeline222https://jwst-docs.stsci.edu/jwst-science-calibration-pipeline-overview and exploiting the calibration files made available by STScI on July 29 2022. A customized step has been introduced to improve masking of image defects (”snowballs” and ”wisps”) and to improve the subtraction of 1/f noise and background. Images have been aligned to a common reference grid (defined on Gaia DR3 calibrated ground-based images) using a custom pipeline already adopted in similar projects (Fontana et al., 2014).
We warn the reader that flat–fielding, flux calibration and other steps of the data processing are inevitably based on preliminary calibrations. Similarly, the cleaning of defects, especially in the bluest bands that are used here to identify the Lyman break, will also be improved as the knowledge of the telescope and instrument improves.
Objects were detected using a customized version of SExtractor (Bertin & Arnouts, 1996; Guo et al., 2013, v2.8.6) on the F444W coadded image. Total F444W fluxes in elliptical apertures as defined by Kron (1980) were measured with a-phot (Merlin et al., 2019). Fluxes in the other bands were measured with a-phot in several apertures at the positions of the detected sources using images PSF-matched to the F444W one. For the final search of high-z candidates we have used both an aperture of 2FWHM diameter (=) as well as a smaller, one. The latter has been adopted to optimize the search of potentially blended sources, which may be useful in our crowded field.
The final 5 depths for point sources within a circular aperture of diameter of are 28.78, 29.03, 28.84, 28.89, 29.26, 29.33, 29.71 in the F090W-F444W bands, respectively (M22).
We estimate a total area of 7 sq. arcmin available for the selection of high-redshift candidates by considering the regions observed in all bands, and excluding the pixels occupied by foreground sources. Modest lensing magnification is expected to be present in the NIRCam parallel fields. In this initial set of papers we neglect the effect. The issue will be revisited after the completion of the campaign, which includes a second NIRCam field, in parallel to NIRSpec observations (T22).
3 Selection of Lyman-break galaxies at z9 with NIRCam
3.1 Color-color selection
We defined color selection criteria for galaxies at z9-15 using a catalogue of objects at z0-15 that mimicks our observations. The catalogue comprises objects at 0z4.5 generated with the EGG code (Schreiber et al., 2017b), that is based on empirical relations to reproduce observed number counts and color distributions of galaxies at low and intermediate redshifts. Galaxies at higher redshifts have been generated according to observed UV LFs over z5-10 (McLeod et al., 2015; Oesch et al., 2018; Bouwens et al., 2021) and randomly associating to each object a template from a library based on Bruzual & Charlot (2003, BC03 hereafter) models with metallicity=0.02,0.2 Z⊙, 0E(B-V)0.2, constant SFH, Salpeter (1955) IMF and Calzetti et al. (2000) extinction law to predict photometry in 7 bands.
In order to provide sufficient statistics to design appropriate selection criteria, we simulated the catalog over an area of 0.12 sq. deg., which is 60 times larger than the NIRCam parallel field, and we assumed no evolution of the UV LF beyond . We also artificially boosted the number counts at z by a factor of 20. The over-representation of high-z sources in the mock catalogs is taken into account when considering purity and completeness. Late type dwarf stars are another potential source of contamination for the color selection of high-redshift galaxies. We assessed their impact using synthetic JWST photometry for the models by Marley et al. (2021) which include brown dwarfs and self-luminous extrasolar planets with and metallicity [M/H] from 0.5 to + 0.5. The brown dwarf models were normalized at 26.0F444W28.0 in 0.5 mag steps.
Finally, the catalogues were perturbed by adding noise in order to reproduce the expected relation and scatter between magnitudes and errors in each band.
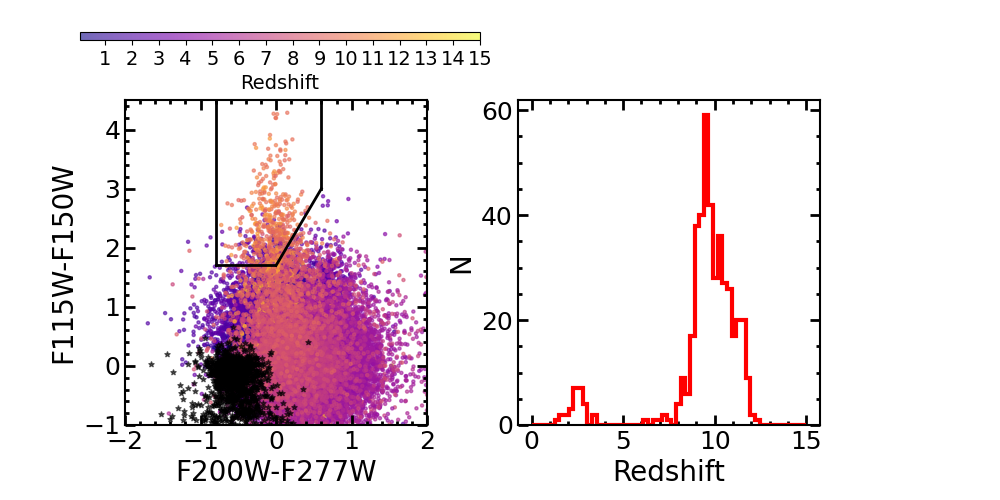
We find that the following color-color selection window, which is a modified version of the selection proposed by Hainline et al. (2020), identifies objects at z9-11.5, as shown also in the top panels of Fig. 1:
| (1) | ||||
In addition, we require a signal-to-noise ratio SNR3 in all bands redward of the Lyman break (F150W, F200W, F277W, F356W), and SNR1.5 in the F090W band.
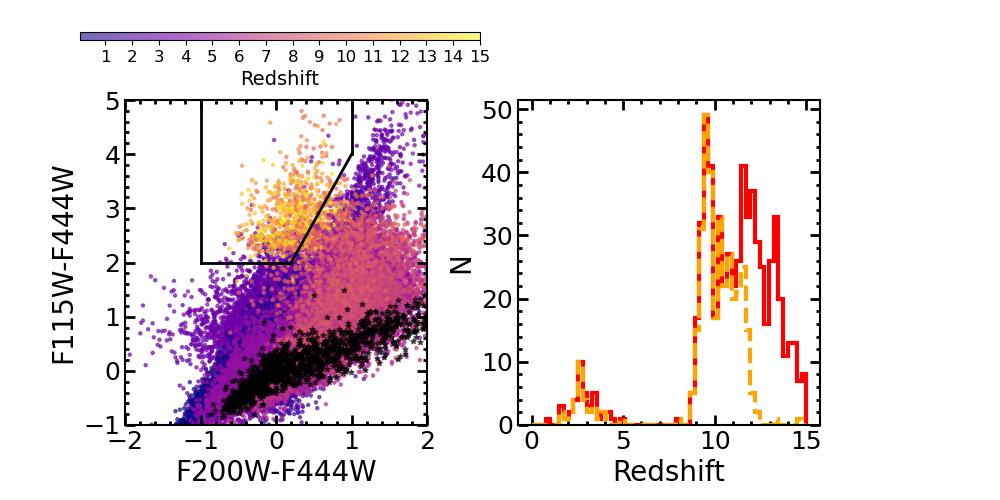
Objects in the wider range z9-15 are well identified by the following selection criteria, which leverages also on the redder bands (e.g. F444W):
| (2) | ||||
By requiring all the SNR requirements above, plus SNR(F150W)2 and SNR(F115W)2 , the selection in Eq. 2 proves to be complementary to the one in Eq. 1, sampling the z11-15 redshift range (Fig. 1, bottom panels). We verified that most of the z11 objects selected in the F115W-F150W vs F200W-F277W diagram occupy the expected color space in F115W-F444W vs. F200W-F444W one, although photometric scatter may move them outside the color selection window. For this reason, and given also the differences in depths among the various bands, the two diagrams are not expected to select coincident samples in the z range.
For both color selections described above, we consider only objects with SNR(F444W)8, corresponding to F444W28.2, that given the relevant depths in the bluer bands enables the measurement of the large color terms (1.7-2) required to separate high-redshift galaxies from the bulk of contaminants. While the proposed diagrams efficiently select high-redshift targets, some contamination from low-redshift galaxies is evident from the redshift distribution of the selected objects (right panels in Fig. 1). The impact of such contamination and the completeness of the selection criteria will be discussed in Sect. 3.3. Instead, contamination from brown dwarfs is not a concern for our z9-15 selection. We show in Fig. 1 late type stars with 26.0F444W28.0 that meet the above mentioned SNR criteria in the F150W to F444W bands: the brown dwarfs occupy a distinct region of the color diagrams.
3.2 Photometric redshift selection
In addition, we search for high-redshift candidates that do not meet the color selection criteria defined above but have robust photometric redshift in the range z=9-15. We estimate photometric redshifts with two different codes, EAzY (Brammer et al., 2008), and zphot (Fontana et al., 2000). The EAzY code was run with the default V1.3 spectral template and a flat prior (see the companion paper by Leethochawalit et al., 2022). The analysis with zphot has been performed by fitting the observed photometry with BC03 templates (see the companion paper by Santini et al., 2022). As described by Merlin et al. (2021), the BC03 library includes templates with both declining and delayed star-formation histories and models the contribution from nebular continuum and line emission following Schaerer & de Barros (2009) and Castellano et al. (2014).
Conservatively, photometric redshift candidates are chosen as objects with both and .
We also require SNR(F444W)8 and SNR3 in F200W, F277W and F356W, to ensure a proper measurement of the spectral energy distributions (SEDs). Although some true positives may be lost with this approach, the multiple requirements help minimize the risk of contamination.
3.3 Completeness and Purity
We used simulations to estimate the completeness of our selection of z9 galaxies. First, simulated NIRCam images in all relevant filters are built out of raw frames obtained by the Mirage333https://www.stsci.edu/jwst/science-planning/proposal-planning-toolbox/mirage software on the basis of the actual scheduling of the Program as derived from the APT. The simulations as described by M22 were used to fine tune the image reduction pipeline, and accurately reproduce the noise properties of the real NIRCam images.
Second, we inserted in blank regions of the simulated images 2.5105 mock LBGs at 915 and with a constant distribution at -18.5M-22.5. The observed magnitudes are obtained by randomly associating a BC03 model from the library described in Sec. 3. We assume that objects follow a circular Sersic (1968) light profile with n=1 and that their effective radius scales with LUV as r, consistent with several estimates at comparable redshifts (e.g. Grazian et al., 2012; Kawamata et al., 2018; Bouwens et al., 2022; Yang et al., 2022a). Following Yang et al. (2022a) we assume an effective radius of 0.8 kpc for objects with MUV=-21. In order to avoid overcrowding, simulations are repeated by inserting 500 objects each time. Detection and photometry on the simulated galaxies is performed in the same way as for the real catalog.
We estimate a completeness of 70% (60%) for the selection of bright M-20 objects at z9-11 (z11-15), decreasing to 60% (50%) at the nominal limits of M-19.0 (-19.5) quoted above. We also find a non negligible chance of detection of fainter targets due to photometric scatter, with a completeness of 50% (35%) for the selection of objects of M-18.5 (-19.0) at z9-11 (z11-15).
We evaluate potential contamination with two different mock catalogs perturbed with realistic noise reproducing the depth of our data. As a first test, we use the mock catalog described in Sec. 3 based on EGG and known UV LFs from the literature. We find that each of our color criteria would select 0.6 interlopers on an area equivalent to ours. As expected (e.g., Vulcani et al., 2017), the interlopers are mostly faint (F444W28), red galaxies at z2-3 (see Fig. 1). As a second test we use the mock catalogs from the JAdes extraGalactic Ultradeep Artificial Realizations (JAGUAR) (Williams et al., 2018), including predicted NIRCam fluxes for objects at 0.215 and stellar mass log(M/M⊙)6. JAGUAR provides a complementary test with respect to EGG also thanks to the inclusion of emission lines in the predicted SEDs. The potential contamination from objects in the JAGUAR catalog turns out to be much lower than in the previous case, i.e. 0.1 objects per selection, per field. In conclusion, both tests suggest that residual contamination should be small, albeit with some uncertainty. This is inevitable, considering that the 1-5 m spectra of intermediate galaxies at these depths are uncharted territory.
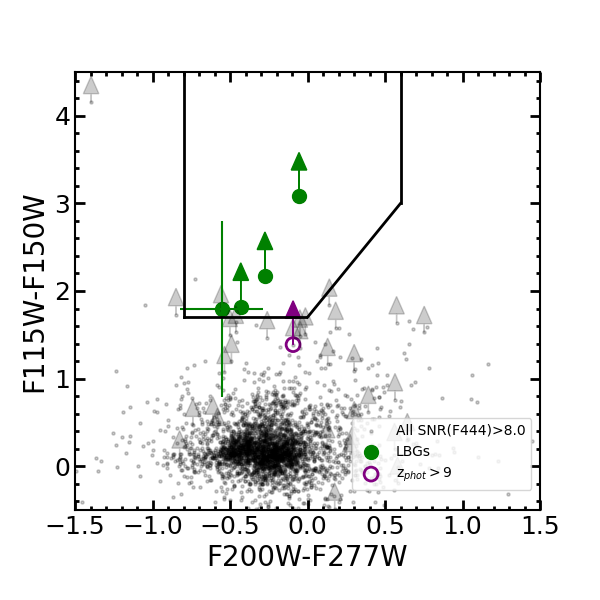
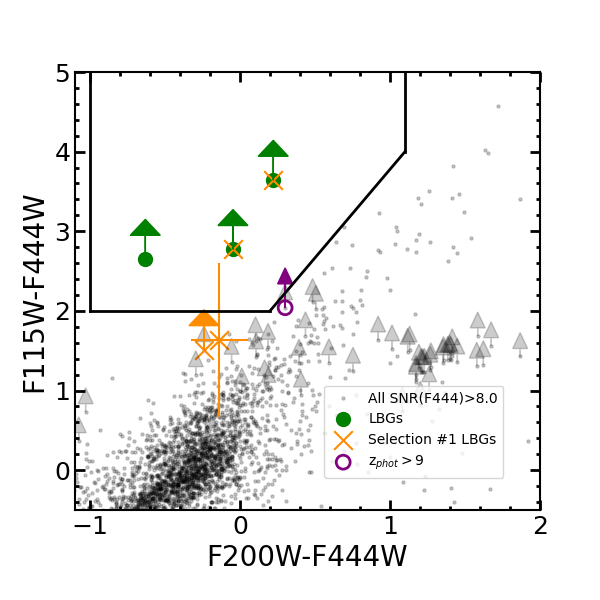
4 Candidate galaxies at
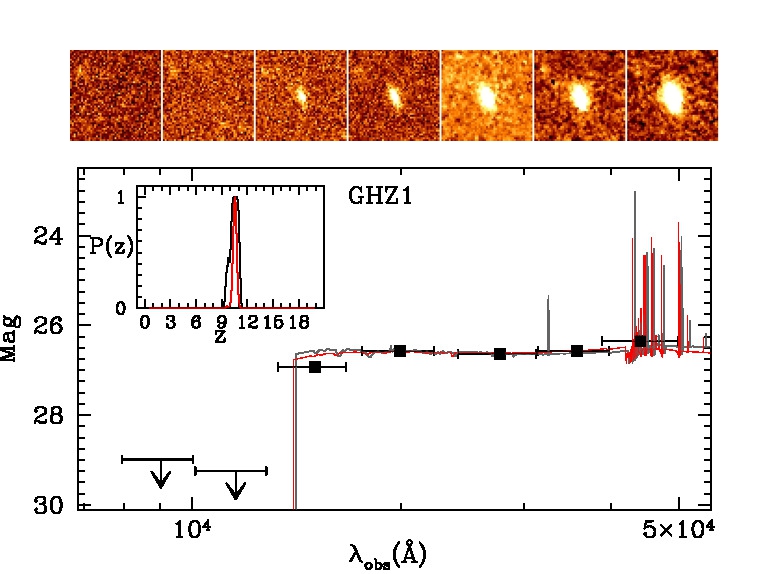
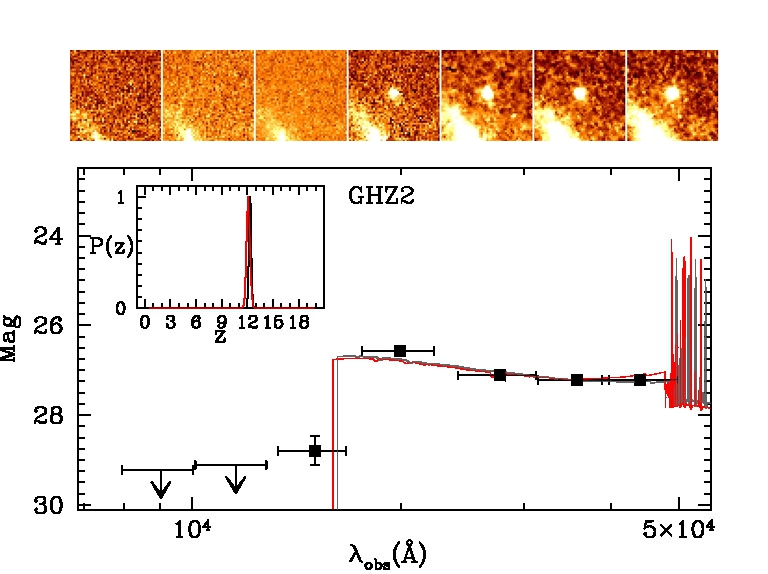
The resulting observed color-color diagrams are shown in Fig. 2. We select five candidates at z9 by combining the samples from the two selections described in Sec. 3. One additional candidate is selected from the photometric redshift analysis described in Sec. 3.2. The positions and magnitudes of the candidates are listed in Table 1. All objects are selected with both the 2FWHM and the aperture colors, with the exception of GHZ5 whose F115W-F150W color is slightly outside the selection boundary when using the 2FWHM ones.The six selected objects have been visually inspected to ensure that they are not affected by defects such as spurious sources, stellar spikes, etc. We found that GHZ2 is very compact and it is close (0.5”) to a bright, foreground galaxy that contaminates the total flux measured within the Kron ellipse. We thus estimated its total flux using the T-PHOT software (Merlin et al., 2015, 2016b) which has been shown to provide accurate photometry for blended sources. We used the GHZ2 light profile in the F277W band, which provides the best compromise between resolution, SNR and contamination from the low redshift neighbour, as high-resolution prior to re-extract the F444W photometry. We found a total magnitude F444W=27.21 0.04. Finally, we have used GALFIT (Peng et al., 2010) to fit its light profile in both the F200W and F444W bands in order to measure its spatial extent and to further assess the measurement of the total flux under different assumptions. We used a Sersic (1968) model and fixed the index at different values from n=0.5 to n=4. We found that GHZ2 is compact but resolved, with effective radius pixels. The n=1 fit provides the best residuals. We found from GALFIT a total F444W magnitude of F444W=27.25 0.20, in agreement with the T-PHOT measurement but with a larger error due to the systematic uncertainty on the profile parameters. We adopt this conservative error estimate in the forthcoming analysis.
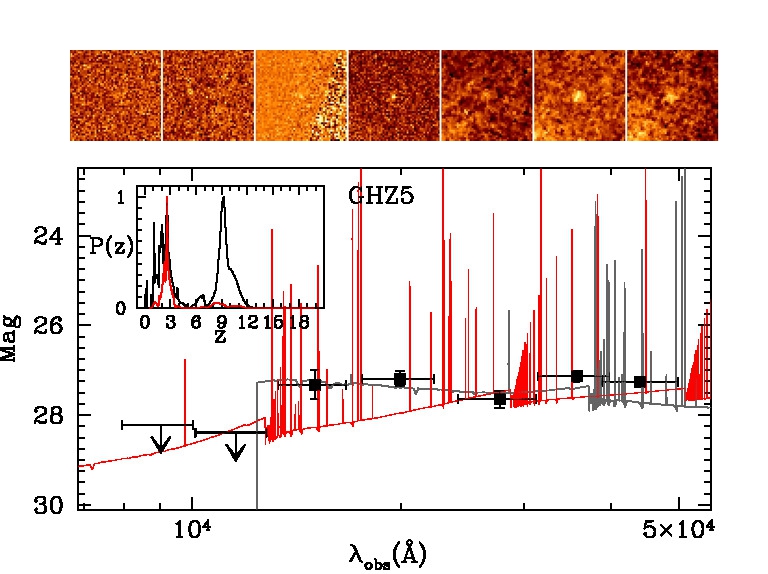
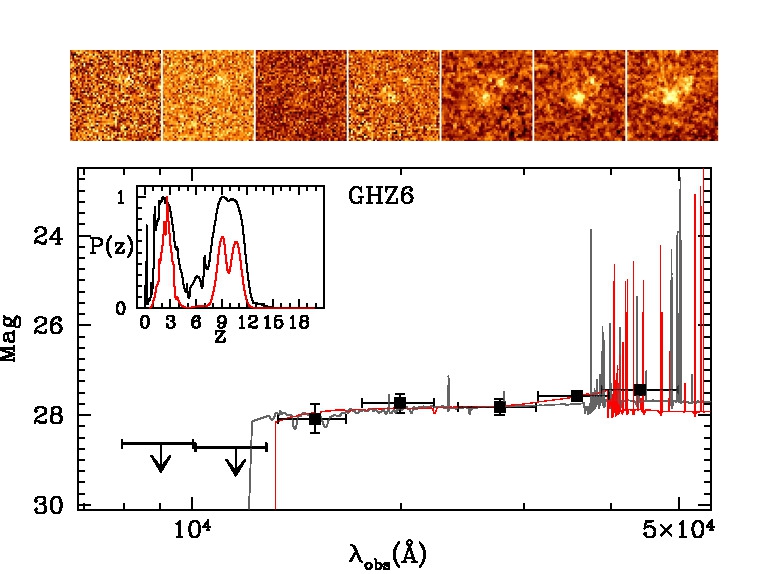
Table 1 also reports the UV rest-frame magnitudes estimated from the observed F200W at the median photometric redshift, the UV slope obtained by a fit on the observed F200W, F277W and F356W bands, the effective radius (Yang et al., 2022b), and the SFR from the SED-fitting performed with zphot (Santini et al., 2022). We show in Fig. 3 and Fig. 4 the best-fit SEDs, the PDF(z) and thumbnails for all candidates.
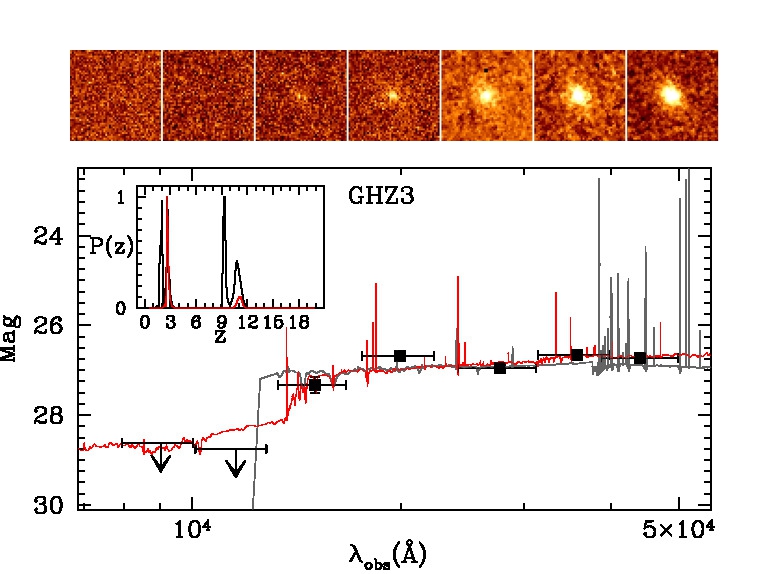
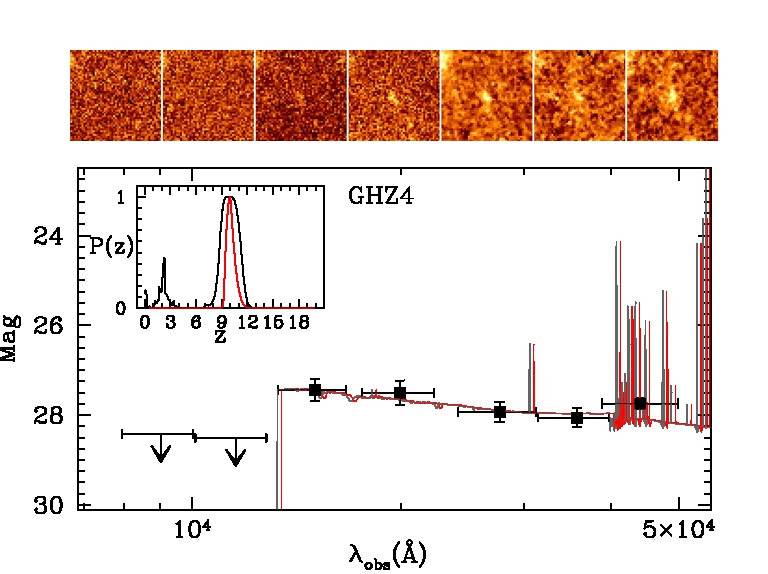
We highlight the detection of the two bright sources GHZ1 and GHZ2, at and , respectively. These objects are located in the color-color diagram fairly away from color selection borders, and have no significant low-redshift solution. Their P(z) is single peaked, the 68% confidence level photometric redshift range being 9.68-11.15 (10.28-10.80) for GHZ1 and 12.03-12.58 (11.85-12.39) for GHZ2. They are among the most robust candidates at ever detected, as demonstrated by the several recent works that have presented their selection with redshift and properties comparable to those discussed here (Donnan et al., 2022; Harikane et al., 2022b; Naidu et al., 2022). They are remarkably bright (M-21) and star-forming (SFR20/yr). GHZ2 is compact with Re=12010 pc (Yang et al., 2022b) and it has a very steep UV slope =-3.0. This extreme value is partly driven by the F200W band, as the slope value is =-2.40.2 when using the F277W and F356W bands only. These UV slope estimates are anyway indicative of very young ages and very low metallicity, possibly pristine, stellar populations which will need to be confirmed through JWST spectroscopy. A third bright candidate (GHZ3, M-20.7, SFR30/yr) is also selected by both of our color diagrams, but its photometric redshift is more uncertain: it is found to be at z9.3 by zphot, while EAzY gives a best-fit solution at z2.7. The remaining candidates are fainter (M-20.2) galaxies likely at z9-10.
The GHZ3-6 candidates exhibit in general alternative lower-z solutions with non-negligible probability. These lower-z solutions are driven in part by our conservative error estimates, especially in the bluer bands, accounting for data reduction and calibration systematics (M22). However, definitive confirmation will require deep imaging at shorter wavelengths. Instead, contamination from galactic stars can be excluded because all objects show resolved profiles as discussed by Yang et al. (2022b) 444Reassuringly, the candidate T-dwarf star GLASS-JWST-BD1 found in the GLASS-JWST-ERS field by Nonino et al. (2022) is not selected by any of our criteria.
The physical properties, morphology, and size of our candidates are discussed in detail in the companion papers by Santini et al. (2022), Treu et al. (2022), and Yang et al. (2022b) respectively.
| ID | R.A. | Dec | F444W | zEAzY | zzphot | MUV | SFR | Re | Selection | |
|---|---|---|---|---|---|---|---|---|---|---|
| deg. | deg. | /yr | kpc | |||||||
| GHZ1 | 3.511929 | -30.371848 | 26.360.05 | 10.53 | 10.63 | -20.980.06 | -1.990.10 | 25 | 0.43 0.02 | 1,2 |
| GHZ2b | 3.498985 | -30.324771 | 27.210.20 | 12.11 | 12.30 | -21.190.20 | -3.000.12 | 0.12 0.01 | 2 | |
| GHZ3 | 3.528937 | -30.363811 | 26.730.07 | 2.69 | 9.33 | -20.690.09 | -1.850.17 | 31 | 0.88 0.09 | 1,2 |
| GHZ4 | 3.513743 | -30.351554 | 27.740.12 | 10.08 | 9.93 | -19.980.27 | -2.860.55 | 5 | 0.39 0.09 | 1,2 |
| GHZ5 | 3.494437 | -30.307620 | 27.250.08 | 2.49 | 9.20 | -20.170.18 | -1.820.33 | 18 | 0.21 0.08 | 1 |
| GHZ6 | 3.479054 | -30.314925 | 27.430.11 | 9.85 | 9.05 | -19.660.21 | -1.670.38 | 10 | 0.45 0.09 | photo-z |
Note. — a) Coordinates and fluxes are from the GLASS-JWST catalog by M22, the rest-frame MUV has been obtained by converting the F200W magnitude at the average photometric redshift, except for GHZ3 and GHZ5 where the only solution at z was used. The UV slope is obtained by fitting the F200W, F277W and F356W bands, the uncertainties in the fit account for photometric errors (Castellano et al., 2012). The Re has been estimated from the F200W image by Yang et al. (2022b). Physical parameters from zphot (Santini et al., 2022). The last column indicate selections #1 and #2 in Sect. 3, and additional photo-z candidates not meeting color selection criteria. b) All errors are computed considering the systematic uncertainty from different photometric techniques (Sect. 4).
5 Summary and Discussion
We have presented a search for galaxy candidates at z9-15 from the seven-bands, mag 29 (5) NIRCam imaging observations, acquired by the GLASS-JWST Early Release Science Program in parallel with NIRISS primary observations of the cluster A2744. The NIRCam images enable the first multi-band selection of Lyman-break candidates at z9-15 through two independent color-color diagrams.
We have identified two bright () sources which, thanks to the depth of our images, are unambiguously placed at and , respectively. These are among the most reliable candidates ever selected at via photometric techniques.
We have also identified five other fainter candidates at . Some of these objects have significant alternative solutions at lower redshift, that it is difficult to exclude given the limits that are currently achieved by our data, and residual systematic uncertainties especially in the bluest bands. Definitive confirmation will require deeper images at short wavelengths as well as NIRSpec spectroscopic follow-up.
Keeping in mind the uncertainties associated with our limited area and to the presence of a foreground cluster that may boost the luminosity of our candidates, it is intriguing to explore the potential implications of our results on the evolution of galaxies at large redshift.
Noting that the F444W28.2 limit corresponds to M-19. (-19.5) at , we estimate the average number of sources expected in our field under several assumptions about the evolution of the LF.
At z9-11 we expect 1.7 on the basis of the z9 and z10 UV LFs by Bouwens et al. (2021) and Oesch et al. (2018), respectively, where the uncertainties consider the relevant 68%c.l. confidence range in the LF parameters. The double power law (DPL) model by Bowler et al. (2020) predicts 2.4 galaxies. We expect as many as 6.8 objects at z9-11 on the basis of the model by Mason et al. (2015).
At z11, where no direct constraints exists, we can estimate the average number of sources with M-19.5 under four scenarios. In the first (optimistic) case we assume that the UV LF remains constant up to and predict 0.6 objects in one GLASS-JWST-ERS parallel field. A perhaps more realistic scenario is provided by the evolving UV LF by Bouwens et al. (2021) that extrapolates at z11 the observed evolution in the Schechter (1976) parameters of the UV LFs measured at lower redshifts. In this second scenario, on average, only 0.1 objects fall within one NIRCAM parallel field. A similar number of 0.08 objects is predicted based on Mason et al. (2015). Finally, the extrapolation at z=11-15 of the evolving DPL model by Bowler et al. (2020) predicts 0.5 objects.
We note that such predictions are affected by cosmic variance at the level of 40%555Following the Cosmic Variance Calculator at https://www.ph.unimelb.edu.au/ mtrenti/cvc/CosmicVariance.html. See Trenti & Stiavelli (2008).. We also note that the adopted MUV limits may be altered by photometric scatter. In combination with the steep increase in the number counts beyond the knee of the LF, a non negligible number of fainter sources can thus be scattered within the observable range. As a reference, by adopting 0.5 mag fainter MUV cuts, the predicted number of objects at z9-11 increases to 3.5 on the basis of the observed UV LFs, and to 7.5 in the Mason et al. (2015) model. The predicted number of sources at z11 increases to 1.5 (0.2) assuming a constant (evolving) UV LF as above, and to 0.26 on the basis of Mason et al. (2015).
Considering the incompleteness of our sample, as estimated above, we conclude that the total number of detected sources is roughly in line with the expectations of a non-evolving LF.
What is most remarkable of this first search is that we have found two bright (M-21) sources, one at and one at z12, well beyond the expectations based on the extrapolation of the LF at lower redshift. In fact, all observations and models predict a negligible number of sources brighter than this limit in the redshift range z=9-15 on an area equal to the GLASS one: the predictions being of 0.2 objects, compared to an observed number of 2 (where the uncertainty includes both cosmic variance and the Poisson uncertainty for small number of events computed following Gehrels, 1986). The aforementioned predictions are summarised in Table 2. Clearly it is premature to draw broad conclusion based on a single field, considering small number statistics, cosmic variance, clustering and lensing. In particular, the impact of lensing on these results will need to be assessed. A preliminary investigation (based on the model by Bergamini et al., 2022) suggests that magnification may be 2-10 times higher than the 10-15% value measured in the HFF Abell2744 Parallel (Castellano et al., 2016b). At the present stage this indication is highly uncertain because it is extrapolated from the cluster core to the NIRCam field 3 arcmins away and, most importantly, it is not possible to obtain lensing constraints for single sources. We note that our candidates do not show any evidence of being sheared, so although magnification of up to 50% is possible, it is unlikely to be much higher. A thorough analysis will be performed upon availability of additional spectroscopic information in the GLASS-JWST-ERS field. Despite the aforementioned sources of uncertainty, these results show that JWST can obtain the scientific results it has been designed for.
| UV LF | z=9-11 | z11 | ||
| M-21.0 | M-19.0 | M-21.0 | M-19.5 | |
| Oesch+18b | 0.06 | 1.7 | 0.04 | 0.6 |
| LF(z) Bouwens+21c | ” | ” | 0.01 | 0.1 |
| Mason+15d | ||||
| Bowler+20e | ||||
a Uncertainties on the predicted numbers are based on the 68%c.l. errors on the Schechter parameters; b UV LF at z10 by Oesch et al. (2018), assumed fixed at z11; c Extrapolation at z11 of the UV LF as a function of redshift by Bouwens et al. (2021). d The semi-empirical UV LF model by Mason et al. (2015). e Extrapolation of the DPL model as a function of redshift by Bowler et al. (2020).
There is no doubt that the deeper and/or wider surveys already planned will eventually gather the long-awaited-for sample of galaxies in the reionization epoch and revise our understanding of how and when bright galaxies formed.
This first JWST-based search for candidate galaxies also provides us with compelling targets for spectroscopic follow-up in JWST Cycle-2. In addition to providing the necessary redshift confirmation, the relatively high luminosity of these galaxies means that NIRSpec spectroscopy should enable the study of their physical properties such as star formation rate, dust content, and gas metallicity.
References
- Astropy Collaboration et al. (2013) Astropy Collaboration, Robitaille, T. P., Tollerud, E. J., et al. 2013, A&A, 558, A33, doi: 10.1051/0004-6361/201322068
- Atek et al. (2018) Atek, H., Richard, J., Kneib, J.-P., & Schaerer, D. 2018, MNRAS, 479, 5184, doi: 10.1093/mnras/sty1820
- Bagley et al. (2022) Bagley, M. B., Finkelstein, S. L., Rojas-Ruiz, S., et al. 2022, arXiv e-prints, arXiv:2205.12980. https://arxiv.org/abs/2205.12980
- Bergamini et al. (2022) Bergamini, P., Acebron, A., Grillo, C., et al. 2022, arXiv e-prints, arXiv:2207.09416. https://arxiv.org/abs/2207.09416
- Bertin & Arnouts (1996) Bertin, E., & Arnouts, S. 1996, A&AS, 117, 393
- Bouwens et al. (2022) Bouwens, R. J., Illingworth, G. D., van Dokkum, P. G., et al. 2022, ApJ, 927, 81, doi: 10.3847/1538-4357/ac4791
- Bouwens et al. (2021) Bouwens, R. J., Oesch, P. A., Stefanon, M., et al. 2021, AJ, 162, 47, doi: 10.3847/1538-3881/abf83e
- Bowler et al. (2020) Bowler, R. A. A., Jarvis, M. J., Dunlop, J. S., et al. 2020, MNRAS, 493, 2059, doi: 10.1093/mnras/staa313
- Brammer et al. (2008) Brammer, G. B., van Dokkum, P. G., & Coppi, P. 2008, ApJ, 686, 1503, doi: 10.1086/591786
- Bruzual & Charlot (2003) Bruzual, G., & Charlot, S. 2003, MNRAS, 344, 1000, doi: 10.1046/j.1365-8711.2003.06897.x
- Calzetti et al. (2000) Calzetti, D., Armus, L., Bohlin, R. C., et al. 2000, ApJ, 533, 682, doi: 10.1086/308692
- Castellano et al. (2012) Castellano, M., Fontana, A., Grazian, A., et al. 2012, A&A, 540, A39, doi: 10.1051/0004-6361/201118050
- Castellano et al. (2014) Castellano, M., Sommariva, V., Fontana, A., et al. 2014, A&A, 566, A19, doi: 10.1051/0004-6361/201322704
- Castellano et al. (2016a) Castellano, M., Yue, B., Ferrara, A., et al. 2016a, ApJ, 823, L40, doi: 10.3847/2041-8205/823/2/L40
- Castellano et al. (2016b) Castellano, M., Amorín, R., Merlin, E., et al. 2016b, A&A, 590, A31, doi: 10.1051/0004-6361/201527514
- Coe et al. (2013) Coe, D., Zitrin, A., Carrasco, M., et al. 2013, ApJ, 762, 32, doi: 10.1088/0004-637X/762/1/32
- Dayal & Ferrara (2018) Dayal, P., & Ferrara, A. 2018, Phys. Rep., 780, 1, doi: 10.1016/j.physrep.2018.10.002
- Dayal et al. (2020) Dayal, P., Volonteri, M., Choudhury, T. R., et al. 2020, MNRAS, 495, 3065, doi: 10.1093/mnras/staa1138
- Donnan et al. (2022) Donnan, C. T., McLeod, D. J., Dunlop, J. S., et al. 2022, arXiv e-prints, arXiv:2207.12356. https://arxiv.org/abs/2207.12356
- Finkelstein et al. (2015) Finkelstein, S. L., Ryan, Jr., R. E., Papovich, C., et al. 2015, ApJ, 810, 71, doi: 10.1088/0004-637X/810/1/71
- Finkelstein et al. (2019) Finkelstein, S. L., D’Aloisio, A., Paardekooper, J.-P., et al. 2019, ApJ, 879, 36, doi: 10.3847/1538-4357/ab1ea8
- Finkelstein et al. (2022) Finkelstein, S. L., Bagley, M., Song, M., et al. 2022, ApJ, 928, 52, doi: 10.3847/1538-4357/ac3aed
- Fontana et al. (2000) Fontana, A., D’Odorico, S., Poli, F., et al. 2000, AJ, 120, 2206, doi: 10.1086/316803
- Fontana et al. (2014) Fontana, A., Dunlop, J. S., Paris, D., et al. 2014, A&A, 570, A11, doi: 10.1051/0004-6361/201423543
- Gehrels (1986) Gehrels, N. 1986, ApJ, 303, 336, doi: 10.1086/164079
- Giavalisco (2002) Giavalisco, M. 2002, ARA&A, 40, 579, doi: 10.1146/annurev.astro.40.121301.111837
- Grazian et al. (2012) Grazian, A., Castellano, M., Fontana, A., et al. 2012, A&A, 547, A51, doi: 10.1051/0004-6361/201219669
- Greig & Mesinger (2017) Greig, B., & Mesinger, A. 2017, MNRAS, 465, 4838, doi: 10.1093/mnras/stw3026
- Guo et al. (2013) Guo, Y., Ferguson, H. C., Giavalisco, M., et al. 2013, ApJS, 207, 24, doi: 10.1088/0067-0049/207/2/24
- Hainline et al. (2020) Hainline, K. N., Hviding, R. E., Rieke, M., et al. 2020, ApJ, 892, 125, doi: 10.3847/1538-4357/ab7dc3
- Harikane et al. (2022a) Harikane, Y., Inoue, A. K., Mawatari, K., et al. 2022a, ApJ, 929, 1, doi: 10.3847/1538-4357/ac53a9
- Harikane et al. (2022b) Harikane, Y., Ouchi, M., Oguri, M., et al. 2022b, arXiv e-prints, arXiv:2208.01612. https://arxiv.org/abs/2208.01612
- Hashimoto et al. (2018) Hashimoto, T., Laporte, N., Mawatari, K., et al. 2018, Nature, 557, 392, doi: 10.1038/s41586-018-0117-z
- Hunter (2007) Hunter, J. D. 2007, Computing in Science and Engineering, 9, 90, doi: 10.1109/MCSE.2007.55
- Ishigaki et al. (2018) Ishigaki, M., Kawamata, R., Ouchi, M., et al. 2018, ApJ, 854, 73, doi: 10.3847/1538-4357/aaa544
- Jiang et al. (2021) Jiang, L., Kashikawa, N., Wang, S., et al. 2021, Nature Astronomy, 5, 256, doi: 10.1038/s41550-020-01275-y
- Kawamata et al. (2018) Kawamata, R., Ishigaki, M., Shimasaku, K., et al. 2018, ApJ, 855, 4, doi: 10.3847/1538-4357/aaa6cf
- Kron (1980) Kron, R. G. 1980, ApJS, 43, 305, doi: 10.1086/190669
- Leethochawalit et al. (2022) Leethochawalit, N., Trenti, M., Santini, P., et al. 2022, arXiv e-prints, arXiv:2207.11135. https://arxiv.org/abs/2207.11135
- Lotz et al. (2014) Lotz, J., Mountain, M., Grogin, N. A., et al. 2014, in American Astronomical Society Meeting Abstracts, Vol. 223, American Astronomical Society Meeting Abstracts #223, 254.01
- Marley et al. (2021) Marley, M. S., Saumon, D., Visscher, C., et al. 2021, ApJ, 920, 85, doi: 10.3847/1538-4357/ac141d
- Mason et al. (2015) Mason, C. A., Trenti, M., & Treu, T. 2015, ApJ, 813, 21, doi: 10.1088/0004-637X/813/1/21
- Mason et al. (2018) Mason, C. A., Treu, T., de Barros, S., et al. 2018, ApJ, 857, L11, doi: 10.3847/2041-8213/aabbab
- McLeod et al. (2016) McLeod, D. J., McLure, R. J., & Dunlop, J. S. 2016, MNRAS, 459, 3812, doi: 10.1093/mnras/stw904
- McLeod et al. (2015) McLeod, D. J., McLure, R. J., Dunlop, J. S., et al. 2015, MNRAS, 450, 3032, doi: 10.1093/mnras/stv780
- McLure et al. (2013) McLure, R. J., Dunlop, J. S., Bowler, R. A. A., et al. 2013, MNRAS, 432, 2696, doi: 10.1093/mnras/stt627
- Merlin et al. (2015) Merlin, E., Fontana, A., Ferguson, H. C., et al. 2015, A&A, 582, A15, doi: 10.1051/0004-6361/201526471
- Merlin et al. (2016a) Merlin, E., Bourne, N., Castellano, M., et al. 2016a, A&A, 595, A97, doi: 10.1051/0004-6361/201628751
- Merlin et al. (2016b) —. 2016b, A&A, 595, A97, doi: 10.1051/0004-6361/201628751
- Merlin et al. (2019) Merlin, E., Fortuni, F., Torelli, M., et al. 2019, MNRAS, 490, 3309, doi: 10.1093/mnras/stz2615
- Merlin et al. (2021) Merlin, E., Castellano, M., Santini, P., et al. 2021, A&A, 649, A22, doi: 10.1051/0004-6361/202140310
- Merlin et al. (2022) Merlin, E., Bonchi, A., Paris, D., et al. 2022, arXiv e-prints, arXiv:2207.11701. https://arxiv.org/abs/2207.11701
- Mitra et al. (2015) Mitra, S., Choudhury, T. R., & Ferrara, A. 2015, MNRAS, 454, L76, doi: 10.1093/mnrasl/slv134
- Morishita et al. (2018) Morishita, T., Trenti, M., Stiavelli, M., et al. 2018, ApJ, 867, 150, doi: 10.3847/1538-4357/aae68c
- Naidu et al. (2022) Naidu, R. P., Oesch, P. A., van Dokkum, P., et al. 2022, arXiv e-prints, arXiv:2207.09434. https://arxiv.org/abs/2207.09434
- Nonino et al. (2022) Nonino, M., Glazebrook, K., Burgasser, A. J., et al. 2022, arXiv e-prints, arXiv:2207.14802. https://arxiv.org/abs/2207.14802
- Oesch et al. (2018) Oesch, P. A., Bouwens, R. J., Illingworth, G. D., Labbé, I., & Stefanon, M. 2018, ApJ, 855, 105, doi: 10.3847/1538-4357/aab03f
- Oesch et al. (2013) Oesch, P. A., Labbé, I., Bouwens, R. J., et al. 2013, ApJ, 772, 136, doi: 10.1088/0004-637X/772/2/136
- Oesch et al. (2016) Oesch, P. A., Brammer, G., van Dokkum, P. G., et al. 2016, ApJ, 819, 129, doi: 10.3847/0004-637X/819/2/129
- Oke & Gunn (1983) Oke, J. B., & Gunn, J. E. 1983, ApJ, 266, 713, doi: 10.1086/160817
- Ono et al. (2018) Ono, Y., Ouchi, M., Harikane, Y., et al. 2018, PASJ, 70, S10, doi: 10.1093/pasj/psx103
- Peng et al. (2010) Peng, C. Y., Ho, L. C., Impey, C. D., & Rix, H.-W. 2010, AJ, 139, 2097, doi: 10.1088/0004-6256/139/6/2097
- Reddy & Steidel (2009) Reddy, N. A., & Steidel, C. C. 2009, ApJ, 692, 778, doi: 10.1088/0004-637X/692/1/778
- Roberts-Borsani et al. (2022a) Roberts-Borsani, G., Morishita, T., Treu, T., Leethochawalit, N., & Trenti, M. 2022a, ApJ, 927, 236, doi: 10.3847/1538-4357/ac4803
- Roberts-Borsani et al. (2022b) Roberts-Borsani, G., Morishita, T., Treu, T., et al. 2022b, arXiv e-prints, arXiv:2207.11387. https://arxiv.org/abs/2207.11387
- Roberts-Borsani et al. (2016) Roberts-Borsani, G. W., Bouwens, R. J., Oesch, P. A., et al. 2016, ApJ, 823, 143, doi: 10.3847/0004-637X/823/2/143
- Rojas-Ruiz et al. (2020) Rojas-Ruiz, S., Finkelstein, S. L., Bagley, M. B., et al. 2020, ApJ, 891, 146, doi: 10.3847/1538-4357/ab7659
- Salpeter (1955) Salpeter, E. E. 1955, ApJ, 121, 161, doi: 10.1086/145971
- Santini et al. (2022) Santini, P., Fontana, A., Castellano, M., et al. 2022, arXiv e-prints, arXiv:2207.11379. https://arxiv.org/abs/2207.11379
- Schaerer & de Barros (2009) Schaerer, D., & de Barros, S. 2009, A&A, 502, 423, doi: 10.1051/0004-6361/200911781
- Schechter (1976) Schechter, P. 1976, ApJ, 203, 297, doi: 10.1086/154079
- Schmidt (1963) Schmidt, M. 1963, Nature, 197, 1040, doi: 10.1038/1971040a0
- Schreiber et al. (2017a) Schreiber, C., Pannella, M., Leiton, R., et al. 2017a, A&A, 599, A134, doi: 10.1051/0004-6361/201629155
- Schreiber et al. (2017b) Schreiber, C., Elbaz, D., Pannella, M., et al. 2017b, A&A, 602, A96, doi: 10.1051/0004-6361/201629123
- Sersic (1968) Sersic, J. L. 1968, Atlas de galaxias australes (Cordoba, Argentina: Observatorio Astronomico, 1968)
- Trenti & Stiavelli (2008) Trenti, M., & Stiavelli, M. 2008, ApJ, 676, 767, doi: 10.1086/528674
- Treu et al. (2022) Treu, T., Roberts-Borsani, G., Bradac, M., et al. 2022, The Astrophysical Journal, 935, 110, doi: 10.3847/1538-4357/ac8158
- Treu et al. (2022) Treu, T., Calabro, A., Castellano, M., et al. 2022, arXiv e-prints, arXiv:2207.13527. https://arxiv.org/abs/2207.13527
- Vulcani et al. (2017) Vulcani, B., Trenti, M., Calvi, V., et al. 2017, ApJ, 836, 239, doi: 10.3847/1538-4357/aa5caf
- Williams et al. (2018) Williams, C. C., Curtis-Lake, E., Hainline, K. N., et al. 2018, ApJS, 236, 33, doi: 10.3847/1538-4365/aabcbb
- Yang et al. (2022a) Yang, L., Leethochawalit, N., Treu, T., et al. 2022a, MNRAS, 514, 1148, doi: 10.1093/mnras/stac1236
- Yang et al. (2022b) Yang, L., Morishita, T., Leethochawalit, N., et al. 2022b, arXiv e-prints, arXiv:2207.13101. https://arxiv.org/abs/2207.13101
- Yue et al. (2018) Yue, B., Castellano, M., Ferrara, A., et al. 2018, ApJ, 868, 115, doi: 10.3847/1538-4357/aae77f
- Zheng et al. (2012) Zheng, W., Postman, M., Zitrin, A., et al. 2012, Nature, 489, 406, doi: 10.1038/nature11446