The Caltech Fish Counting Dataset: A Benchmark for Multiple-Object Tracking and Counting
Abstract
We present the Caltech Fish Counting Dataset (CFC), a large-scale dataset for detecting, tracking, and counting fish in sonar videos. We identify sonar videos as a rich source of data for advancing low signal-to-noise computer vision applications and tackling domain generalization in multiple-object tracking (MOT) and counting. In comparison to existing MOT and counting datasets, which are largely restricted to videos of people and vehicles in cities, CFC is sourced from a natural-world domain where targets are not easily resolvable and appearance features cannot be easily leveraged for target re-identification. With over half a million annotations in over 1,500 videos sourced from seven different sonar cameras, CFC allows researchers to train MOT and counting algorithms and evaluate generalization performance at unseen test locations. We perform extensive baseline experiments and identify key challenges and opportunities for advancing the state of the art in generalization in MOT and counting.
Keywords:
Detection, Tracking, Counting, Video Dataset1 Introduction
Diverse and high-quality datasets collected from the natural world have enabled progress on fundamental computer vision tasks such as fine-grained visual categorization [127, 128, 96, 78, 126, 120, 9, 10, 12] and individual re-identification [100, 58, 80]. This progress has had valuable impact in the same natural-world domains, and automated visual systems are now used in the field every day by ecologists, citizen scientists, and conservationists to improve the accuracy and efficiency of biodiversity monitoring efforts around the globe [125, 126, 77, 13, 1, 44]. However, the range of computer vision tasks that these systems can perform is still limited, with most current algorithms and their supporting datasets focusing largely on visual classification in relatively high-quality imagery. Methods developed for existing datasets can fail to transfer to tasks where video analysis or non-RGB imagery is involved.
We present the Caltech Fish Counting Dataset (CFC), a large video dataset containing over half a million annotations for detecting, tracking, and counting migrating fish in sonar video. In addition to providing a challenging benchmark in a novel application domain, the dataset allows for detailed study in three areas that have received limited attention from the computer vision community and lack supporting benchmarks:
1. Multiple-object tracking (MOT) in natural environments with animal targets. Most existing MOT datasets focus on human [79, 90, 35] and vehicle [133, 48, 119, 142] tracking in cities. Animal targets provide a rich source of variability for developing trackers that are not biased toward urban domains, in addition to having numerous beneficial applications in conservation [125], neuroscience [88], and animal husbandry [45]. Furthermore, many state-of-the-art methods make extensive use of visual re-identification for performing association [148, 104, 136]. In contrast, CFC provides a benchmark sourced from low signal-to-noise recording equipment in challenging natural-world environments where tracking targets are difficult to resolve from background clutter and each other, making frame-to-frame visual association less effective.
The dataset is large, well-annotated, and challenging. It consists of 1,567 video sequences sourced from seven different sonar cameras on three rivers located in the U.S. states of Alaska and Washington. The videos are single-channel (i.e. grayscale), vary in resolution from 288x624 to 1,086x2,125, have frame rates between 6.7 and 13.3 frames per second, and are an average of 336 frames (38 seconds) in duration. Tracking annotations were collected through a paid annotation service for 8,254 fish across 527k frames, totaling 516k bounding boxes in 16.7 hours of video.
2. Video-based counting. Existing video counting benchmarks focus on crowd counting in urban environments [134, 41, 26, 27, 135, 41] and emphasize density estimation over trajectory-based counting. Methods developed for these datasets have limitations in applications where information about individuals, such as size or direction of motion, is required, since crowd density is largely treated as a regional feature [111]. The community is in need of a benchmark which can support both tracking and counting concurrently. CFC provides both a challenging MOT benchmark and an evaluation protocol for video-based counting that is motivated by a real-world metric. Ground-truth detections, trajectories, and counts are provided for every video sequence.
3. Generalization of tracking and counting methods to new domains. While generalization in computer vision has been extensively studied in object recognition [31, 154, 74, 10], it is still relatively understudied within MOT and counting. CFC presents significant generalization challenges that are highlighted by the dataset design, providing a strong benchmark for the study of generalization and efficient adaptation in the context of MOT and counting. We enable this study by constraining training data to a single camera location, while sourcing test data from a variety of different out-of-sample rivers and cameras.
Finally, CFC is the first annotated video dataset sourced from the domain of fish counting in sonar, an application area with significant impacts in conservation ecology. Salmon are keystone species that support at least 137 other animal species and provide food and nutrients to a wide range of ecosystems during their seasonal migration [47]. Sonar imaging provides a non-invasive way to monitor escapement—the number of salmon returning home each season to spawn—helping inform sustainable fisheries management. Automation using computer vision could enable current sonar-based monitoring programs to scale from a few locations to entire watersheds. We hope that our dataset will encourage computer vision researchers to work on this high-impact challenge.
Our contributions are: (1) a large and challenging dataset for tracking and counting in video that enables the study of generalizing algorithms to new locations; (2) an evaluation protocol that mimics the procedure used by field technicians when manually counting fish in sonar video; (3) a baseline method that utilizes a novel input structure to improve generalization performance at unseen test locations. The dataset and evaluation code are available here.
2 Related Work
| Dataset | Vids | Frames | Annos | Animals | Detect | Track | Count |
| 3D-ZeF [101] | 8 | 28,800 | 86,400 | ✓(100%) | ✓ | ✓ | |
| BIRDSAI [20] | 48 | 62,400 | 154,000 | ✓(78%) | ✓ | ✓ | |
| GMOT-40 [7] | 40 | 9,643 | 256,341 | ✓(38%) | ✓ | ||
| MOT16 [90] | 14 | 11,235 | 292,733 | ✓ | ✓ | ||
| MOT20 [35] | 8 | 13,410 | 1.65M | ✓ | ✓ | ||
| UA-DETRAC [133] | 100 | 140,000 | 1.21M | ✓ | ✓ | ||
| TAO [34] | 2,907 | 4.44M | 332,401 | ✓(10%) | ✓ | ✓ | |
| AnimalDrone [156] | 162 | 53,644 | 4.05M* | ✓(100%) | ✓ | ||
| DroneCrowd [135] | 112 | 33,600 | 4.86M* | ✓ | ✓ | ||
| Crossing-line [151] | 5 | 3,100 | 5,900* | ✓ | ✓ | ||
| FDST [41] | 100 | 15,000 | 394,081* | ✓ | |||
| Iowa DOT [95] | 200 | 90,000 | 0 | ✓ | |||
| Mall [28] | 1 | 2,000 | 62,315* | ✓ | |||
| UCSD [26] | 1 | 2,000 | 49,885* | ✓ | |||
| WorldExpo [143] | 1,132 | 3,980 | 199,923* | ✓ | |||
| CFC | 1,567 | 527,215 | 515,933 | ✓(100%) | ✓ | ✓ | ✓ |
Multiple-Object Tracking (MOT). Several popular benchmarks have supported recent progress in MOT, particularly in the domains of pedestrian and vehicle tracking [79, 90, 35, 133, 48, 142, 119]. Large-scale benchmarks for tracking animals in the wild are less common. TAO [34] and GMOT-20 [7] focus on tracking all foreground objects with limited class information, and include some animal tracking sequences. The BIRDSAI [20] dataset focuses on human and animal tracking in the wild, and—similar to ours—contains non-RGB (in their case, thermal infrared) sequences, though it is sourced from moving aerial cameras rather than in-situ monitoring devices. With over half a million MOT annotations, the CFC dataset is larger than existing benchmarks for animal tracking in the wild, with a unique additional focus on video-based counting and generalization challenges. See Tab. 1 for a comparison with prior work.
Recent advancements in object detection [62, 157] have helped popularize the tracking-by-detection paradigm in MOT, which divides the tracking problem into two steps: (1) an object detector predicts object locations (e.g. bounding boxes) in each frame, and (2) a tracker associates detections over time into object trajectories. While there has been significant progress in recent years (see recent surveys [30, 84]), there are two notable shortcomings. First, the tracking-by-detection paradigm implicitly assumes that detection is possible and accurate in each frame. This is not universally valid, and our dataset can stimulate research in algorithms that do not rely on this assumption due to the difficulty in resolving fish locations frame-to-frame. Second, much recent progress can be attributed to the development of complex visual-feature representations for target re-identification. These techniques are often domain-specific according to the benchmark dataset. For example, [153] use a generative model to create synthetic pedestrian data consisting of various combinations of person appearance and structure information to achieve state-of-the-art performance, a technique that has been adopted by other top-performing MOT methods [60]. Our dataset introduces a challenging MOT benchmark in which individuals are visually indistinct, offering little opportunity to make use of visual features for individual re-identification, which can motivate the development of tracking methods that are not dependent upon complex appearance matching.
Counting in Video. Datasets for object counting are predominantly image-based [149, 143, 144, 63, 61, 130, 4, 138, 49, 105, 70, 113, 132, 23, 8, 97, 66]. Video-based counting datasets are more limited. Most are focused on estimating the number of people [134, 41, 26, 27, 135, 41] or animals [156] in crowded scenes, combining the challenges of crowd-density estimation and camera motion compensation. While a limited number of video counting datasets incorporate trajectory information [135, 151], existing benchmarks primarily model object locations as points and do not contain bounding box labels. CFC supports the study of all three tasks (detection, tracking, and counting), while containing over five times the number of annotated video frames as existing video counting benchmarks (see Tab. 1).
Methods for video-based counting can be roughly divided into regression-based methods, density-based methods, and detection-based methods. Regression-based methods attempt to predict counts directly by mapping image features to counting numbers [91, 68], while density-based methods predict per-pixel crowd density in each frame and then analyze densities over time to obtain counts [4, 149, 151, 98, 145]. These methods are typically designed for counting large numbers of densely clustered objects where individual object detection is challenging. In contrast, detection-based methods utilize object detection in each frame to localize objects of interest and count them over time. These approaches typically employ a tracking-by-detection pipeline followed by counting based on either region-of-interest (ROI) [86, 25] or line-of-interest (LOI) [73, 85, 151]. ROI-based methods attempt to estimate the number of objects passing through a subregion of the frame, such as a traffic lane or onramp in the case of vehicle counting [25]. LOI-based methods instead draw a virtual line through the field of view, counting objects when their trajectories intersect this line. In this work we use LOI-based counting, as it matches the approach currently used by fishery managers for counting fish in sonar [71].
Animal-Centric Datasets. Existing computer vision datasets in animal ecology primarily target the tasks of species classification [127, 128, 96, 126, 120, 9, 12], detection [10, 9, 120, 66, 122, 99, 141, 150, 2, 121, 21, 110, 32, 36, 6, 106, 117], and individual identification [100, 58, 80]. These datasets consist predominantly of RGB imagery where visual features are key signals for recognition; in contrast, our dataset consists of single-channel sonar video, in which the animals of interest are difficult to distinguish from background, debris, and each other.
For this reason CFC shares some characteristics with video datasets for studying animal behavior, including mice [5, 18, 3, 59, 51, 50, 118], rats [33], flies [39, 38], bees [87, 17, 108, 22], and fish [155, 101, 24]. As in our dataset, the visual similarities between individuals in these datasets mean that tracking must rely heavily on prediction of motion or behavior rather than using visual features for association. Our work, however, entails additional challenges not typically present in laboratory tracking and behavior study, such as complex background, difficult frame-by-frame detection, and unknown numbers of individuals in a scene.
Generalization in Computer Vision. Domain generalization is a type of domain shift—i.e. a difference in training and test data distributions—in which training and test data come from distinct, but related, domains. For example, in our dataset the domain generalization challenge comes from training and test data sourced from distinct sonar camera deployments on different rivers. Crucially, as opposed to domain adaptation, in which data from the test domain is available during model training, in domain generalization data from the test domain is considered inaccessible [93, 16, 124]. Within computer vision this has been most extensively studied for the task of object recognition [31, 154, 53, 140], with a number of supporting datasets [40, 74, 10, 109]. While there has been some study of domain generalization in other computer vision tasks such as semantic segmentation [57, 29, 146] and action recognition [115, 131, 76], it has been relatively understudied in the context of MOT and counting. Some MOT and counting datasets do represent domain generalization challenges in their test sets—for example, in MOT20 [35] one of the three test locations is from a new location, and in UA-DETRAC [133] (MOT) and WorldExpo [143] (crowd counting) all test data is from different locations than training data. Our dataset makes it possible to evaluate generalization for both MOT and video-based counting concurrently, while providing more out-of-distribution test videos than existing options.
Imaging Sonar. Only a very limited amount of annotated sonar imaging data has been released. [89] collected 524 sonar video clips with video-level species labels, [112] collected a small dataset of 143 sonar images to test image-level classification of fish and dolphin species, and [82] collected dot annotations for counting fish in 537 sonar images. Our work is the first to release detection and tracking annotations for fish in sonar, and it is several orders of magnitude larger than existing sonar datasets.
3 Dataset
Here we describe how we collected, annotated, and split CFC, and give an overview of common challenges.
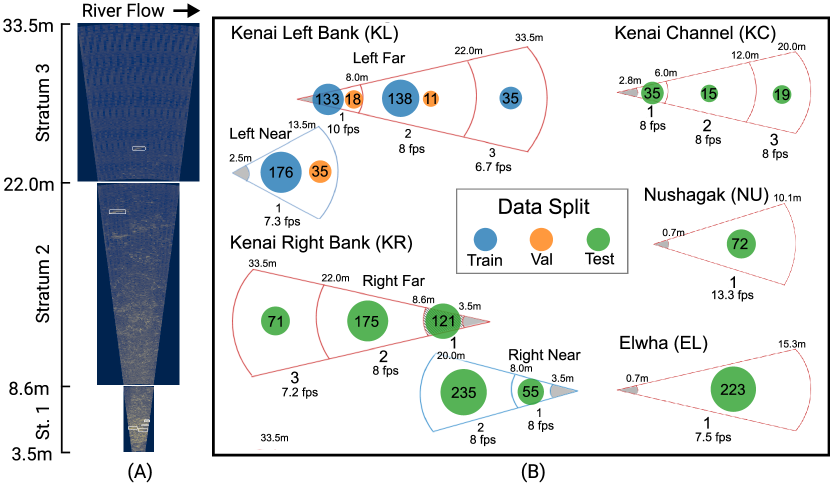
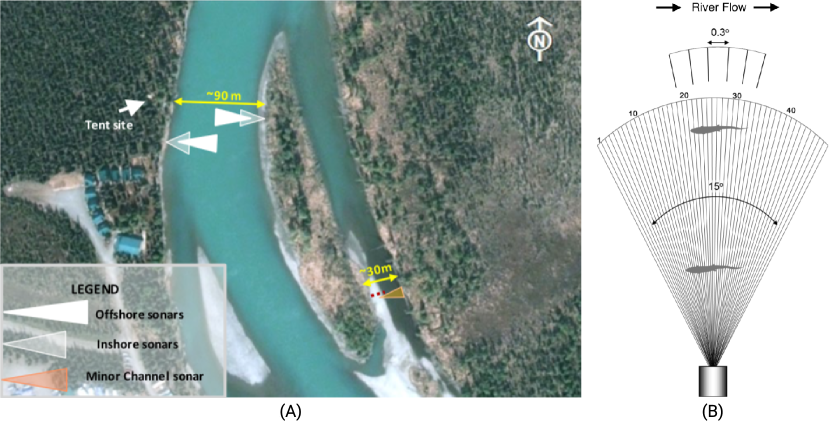
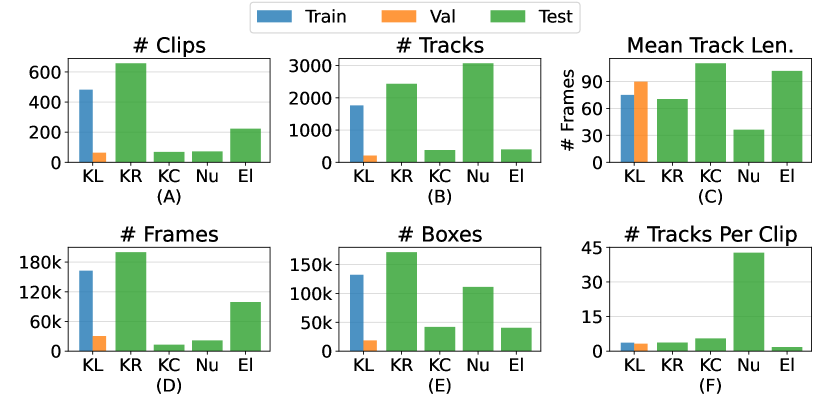
Data Collection. The dataset was curated from 2,056 hours of sonar video obtained from the Alaska Department of Fish and Game, the U.S. National Marine Fisheries Service, the U.S. National Park Service, and the Lower Elwha Klallam Tribe. It contains video from five distinct locations which we use to study out-of-sample performance: three locations on the Kenai River in Alaska, which we refer to as KL (Kenai Left Bank), KR (Kenai Right Bank), and KC (Kenai Channel); one location, NU, on the Nushagak River in Alaska; and one location, EL, on the Elwha River in Washington (sonar configurations shown in Fig. 1).
The data had already been analyzed by experts (“manually marked”) to obtain fish counts. Most of the video contained no fish. Since our focus is on detection, tracking, and counting, we used the manual markings to extract shorter 200–300 frame video clips known to contain fish. If any of these clips overlapped, we merged them into one longer clip. In total we extracted 1,233 clips from the Kenai River, containing 4,300 fish; 262 clips from the Elwha River, containing 884 fish; and 72 clips from the Nushagak River, containing 3,070 fish.
Annotation. We hired a third-party annotation service to collect multiple-object tracking annotations for all fish in the extracted clips. Annotators were provided with the raw video clips and instructed to box all visible fish tightly using the vatic.js GUI [19]. For any stationary fish, they were required to annotate every fifth frame, and we interpolated between those annotations in the intermediate frames; for all other tracks, all bounding boxes in all frames were annotated manually. The annotation service had their own internal quality-management procedures whereby multiple annotators inspected each clip before it was finalized. In total, 515,933 bounding boxes for 8,254 fish tracks were collected in 527,215 frames from seven different cameras.
Data Split. We designed a dataset splitting protocol that allows us to study generalization to new locations, a known challenge for current computer vision methods [75, 10]. Our test data comes from deployment locations never seen during training or validation. We chose KL as our training and validation location due to its sufficient size for model training. Data from this location spans 16 days in total. We selected one of these days at random to hold out as a validation set, and the other 15 days serve as our training set. This gives us 162,680 training images containing 1,762 tracks and 132,220 bounding boxes, and 30,518 validation images containing 207 tracks and 18,565 bounding boxes.
The other locations (KR, KC, NU, and EL) serve as test sets for evaluating generalization performance under different conditions. These locations cover a range of generalization scenarios that may be faced in the real world: KR includes a new camera deployment on the same body of water; KC includes a new deployment in a nearby, but separate, body of water; NU and EL include deployments on new rivers in different geographic regions with different species distributions. The data split is illustrated in Fig. 1. In total the dataset contains 334,017 test images with 6,285 tracks and 365,148 bounding boxes. For all experiments we report results on all test locations individually.
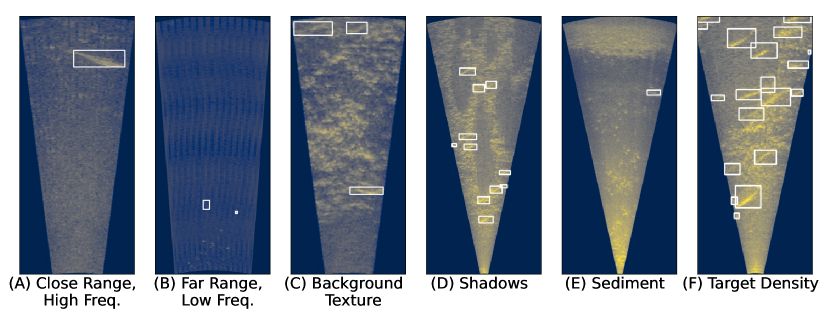
Challenges. We have identified a number of challenges inherent to detecting and tracking fish using sonar, which we have illustrated in Fig. 2. Some of these challenges are constant across all data in this domain (e.g. speckle noise and shadows), while some vary across locations due to hardware settings or environmental factors, presenting generalization challenges (e.g. presence of sediment, riverbed shape and texture, and hardware operating frequency). More details on the causes of these challenges can be found in the supplemental material.
4 Metrics
4.1 Counting Protocol
We follow the counting procedure used by field technicians when counting fish in sonar video [71]. A vertical line-of-interest (LOI) is drawn in the middle of the frame, and a fish is considered to have moved left or right if its trajectory start and end positions are on different sides of the LOI. Note that not every fish in a clip will cross the LOI. Some fish are stationary throughout the entire clip, while others enter and exit on the same side of the frame without crossing the LOI. These fish are excluded from the count totals, which matches the protocol used by the field technicians.
4.2 Counting Metric
In the target application, fish-counting error is measured as the sum of upstream and downstream counting errors, and error is normalized separately at each river to account for variations in fish abundance. We classify direction of movement as “left” or “right” rather than “upstream” or “downstream” to make our system agnostic to the orientation of the camera. Based on this we define the absolute counting error for the th video clip, , as the sum of the absolute left and right (i.e. upstream and downstream) counting errors:
| (1) |
where and are the predicted and ground-truth counts for clip , respectively. Overall counting error is reported as normalized Mean Absolute Error (nMAE):
| (2) |
where is the number of video clips at a given location and is the ground-truth count for clip .
We choose a metric that is normalized per location, giving equal weight to each fish at a given location regardless of variance in fish density across clips at that location. We do this because video clips in CFC are arbitrarily generated and are much shorter in duration than videos in the target application, thus per-clip normalization—i.e. giving equal weight to each clip—would not be appropriate. We consider this the main metric for the dataset, since it is the most important in the target application. Achieving at most 10% counting error on a river would make an algorithm on par with human experts and feasible for augmenting counting in the field [71].
4.3 Detection and Tracking Metrics
In addition to counting, CFC has been annotated to measure detection and tracking performance as well. For our detection metric we choose the PascalVOC [37] evaluation of mean Average Precision with IoU (AP50). For tracking, we report the CLEAR [14], IDF1 [107], and HOTA [83] metrics.
The CLEAR MOT metrics [14] are computed per-frame by matching detections from predicted tracks with ground-truth detections. This matching allows the number of true positive (), false positive (), and false negative () detections to be computed using an IoU threshold between predicted and ground-truth boxes. Recall (CLR_Re) and precision (CLR_Pr) are defined as normal according to the number of TPs, FPs, and FNs, and Multiple Object Tracking Accuracy (MOTA) is defined as:
| (3) |
Where is the sum of all “ID switches”, i.e. the number of times a predicted track changes its matched ground-truth track and vice versa. In practice, and MOTA becomes predominantly a measure of detection quality in the tracks. Since this scoring occurs per-frame, MOTA does not capture long-term tracking performance.
In contrast, IDF1 [107] first computes a global (per-video-clip) track matching, i.e. a bipartite matching between all ground-truth and predicted tracks. From this matching, ID true positives (), false positives (), and false negatives () are computed, and the IDF1 score is defined as the harmonic mean of ID Precision (IDP) and ID Recall (IDR):
| (4) |
Since this matching is restricted to be static for the length of the clip, IDF1 is a measure of long-term tracking performance.
HOTA [83] is designed to measure both short-term and long-term tracking performance. It is the geometric mean of a detection score (DetA) and an association score (AssA), each defined as the Jaccard index of detection/association TPs, FPs, and FNs. Thus it can be easily decomposed into detection/association precision and recall (DetRe and DetPr, and AssRe and AssPr, respectively). In this formulation, AssRe is inversely correlated with the number of track splits, while AssPr is inversely correlated with the number of track merges.
5 Experiments
We evaluate state-of-the-art methods on CFC to provide a baseline for future work and give insight into the generalization challenges of object detection, multiple-object tracking, and counting. In Sec. 5.1 we propose a tracking-by-detection approach to fish counting which allows us to evaluate each of these tasks, and study its performance. In Sec. 5.2 we perform ablation studies and investigate the upper bounds of this approach and its generalization capabilities. In Sec. 5.3 we introduce an improved baseline method to address these challenges, establish the state of the art on CFC, and discuss remaining challenges.
5.1 Baseline
Our baseline method uses the YOLOv5 [65] object detector and SORT [15] tracker. Trajectories are then analyzed as described in Sec. 4.1 to predict counts.
We chose YOLOv5 after an initial architecture search. These experiments as well as training settings are included in the supplemental material. We chose SORT because it has shown to be a popular and robust tracker across a range of applications, recently achieving state-of-the-art performance on several MOT datasets with minor modifications [147]. It performs tracking using a motion model based on the Kalman filter [67] without using appearance information for association. We verified our hypothesis that appearance features are not a strong signal for association in CFC by training a visual re-identification model that performed poorly on our validation set. More details of this experiment are provided in the supplemental material. See Figs. 3 and 4 for our performance on the various locations with this baseline method. A tabular version of these results is included in the supplemental material.
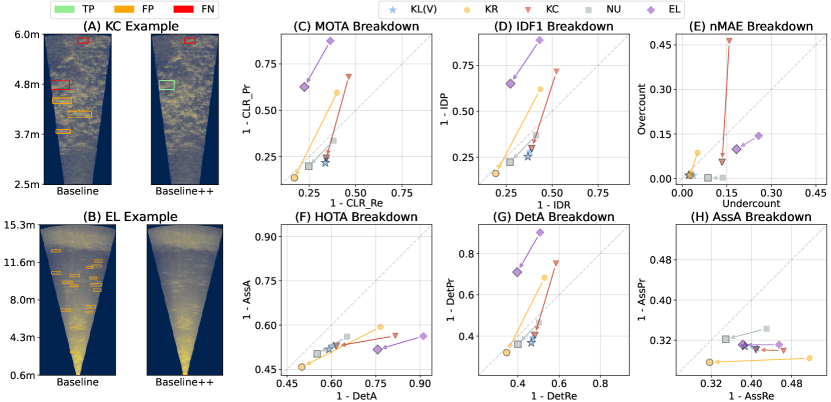
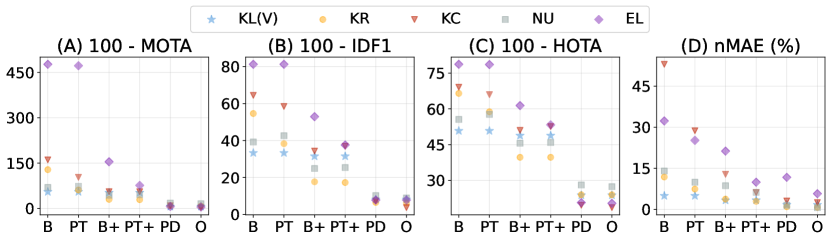
Analysis. Our baseline method performs on par with human experts at the location where it is trained, with a validation counting error of less than 5%. Counting generalization performance is best at KR, which matches intuition given that this data is sourced from a nearby location to the training set (KL). However, generalization performance at the other locations is quite poor. We examine the two most challenging locations, KC (53% nMAE) and EL (32.3% nMAE), in Fig. 4. At KC, false positive (FP) and false negative (FN) detections are caused by the presence of complex background information (Fig. 4A), while at EL the errors are overwhelmingly FPs caused by sediment and other noise resulting from the camera’s very large range window (Fig. 4B).
We can see the direct impact of these detection errors on our tracking and counting metrics in Fig. 4C–H. At both locations, we see that abundant FPs cause very low CLR Precision (Fig. 4C), ID Precision (Fig. 4D), and Detection Precision (Fig. 4G), negatively impacting MOTA, IDF1, and HOTA, respectively. Interestingly, while FPs cause overcounting errors at KC, the majority of counting errors at EL are actually due to undercounting (Fig. 4E). From manual inspection we diagnosed that this is often caused by TP tracks merging with hallucinated detections, causing the loss of a track before it has the chance to cross the counting line. These challenges demonstrate why counting, in addition to detection and tracking, is an important metric for researchers to consider.
Our baseline results indicate that (1) there are indeed generalization challenges in this domain, (2) they appear to be largely caused by location-specific environmental changes, and (3) these challenges affect all three tasks of interest: detection, tracking, and counting. Further, the low counting error on the validation set indicates that our overall tracking-by-detection approach is feasible at in-distribution locations and that the key challenges are in generalization. To verify this, in the next section we perform ablation studies and examine the upper-bound generalization capabilities of the proposed tracking-by-detection baseline, and use these results to motivate an improved baseline in Sec. 5.3.
5.2 Ablation Study and Generalization Upper Bounds
To evaluate generalization potential, we perform a set of “reversed” ablation studies and compare our baseline results with three different upper bounds that utilize different types of ground-truth information (Fig. 5):
1. Perfect Tracker Generalization. We use the detections from our baseline detector, but we fit the tracker hyperparameters directly to each test set based on counting performance. This results in five different trackers, one for each test set, with the best possible tracker parameter settings at each location. This gives an upper bound for the counting performance of a multiple-object tracker which can perfectly generalize to new locations.
2. Perfect Detector. This model takes ground-truth detections as input. The tracker hyperparameters are fit to counting performance on the validation set as in our baseline. This gives an upper bound for the counting performance of our tracker when given perfect detections.
3. Oracle. This model combines the first two upper bounds. It takes ground-truth detections as input and fits the tracker hyperparameters to each test set. This gives us the overall upper bound on counting performance for our baseline approach given perfect detections and perfect tracker generalization.
Analysis. The most apparent result is the very strong performance at all locations given a Perfect Detector. In most cases, with perfect detections our tracker achieves near-Oracle performance and generalizes well without modification. Only one location (EL) shows significant further improvements in counting error in the Oracle method compared to the Perfect Detector method. Meanwhile, Perfect Tracker Generalization does improve performance in most cases, but not as much as the Perfect Detector. This indicates that the proposed motion-based tracking approach is indeed feasible but is dependent upon a strong detector with strong generalization capabilities. Therefore the most effective improvement to overall system-generalization performance appears to be improving the generalization capabilities of the detector, which we address in the next section.
5.3 Baseline++
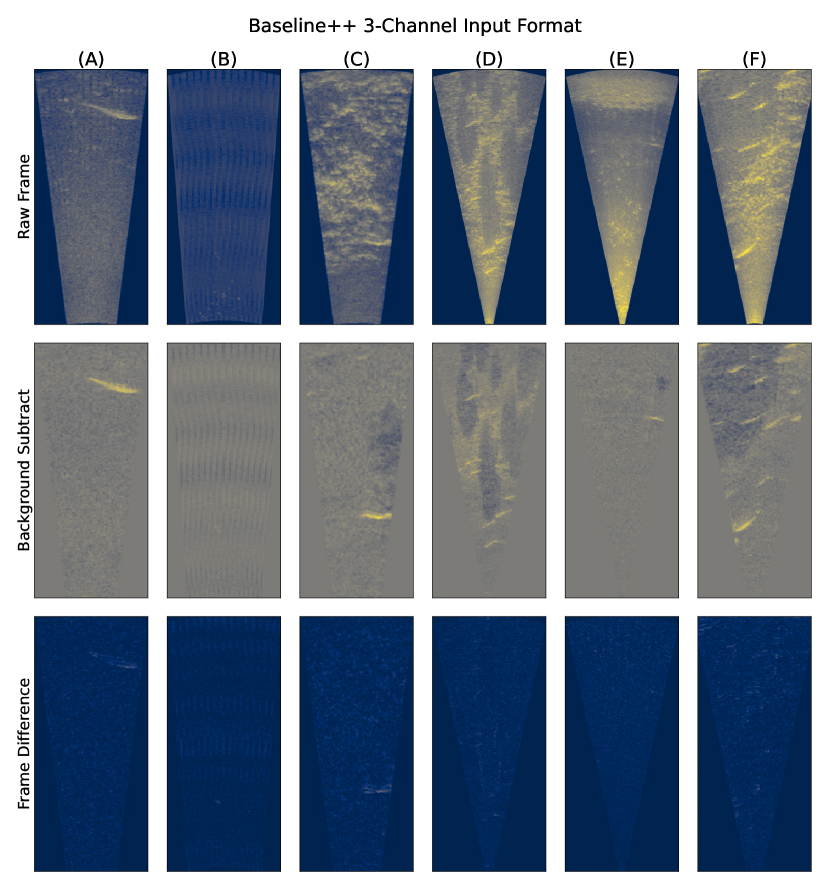
Given the results from our upper bound analysis, we implemented an improved baseline method, “Baseline++,” with the primary goal of improving object-detection generalization performance. We noticed that the background (1) varies significantly across locations and (2) occludes fish (see Fig. 2 for frame examples). Thus, we appended two additional channels to our image input: (1) a background-subtracted version of each frame, where the background for each clip is obtained by averaging all frames, and (2) the difference between each background-subtracted frame and its preceding frame, to capture motion information. Example frames illustrating these transformations are included in the supplemental material. We trained a new detector and tracker with this input in the same way as the baseline model. Results are shown in Figs. 3, 4, and 5.
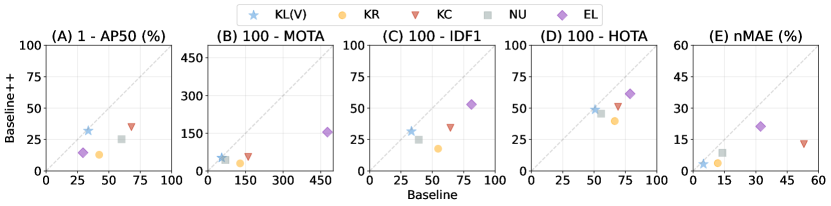
Analysis. In Fig. 3, we see that our Baseline++ method leads to modest improvements on our validation set (+1.6 AP50, -1.7% nMAE), but significant improvements in generalization performance (e.g. -40.2% nMAE at KC). In Fig. 4, we dissect these improvements by looking at: (A)–(B) two example frames from KC and EL, and (C)–(H) breakdowns of tracking and counting metrics across all locations. We see the efficacy of simple background subtraction as a generalization mechanism, helping significantly reduce the number of FPs and FNs in the example KC and EL frames as well as at all test locations. We also see evidence of some outstanding issues: one FN remains in the KC example due to a small, stationary fish that appears to have been removed by the background-subtraction routine, and one FP remains in the EL example due to noise near the transducer. IDR now lags behind IDP at all locations except for EL, indicating that most remaining tracking problems are track splits causing undercounting errors. These trends are also indicated in the HOTA decompositions (Fig. 4F–H), which show that DetRe now lags behind DetPr at all locations except EL, and while AssRe has improved (i.e. track splits have been reduced), it is still lower than AssPr.
6 Conclusions
We present the Caltech Fish Counting Dataset, a natural-world sonar video dataset that allows us to study object detection, multiple-object tracking, and counting under challenging real-world domain shifts. Due to the visual qualities of the source domain of river-based sonar, the dataset poses challenges to existing methods developed primarily for urban environments and provides a benchmark for video-based counting in the wild, a task that lacks supporting benchmarks.
Our experiments show that there is still significant room for improvement in the generalization performance of tracking and counting algorithms. There are also opportunities to improve tracker generalization and making trackers more robust to noisy detections. Robust algorithms that work across the range of generalization challenges in CFC will certainly be impactful in other domains, and we hope that our dataset will provide a useful testing ground for the computer vision community to push forward progress on these tasks. High-performing methods would enable sonar-based fish counting to scale globally and have real-world impact in managing some of the world’s most sensitive and valuable ecosystems.
In the future, the dataset will be expanded to include additional input formats, locations, and species. One additional path forward for the community is to explore the impact of utilizing unlabeled data for unsupervised domain adaptation or self-supervised pretraining on unseen locations, which we plan to make possible by releasing additional unlabeled data from all test locations.
Acknowledgements. We are grateful to AWS for a gift to Trout Unlimited (TU) that supported data annotations, computational and storage costs, and to the Resnick Sustainability Institute at Caltech for funding to SB and PP. An NSF Fellowship supported SB. JK, SD, and EY volunteered their time. GVH was supported by the Macaulay Library at Cornell University. For collecting the dataset, and for feedback, encouragement, and moral support, we are grateful to: George Pess and Oleksandr Stefankiv (Northwest Fisheries Science Center); James Miller, Carl Pfisterer, Dawn Wilburn, Brandon Key, Suzanne Maxwell, Gregory Buck, April Faulkner, and Jordan Head (Alaska Department of Fish and Game); Dave Kajtaniak and Michael Sparkman (California Department of Fish and Wildlife); Dean Finnerty (TU’s Wild Steelhead Project); and Keith Denton, Mike McHenry, and the Lower Elwha Klallam Tribe.
References
- [1] Ahumada, J.A., Fegraus, E., Birch, T., Flores, N., Kays, R., O’Brien, T.G., Palmer, J., Schuttler, S., Zhao, J.Y., Jetz, W., et al.: Wildlife insights: A platform to maximize the potential of camera trap and other passive sensor wildlife data for the planet. Environmental Conservation 47(1), 1–6 (2020)
- [2] Anton, V., Hartley, S., Geldenhuis, A., Wittmer, H.U.: Monitoring the mammalian fauna of urban areas using remote cameras and citizen science. Journal of Urban Ecology 4(1), juy002 (2018)
- [3] Arac, A., Zhao, P., Dobkin, B.H., Carmichael, S.T., Golshani, P.: Deepbehavior: A deep learning toolbox for automated analysis of animal and human behavior imaging data. Frontiers in systems neuroscience 13, 20 (2019)
- [4] Arteta, C., Lempitsky, V., Zisserman, A.: Counting in the wild. In: European conference on computer vision. pp. 483–498. Springer (2016)
- [5] Austin, C.P., Battey, J.F., Bradley, A., Bucan, M., Capecchi, M., Collins, F.S., Dove, W.F., Duyk, G., Dymecki, S., Eppig, J.T., et al.: The knockout mouse project. Nature genetics 36(9), 921 (2004)
- [6] Australian Institute of Marine Science (AIMS) and University of Western Australia (UWA) and Curtin University: Ozfish dataset - machine learning dataset for baited remote underwater video stations (2019)
- [7] Bai, H., Cheng, W., Chu, P., Liu, J., Zhang, K., Ling, H.: Gmot-40: A benchmark for generic multiple object tracking. In: Proceedings of the IEEE/CVF Conference on Computer Vision and Pattern Recognition. pp. 6719–6728 (2021)
- [8] Beery, S., Agarwal, A., Cole, E., Birodkar, V.: The iwildcam 2021 competition dataset. arXiv preprint arXiv:2105.03494 (2021)
- [9] Beery, S., Van Horn, G., Mac Aodha, O., Perona, P.: The iwildcam 2018 challenge dataset. arXiv preprint arXiv:1904.05986 (2019)
- [10] Beery, S., Van Horn, G., Perona, P.: Recognition in terra incognita. In: Proceedings of the European conference on computer vision (ECCV). pp. 456–473 (2018)
- [11] Belcher, E., Hanot, W., Burch, J.: Dual-frequency identification sonar (didson). In: Proceedings of the 2002 interntional symposium on underwater technology (Cat. No. 02EX556). pp. 187–192. IEEE (2002)
- [12] Berg, T., Liu, J., Woo Lee, S., Alexander, M.L., Jacobs, D.W., Belhumeur, P.N.: Birdsnap: Large-scale fine-grained visual categorization of birds. In: Proceedings of the IEEE Conference on Computer Vision and Pattern Recognition. pp. 2011–2018 (2014)
- [13] Berger-Wolf, T.Y., Rubenstein, D.I., Stewart, C.V., Holmberg, J.A., Parham, J., Menon, S., Crall, J., Van Oast, J., Kiciman, E., Joppa, L.: Wildbook: Crowdsourcing, computer vision, and data science for conservation. arXiv preprint arXiv:1710.08880 (2017)
- [14] Bernardin, K., Stiefelhagen, R.: Evaluating multiple object tracking performance: the clear mot metrics. EURASIP Journal on Image and Video Processing 2008, 1–10 (2008)
- [15] Bewley, A., Ge, Z., Ott, L., Ramos, F., Upcroft, B.: Simple online and realtime tracking. In: 2016 IEEE international conference on image processing (ICIP). pp. 3464–3468. IEEE (2016)
- [16] Blanchard, G., Lee, G., Scott, C.: Generalizing from several related classification tasks to a new unlabeled sample. Advances in neural information processing systems 24 (2011)
- [17] Boenisch, F., Rosemann, B., Wild, B., Dormagen, D., Wario, F., Landgraf, T.: Tracking all members of a honey bee colony over their lifetime using learned models of correspondence. Frontiers in Robotics and AI 5, 35 (2018)
- [18] Bogue, M.A., Philip, V.M., Walton, D.O., Grubb, S.C., Dunn, M.H., Kolishovski, G., Emerson, J., Mukherjee, G., Stearns, T., He, H., et al.: Mouse phenome database: a data repository and analysis suite for curated primary mouse phenotype data. Nucleic acids research 48(D1), D716–D723 (2020)
- [19] Bolkensteyn, D.: dbolkensteyn/vatic.js (May 2020), https://github.com/dbolkensteyn/vatic.js, original-date: 2016-11-23T12:39:07Z
- [20] Bondi, E., Jain, R., Aggrawal, P., Anand, S., Hannaford, R., Kapoor, A., Piavis, J., Shah, S., Joppa, L., Dilkina, B., Tambe, M.: Birdsai: A dataset for detection and tracking in aerial thermal infrared videos. In: WACV (2020)
- [21] Boom, B.J., He, J., Palazzo, S., Huang, P.X., Beyan, C., Chou, H.M., Lin, F.P., Spampinato, C., Fisher, R.B.: A research tool for long-term and continuous analysis of fish assemblage in coral-reefs using underwater camera footage. Ecological Informatics 23, 83–97 (2014)
- [22] Bozek, K., Hebert, L., Mikheyev, A.S., Stephens, G.J.: Towards dense object tracking in a 2d honeybee hive. In: Proceedings of the IEEE Conference on Computer Vision and Pattern Recognition. pp. 4185–4193 (2018)
- [23] Brandt, M., Tucker, C., Kariryaa, A., Rasmussen, K., Abel, C., Small, J., Chave, J., Rasmussen, L., Hiernaux, P., Diouf, A., Kergoat, L., Mertz, O., Igel, C., Gieseke, F., Schöning, J., Li, S., Melocik, K., Meyer, J., Sinno, S., Romero, E., Glennie, E., Montagu, A., Dendoncker, M., Fensholt, R.: An unexpectedly large count of trees in the west african sahara and sahel (2020). https://doi.org/10.3334/ORNLDAAC/1832
- [24] Bruslund Haurum, J., Karpova, A., Pedersen, M., Hein Bengtson, S., Moeslund, T.B.: Re-identification of zebrafish using metric learning. In: Proceedings of the IEEE/CVF Winter Conference on Applications of Computer Vision Workshops. pp. 1–11 (2020)
- [25] Bui, N., Yi, H., Cho, J.: A vehicle counts by class framework using distinguished regions tracking at multiple intersections. In: Proceedings of the IEEE/CVF Conference on Computer Vision and Pattern Recognition Workshops. pp. 578–579 (2020)
- [26] Chan, A.B., Liang, Z.S.J., Vasconcelos, N.: Privacy preserving crowd monitoring: Counting people without people models or tracking. In: 2008 IEEE conference on computer vision and pattern recognition. pp. 1–7. IEEE (2008)
- [27] Change Loy, C., Gong, S., Xiang, T.: From semi-supervised to transfer counting of crowds. In: Proceedings of the IEEE International Conference on Computer Vision. pp. 2256–2263 (2013)
- [28] Chen, K., Loy, C.C., Gong, S., Xiang, T.: Feature mining for localised crowd counting. In: Bmvc. vol. 1, p. 3 (2012)
- [29] Chen, Y., Li, W., Gool, L.V.: Road: Reality oriented adaptation for semantic segmentation of urban scenes. In: 2018 IEEE/CVF Conference on Computer Vision and Pattern Recognition. pp. 7892–7901 (2018)
- [30] Ciaparrone, G., Sánchez, F.L., Tabik, S., Troiano, L., Tagliaferri, R., Herrera, F.: Deep learning in video multi-object tracking: A survey. Neurocomputing 381, 61–88 (2020)
- [31] Csurka, G.: Domain adaptation for visual applications: A comprehensive survey. arXiv preprint arXiv:1702.05374 (2017)
- [32] Cutter, G., Stierhoff, K., Zeng, J.: Automated detection of rockfish in unconstrained underwater videos using haar cascades and a new image dataset: labeled fishes in the wild. In: 2015 IEEE Winter Applications and Computer Vision Workshops. pp. 57–62. IEEE (2015)
- [33] van Dam, E.A., van der Harst, J.E., ter Braak, C.J., Tegelenbosch, R.A., Spruijt, B.M., Noldus, L.P.: An automated system for the recognition of various specific rat behaviours. Journal of neuroscience methods 218(2), 214–224 (2013)
- [34] Dave, A., Khurana, T., Tokmakov, P., Schmid, C., Ramanan, D.: Tao: A large-scale benchmark for tracking any object. In: European conference on computer vision. pp. 436–454. Springer (2020)
- [35] Dendorfer, P., Rezatofighi, H., Milan, A., Shi, J., Cremers, D., Reid, I., Roth, S., Schindler, K., Leal-Taixé, L.: Mot20: A benchmark for multi object tracking in crowded scenes. arXiv preprint arXiv:2003.09003 (2020)
- [36] Ditria, E.M., Connolly, R.M., Jinks, E.L., Lopez-Marcano, S.: Annotated video footage for automated identification and counting of fish in unconstrained seagrass habitats. Frontiers in Marine Science 8, 160 (2021)
- [37] Everingham, M., Van Gool, L., Williams, C.K., Winn, J., Zisserman, A.: The pascal visual object classes (voc) challenge. International journal of computer vision 88(2), 303–338 (2010)
- [38] Eyjolfsdottir, E., Branson, K., Yue, Y., Perona, P.: Learning recurrent representations for hierarchical behavior modeling. arXiv preprint arXiv:1611.00094 (2016)
- [39] Eyjolfsdottir, E., Branson, S., Burgos-Artizzu, X.P., Hoopfer, E.D., Schor, J., Anderson, D.J., Perona, P.: Detecting social actions of fruit flies. In: European Conference on Computer Vision. pp. 772–787. Springer (2014)
- [40] Fang, C., Xu, Y., Rockmore, D.N.: Unbiased metric learning: On the utilization of multiple datasets and web images for softening bias. In: Proceedings of the IEEE International Conference on Computer Vision. pp. 1657–1664 (2013)
- [41] Fang, Y., Zhan, B., Cai, W., Gao, S., Hu, B.: Locality-constrained spatial transformer network for video crowd counting. In: 2019 IEEE International Conference on Multimedia and Expo (ICME). pp. 814–819. IEEE (2019)
- [42] Farrell, A.P.: Encyclopedia of fish physiology: from genome to environment. Academic press (2011)
- [43] Faulkner, A.V., Maxwell, S.L.: The Feasibility of Using Sonar to Estimate Adult Sockeye Salmon Passage in the Lower Kvichak River. Alaska Department of Fish and Game, Division of Commercial Fisheries … (2015)
- [44] Fennell, M., Beirne, C., Burton, A.C.: Use of object detection in camera trap image identification: assessing a method to rapidly and accurately classify human and animal detections for research and application in recreation ecology. bioRxiv (2022). https://doi.org/10.1101/2022.01.14.476404, https://www.biorxiv.org/content/early/2022/01/21/2022.01.14.476404
- [45] Fernandes, A.F.A., Dórea, J.R.R., Rosa, G.J.d.M.: Image analysis and computer vision applications in animal sciences: an overview. Frontiers in Veterinary Science 7, 551269 (2020)
- [46] Fraik, A.K., McMillan, J.R., Liermann, M., Bennett, T., McHenry, M.L., McKinney, G.J., Wells, A.H., Winans, G., Kelley, J.L., Pess, G.R., et al.: The impacts of dam construction and removal on the genetics of recovering steelhead (oncorhynchus mykiss) populations across the elwha river watershed. Genes 12(1), 89 (2021)
- [47] G. Rahr: Why Protect Salmon, https://www.wildsalmoncenter.org/why-protect-salmon/
- [48] Geiger, A., Lenz, P., Urtasun, R.: Are we ready for autonomous driving? the kitti vision benchmark suite. In: 2012 IEEE conference on computer vision and pattern recognition. pp. 3354–3361. IEEE (2012)
- [49] Gemert, J.C.v., Verschoor, C.R., Mettes, P., Epema, K., Koh, L.P., Wich, S.: Nature conservation drones for automatic localization and counting of animals. In: European Conference on Computer Vision. pp. 255–270. Springer (2014)
- [50] Geuther, B.Q., Deats, S.P., Fox, K.J., Murray, S.A., Braun, R.E., White, J.K., Chesler, E.J., Lutz, C.M., Kumar, V.: Robust mouse tracking in complex environments using neural networks. Communications biology 2(1), 1–11 (2019)
- [51] Geuther, B.Q., Peer, A., He, H., Sabnis, G., Philip, V.M., Kumar, V.: Action detection using a neural network elucidates the genetics of mouse grooming behavior. Elife 10, e63207 (2021)
- [52] Grabek, J., Cyganek, B.: Speckle noise filtering in side-scan sonar images based on the tucker tensor decomposition. Sensors 19(13), 2903 (2019)
- [53] Gulrajani, I., Lopez-Paz, D.: In search of lost domain generalization. arXiv preprint arXiv:2007.01434 (2020)
- [54] He, K., Zhang, X., Ren, S., Sun, J.: Deep residual learning for image recognition. In: Proceedings of the IEEE conference on computer vision and pattern recognition. pp. 770–778 (2016)
- [55] Helminen, J., Dauphin, G.J., Linnansaari, T.: Length measurement accuracy of adaptive resolution imaging sonar and a predictive model to assess adult atlantic salmon (salmo salar) into two size categories with long-range data in a river. Journal of fish biology 97(4), 1009–1026 (2020)
- [56] Hermans, A., Beyer, L., Leibe, B.: In defense of the triplet loss for person re-identification. arXiv preprint arXiv:1703.07737 (2017)
- [57] Hoffman, J., Wang, D., Yu, F., Darrell, T.: Fcns in the wild: Pixel-level adversarial and constraint-based adaptation (2016)
- [58] Holmberg, J., Norman, B., Arzoumanian, Z.: Estimating population size, structure, and residency time for whale sharks rhincodon typus through collaborative photo-identification. Endangered Species Research 7(1), 39–53 (2009)
- [59] Hong, W., Kennedy, A., Burgos-Artizzu, X.P., Zelikowsky, M., Navonne, S.G., Perona, P., Anderson, D.J.: Automated measurement of mouse social behaviors using depth sensing, video tracking, and machine learning. Proceedings of the National Academy of Sciences 112(38), E5351–E5360 (2015)
- [60] Hornakova, A., Henschel, R., Rosenhahn, B., Swoboda, P.: Lifted disjoint paths with application in multiple object tracking. In: International Conference on Machine Learning. pp. 4364–4375. PMLR (2020)
- [61] Hsieh, M.R., Lin, Y.L., Hsu, W.H.: Drone-based object counting by spatially regularized regional proposal network. In: Proceedings of the IEEE international conference on computer vision. pp. 4145–4153 (2017)
- [62] Huang, J., Rathod, V., Sun, C., Zhu, M., Korattikara, A., Fathi, A., Fischer, I., Wojna, Z., Song, Y., Guadarrama, S., et al.: Speed/accuracy trade-offs for modern convolutional object detectors. In: Proceedings of the IEEE conference on computer vision and pattern recognition. pp. 7310–7311 (2017)
- [63] Idrees, H., Tayyab, M., Athrey, K., Zhang, D., Al-Maadeed, S., Rajpoot, N., Shah, M.: Composition loss for counting, density map estimation and localization in dense crowds. In: Proceedings of the European Conference on Computer Vision (ECCV). pp. 532–546 (2018)
- [64] Jaybhay, J., Shastri, R.: A study of speckle noise reduction filters. signal & image processing: An international Journal (SIPIJ) 6(3), 71–80 (2015)
- [65] Jocher, G., Chaurasia, A., Stoken, A., Borovec, J., NanoCode012, Kwon, Y., TaoXie, Fang, J., imyhxy, Michael, K., Lorna, V, A., Montes, D., Nadar, J., Laughing, tkianai, yxNONG, Skalski, P., Wang, Z., Hogan, A., Fati, C., Mammana, L., AlexWang1900, Patel, D., Yiwei, D., You, F., Hajek, J., Diaconu, L., Minh, M.T.: ultralytics/yolov5: v6.1 - TensorRT, TensorFlow Edge TPU and OpenVINO Export and Inference (Feb 2022). https://doi.org/10.5281/zenodo.6222936, https://doi.org/10.5281/zenodo.6222936
- [66] Jones, F.M., Allen, C., Arteta, C., Arthur, J., Black, C., Emmerson, L.M., Freeman, R., Hines, G., Lintott, C.J., Macháčková, Z., et al.: Time-lapse imagery and volunteer classifications from the zooniverse penguin watch project. Scientific data 5(1), 1–13 (2018)
- [67] Kalman, R.E.: A New Approach to Linear Filtering and Prediction Problems. Journal of Basic Engineering 82(1), 35–45 (Mar 1960). https://doi.org/10.1115/1.3662552, https://asmedigitalcollection.asme.org/fluidsengineering/article/82/1/35/397706/A-New-Approach-to-Linear-Filtering-and-Prediction
- [68] Kamenetsky, D., Sherrah, J.: Aerial car detection and urban understanding. In: 2015 International Conference on Digital Image Computing: Techniques and Applications (DICTA). pp. 1–8. IEEE (2015)
- [69] Karabchevsky, S., Kahana, D., Ben-Harush, O., Guterman, H.: Fpga-based adaptive speckle suppression filter for underwater imaging sonar. IEEE Journal of Oceanic Engineering 36(4), 646–657 (2011)
- [70] Kellenberger, B., Marcos, D., Tuia, D.: Detecting mammals in uav images: Best practices to address a substantially imbalanced dataset with deep learning. Remote sensing of environment 216, 139–153 (2018)
- [71] Key, B., Miller, J., Huang, J.: Operational plan: Kenai river chinook salmon sonar assessment at river mile 13.7, 2020–2022 (2020)
- [72] Kingma, D.P., Ba, J.: Adam: A method for stochastic optimization. arXiv preprint arXiv:1412.6980 (2014)
- [73] Kocamaz, M.K., Gong, J., Pires, B.R.: Vision-based counting of pedestrians and cyclists. In: 2016 IEEE winter conference on applications of computer vision (WACV). pp. 1–8. IEEE (2016)
- [74] Koh, P.W., Sagawa, S., Marklund, H., Xie, S.M., Zhang, M., Balsubramani, A., Hu, W., Yasunaga, M., Phillips, R.L., Gao, I., et al.: Wilds: A benchmark of in-the-wild distribution shifts. In: International Conference on Machine Learning. pp. 5637–5664. PMLR (2021)
- [75] Koh, P.W., Sagawa, S., Marklund, H., Xie, S.M., Zhang, M., Balsubramani, A., Hu, W., Yasunaga, M., Phillips, R.L., Gao, I., et al.: Wilds: A benchmark of in-the-wild distribution shifts. In: International Conference on Machine Learning. pp. 5637–5664. PMLR (2021)
- [76] Kuehne, H., Jhuang, H., Garrote, E., Poggio, T., Serre, T.: Hmdb: a large video database for human motion recognition. In: 2011 International conference on computer vision. pp. 2556–2563. IEEE (2011)
- [77] Kulits, P., Wall, J., Bedetti, A., Henley, M., Beery, S.: Elephantbook: A semi-automated human-in-the-loop system for elephant re-identification. In: ACM SIGCAS Conference on Computing and Sustainable Societies. pp. 88–98 (2021)
- [78] Kumar, N., Belhumeur, P.N., Biswas, A., Jacobs, D.W., Kress, W.J., Lopez, I.C., Soares, J.V.: Leafsnap: A computer vision system for automatic plant species identification. In: European conference on computer vision. pp. 502–516. Springer (2012)
- [79] Leal-Taixé, L., Milan, A., Reid, I., Roth, S., Schindler, K.: Motchallenge 2015: Towards a benchmark for multi-target tracking. arXiv preprint arXiv:1504.01942 (2015)
- [80] Li, S., Li, J., Lin, W., Tang, H.: Amur tiger re-identification in the wild. arXiv e-prints pp. arXiv–1906 (2019)
- [81] Li, W., Zhao, R., Xiao, T., Wang, X.: Deepreid: Deep filter pairing neural network for person re-identification. In: Proceedings of the IEEE conference on computer vision and pattern recognition. pp. 152–159 (2014)
- [82] Liu, L., Lu, H., Cao, Z., Xiao, Y.: Counting Fish in Sonar Images. In: 2018 25th IEEE International Conference on Image Processing (ICIP). pp. 3189–3193 (Oct 2018). https://doi.org/10.1109/ICIP.2018.8451154, iSSN: 2381-8549
- [83] Luiten, J., Osep, A., Dendorfer, P., Torr, P., Geiger, A., Leal-Taixé, L., Leibe, B.: Hota: A higher order metric for evaluating multi-object tracking. International journal of computer vision 129(2), 548–578 (2021)
- [84] Luo, W., Xing, J., Milan, A., Zhang, X., Liu, W., Kim, T.K.: Multiple object tracking: A literature review. Artificial Intelligence 293, 103448 (2021)
- [85] Ma, Z., Chan, A.B.: Crossing the line: Crowd counting by integer programming with local features. In: Proceedings of the IEEE Conference on Computer Vision and Pattern Recognition. pp. 2539–2546 (2013)
- [86] Mandal, V., Adu-Gyamfi, Y.: Object detection and tracking algorithms for vehicle counting: a comparative analysis. Journal of Big Data Analytics in Transportation 2(3), 251–261 (2020)
- [87] Marstaller, J., Tausch, F., Stock, S.: Deepbees-building and scaling convolutional neuronal nets for fast and large-scale visual monitoring of bee hives. In: Proceedings of the IEEE International Conference on Computer Vision Workshops. pp. 0–0 (2019)
- [88] Mathis, M.W., Mathis, A.: Deep learning tools for the measurement of animal behavior in neuroscience. Current opinion in neurobiology 60, 1–11 (2020)
- [89] McCann, E., Li, L., Pangle, K., Johnson, N., Eickholt, J.: An underwater observation dataset for fish classification and fishery assessment. Scientific data 5(1), 1–8 (2018)
- [90] Milan, A., Leal-Taixé, L., Reid, I., Roth, S., Schindler, K.: Mot16: A benchmark for multi-object tracking. arXiv preprint arXiv:1603.00831 (2016)
- [91] Moranduzzo, T., Melgani, F.: Automatic car counting method for unmanned aerial vehicle images. IEEE Transactions on Geoscience and Remote Sensing 52(3), 1635–1647 (2013)
- [92] Moursund, R.A., Carlson, T.J., Peters, R.D.: A fisheries application of a dual-frequency identification sonar acoustic camera. ICES Journal of Marine Science 60(3), 678–683 (2003)
- [93] Muandet, K., Balduzzi, D., Schölkopf, B.: Domain generalization via invariant feature representation. In: International Conference on Machine Learning. pp. 10–18. PMLR (2013)
- [94] Musgrave, K., Belongie, S., Lim, S.N.: A metric learning reality check. In: European Conference on Computer Vision. pp. 681–699. Springer (2020)
- [95] Naphade, M., Wang, S., Anastasiu, D.C., Tang, Z., Chang, M.C., Yang, X., Yao, Y., Zheng, L., Chakraborty, P., Lopez, C.E., et al.: The 5th ai city challenge. In: Proceedings of the IEEE/CVF Conference on Computer Vision and Pattern Recognition. pp. 4263–4273 (2021)
- [96] Nilsback, M.E., Zisserman, A.: A visual vocabulary for flower classification. In: 2006 IEEE Computer Society Conference on Computer Vision and Pattern Recognition (CVPR’06). vol. 2, pp. 1447–1454. IEEE (2006)
- [97] Norouzzadeh, M.S., Nguyen, A., Kosmala, M., Swanson, A., Palmer, M.S., Packer, C., Clune, J.: Automatically identifying, counting, and describing wild animals in camera-trap images with deep learning. Proceedings of the National Academy of Sciences 115(25), E5716–E5725 (2018)
- [98] Onoro-Rubio, D., López-Sastre, R.J.: Towards perspective-free object counting with deep learning. In: European conference on computer vision. pp. 615–629. Springer (2016)
- [99] Pardo, L.E., Bombaci, S., Huebner, S.E., Somers, M.J., Fritz, H., Downs, C., Guthmann, A., Hetem, R.S., Keith, M., Roux, A.l., et al.: Snapshot safari: A large-scale collaborative to monitor africa’s remarkable biodiversity. South African Journal of Science 117(1-2), 1–4 (2021)
- [100] Parham, J.R., Crall, J., Stewart, C., Berger-Wolf, T., Rubenstein, D.: Animal population censusing at scale with citizen science and photographic identification. In: 2017 AAAI Spring Symposium Series (2017)
- [101] Pedersen, M., Haurum, J.B., Bengtson, S.H., Moeslund, T.B.: 3d-zef: A 3d zebrafish tracking benchmark dataset. In: Proceedings of the IEEE/CVF Conference on Computer Vision and Pattern Recognition. pp. 2426–2436 (2020)
- [102] Pess, G.R., McHenry, M.L., Beechie, T.J., Davies, J.: Biological impacts of the elwha river dams and potential salmonid responses to dam removal. Northwest Science 82(sp1), 72–90 (2008)
- [103] Ren, S., He, K., Girshick, R., Sun, J.: Faster r-cnn: Towards real-time object detection with region proposal networks. Advances in neural information processing systems 28, 91–99 (2015)
- [104] Revaud, J., Weinzaepfel, P., Harchaoui, Z., Schmid, C.: Deepmatching: Hierarchical deformable dense matching. International Journal of Computer Vision 120(3), 300–323 (2016)
- [105] Rey, N., Volpi, M., Joost, S., Tuia, D.: Detecting animals in african savanna with uavs and the crowds. Remote Sensing of Environment 200, 341–351 (2017)
- [106] Richards, B.L., Drazen, J.C., Virginia Moriwake, V.: Hawai’i deep-7 bottomfish training and validation image dataset: Noaa pacific islands fisheries science center botcam stereo-video (2014)
- [107] Ristani, E., Solera, F., Zou, R., Cucchiara, R., Tomasi, C.: Performance measures and a data set for multi-target, multi-camera tracking. In: European conference on computer vision. pp. 17–35. Springer (2016)
- [108] Rodriguez, I.F., Megret, R., Acuna, E., Agosto-Rivera, J.L., Giray, T.: Recognition of pollen-bearing bees from video using convolutional neural network. In: 2018 IEEE Winter Conference on Applications of Computer Vision (WACV). pp. 314–322. IEEE (2018)
- [109] Saenko, K., Kulis, B., Fritz, M., Darrell, T.: Adapting visual category models to new domains. In: European conference on computer vision. pp. 213–226. Springer (2010)
- [110] Saleh, A., Laradji, I.H., Konovalov, D.A., Bradley, M., Vazquez, D., Sheaves, M.: A realistic fish-habitat dataset to evaluate algorithms for underwater visual analysis. Scientific Reports 10(1), 1–10 (2020)
- [111] Sam, D.B., Peri, S.V., Sundararaman, M.N., Kamath, A., Radhakrishnan, V.B.: Locate, size and count: Accurately resolving people in dense crowds via detection. IEEE transactions on pattern analysis and machine intelligence (2020)
- [112] Schneider, S., Zhuang, A.: Counting fish and dolphins in sonar images using deep learning. arXiv preprint arXiv:2007.12808 (2020)
- [113] Shao, W., Kawakami, R., Yoshihashi, R., You, S., Kawase, H., Naemura, T.: Cattle detection and counting in uav images based on convolutional neural networks. International Journal of Remote Sensing 41(1), 31–52 (2020)
- [114] Simmonds, J., MacLennan, D.N.: Fisheries acoustics: theory and practice. John Wiley & Sons (2008)
- [115] Soomro, K., Zamir, A.R., Shah, M.: Ucf101: A dataset of 101 human actions classes from videos in the wild. arXiv preprint arXiv:1212.0402 (2012)
- [116] Springer: MARS: A Video Benchmark for Large-Scale Person Re-identification (2016)
- [117] Stierhoff, K., Cutter, G.: Rockfish (sebastes spp.) training and validation image dataset: Noaa southwest fisheries science center remotely operated vehicle (rov) digital still images (2013)
- [118] Sun, J.J., Karigo, T., Chakraborty, D., Mohanty, S.P., Wild, B., Sun, Q., Chen, C., Anderson, D.J., Perona, P., Yue, Y., et al.: The multi-agent behavior dataset: Mouse dyadic social interactions. arXiv preprint arXiv:2104.02710 (2021)
- [119] Sun, P., Kretzschmar, H., Dotiwalla, X., Chouard, A., Patnaik, V., Tsui, P., Guo, J., Zhou, Y., Chai, Y., Caine, B., et al.: Scalability in perception for autonomous driving: Waymo open dataset. In: Proceedings of the IEEE/CVF Conference on Computer Vision and Pattern Recognition. pp. 2446–2454 (2020)
- [120] Swanson, A., Kosmala, M., Lintott, C., Simpson, R., Smith, A., Packer, C.: Snapshot serengeti, high-frequency annotated camera trap images of 40 mammalian species in an african savanna. Scientific data 2(1), 1–14 (2015)
- [121] Tabak, M.A., Norouzzadeh, M.S., Wolfson, D.W., Sweeney, S.J., VerCauteren, K.C., Snow, N.P., Halseth, J.M., Di Salvo, P.A., Lewis, J.S., White, M.D., et al.: Machine learning to classify animal species in camera trap images: Applications in ecology. Methods in Ecology and Evolution 10(4), 585–590 (2019)
- [122] The Nature Conservancy: Channel islands camera traps 1.0 (2021)
- [123] Thompson, T.Q., Bellinger, M.R., O’Rourke, S.M., Prince, D.J., Stevenson, A.E., Rodrigues, A.T., Sloat, M.R., Speller, C.F., Yang, D.Y., Butler, V.L., et al.: Anthropogenic habitat alteration leads to rapid loss of adaptive variation and restoration potential in wild salmon populations. Proceedings of the National Academy of Sciences 116(1), 177–186 (2019)
- [124] Torralba, A., Efros, A.A.: Unbiased look at dataset bias. In: CVPR 2011. pp. 1521–1528. IEEE (2011)
- [125] Tuia, D., Kellenberger, B., Beery, S., Costelloe, B.R., Zuffi, S., Risse, B., Mathis, A., Mathis, M.W., van Langevelde, F., Burghardt, T., et al.: Perspectives in machine learning for wildlife conservation. Nature Communications 13(1), 1–15 (2022)
- [126] Van Horn, G., Branson, S., Farrell, R., Haber, S., Barry, J., Ipeirotis, P., Perona, P., Belongie, S.: Building a bird recognition app and large scale dataset with citizen scientists: The fine print in fine-grained dataset collection. In: Proceedings of the IEEE Conference on Computer Vision and Pattern Recognition. pp. 595–604 (2015)
- [127] Van Horn, G., Mac Aodha, O., Song, Y., Cui, Y., Sun, C., Shepard, A., Adam, H., Perona, P., Belongie, S.: The inaturalist species classification and detection dataset. In: Proceedings of the IEEE conference on computer vision and pattern recognition. pp. 8769–8778 (2018)
- [128] Wah, C., Branson, S., Welinder, P., Perona, P., Belongie, S.: The caltech-ucsd birds-200-2011 dataset (2011)
- [129] Wang, C.Y., Bochkovskiy, A., Liao, H.Y.M.: Scaled-yolov4: Scaling cross stage partial network. In: Proceedings of the IEEE/cvf conference on computer vision and pattern recognition. pp. 13029–13038 (2021)
- [130] Wang, Q., Gao, J., Lin, W., Li, X.: Nwpu-crowd: A large-scale benchmark for crowd counting and localization. IEEE transactions on pattern analysis and machine intelligence 43(6), 2141–2149 (2020)
- [131] Weinland, D., Ronfard, R., Boyer, E.: Free viewpoint action recognition using motion history volumes. Computer vision and image understanding 104(2-3), 249–257 (2006)
- [132] Weinstein, B.G., Marconi, S., Bohlman, S.A., Zare, A., Singh, A., Graves, S.J., White, E.P.: A remote sensing derived data set of 100 million individual tree crowns for the national ecological observatory network. Elife 10, e62922 (2021)
- [133] Wen, L., Du, D., Cai, Z., Lei, Z., Chang, M.C., Qi, H., Lim, J., Yang, M.H., Lyu, S.: Ua-detrac: A new benchmark and protocol for multi-object detection and tracking. Computer Vision and Image Understanding 193, 102907 (2020)
- [134] Wen, L., Du, D., Zhu, P., Hu, Q., Wang, Q., Bo, L., Lyu, S.: Detection, tracking, and counting meets drones in crowds: A benchmark. In: Proceedings of the IEEE/CVF Conference on Computer Vision and Pattern Recognition. pp. 7812–7821 (2021)
- [135] Wen, L., Du, D., Zhu, P., Hu, Q., Wang, Q., Bo, L., Lyu, S.: Detection, tracking, and counting meets drones in crowds: A benchmark. In: CVPR (2021)
- [136] Wojke, N., Bewley, A., Paulus, D.: Simple online and realtime tracking with a deep association metric. In: 2017 IEEE international conference on image processing (ICIP). pp. 3645–3649. IEEE (2017)
- [137] Wu, Y., Kirillov, A., Massa, F., Lo, W.Y., Girshick, R.: Detectron2. https://github.com/facebookresearch/detectron2 (2019)
- [138] Wu, Z., Fuller, N., Theriault, D., Betke, M.: A thermal infrared video benchmark for visual analysis. In: Proceedings of the IEEE Conference on Computer Vision and Pattern Recognition Workshops. pp. 201–208 (2014)
- [139] Xiao, T., Dou, Z., Wang, K.: Open-reid (2017), https://cysu.github.io/open-reid/
- [140] Ye, N., Li, K., Bai, H., Yu, R., Hong, L., Zhou, F., Li, Z., Zhu, J.: Ood-bench: Quantifying and understanding two dimensions of out-of-distribution generalization. In: Proceedings of the IEEE/CVF Conference on Computer Vision and Pattern Recognition. pp. 7947–7958 (2022)
- [141] Yousif, H., Kays, R., He, Z.: Dynamic programming selection of object proposals for sequence-level animal species classification in the wild. IEEE Transactions on Circuits and Systems for Video Technology (2019)
- [142] Yu, F., Xian, W., Chen, Y., Liu, F., Liao, M., Madhavan, V., Darrell, T.: Bdd100k: A diverse driving video database with scalable annotation tooling. arXiv preprint arXiv:1805.04687 2(5), 6 (2018)
- [143] Zhang, C., Kang, K., Li, H., Wang, X., Xie, R., Yang, X.: Data-driven crowd understanding: A baseline for a large-scale crowd dataset. IEEE Transactions on Multimedia 18(6), 1048–1061 (2016)
- [144] Zhang, C., Li, H., Wang, X., Yang, X.: Cross-scene crowd counting via deep convolutional neural networks. In: Proceedings of the IEEE conference on computer vision and pattern recognition. pp. 833–841 (2015)
- [145] Zhang, S., Wu, G., Costeira, J.P., Moura, J.M.: Fcn-rlstm: Deep spatio-temporal neural networks for vehicle counting in city cameras. In: Proceedings of the IEEE international conference on computer vision. pp. 3667–3676 (2017)
- [146] Zhang, Y., David, P., Gong, B.: Curriculum domain adaptation for semantic segmentation of urban scenes. In: 2017 IEEE International Conference on Computer Vision (ICCV). pp. 2039–2049 (2017)
- [147] Zhang, Y., Sun, P., Jiang, Y., Yu, D., Yuan, Z., Luo, P., Liu, W., Wang, X.: Bytetrack: Multi-object tracking by associating every detection box. arXiv preprint arXiv:2110.06864 (2021)
- [148] Zhang, Y., Wang, C., Wang, X., Zeng, W., Liu, W.: Fairmot: On the fairness of detection and re-identification in multiple object tracking. arXiv preprint arXiv:2004.01888 (2020)
- [149] Zhang, Y., Zhou, D., Chen, S., Gao, S., Ma, Y.: Single-image crowd counting via multi-column convolutional neural network. In: Proceedings of the IEEE conference on computer vision and pattern recognition. pp. 589–597 (2016)
- [150] Zhang, Z., He, Z., Cao, G., Cao, W.: Animal detection from highly cluttered natural scenes using spatiotemporal object region proposals and patch verification. IEEE Transactions on Multimedia 18(10), 2079–2092 (2016)
- [151] Zhao, Z., Li, H., Zhao, R., Wang, X.: Crossing-line crowd counting with two-phase deep neural networks. In: European Conference on Computer Vision. pp. 712–726. Springer (2016)
- [152] Zheng, L., Shen, L., Tian, L., Wang, S., Wang, J., Tian, Q.: Scalable person re-identification: A benchmark. In: Proceedings of the IEEE international conference on computer vision. pp. 1116–1124 (2015)
- [153] Zheng, Z., Yang, X., Yu, Z., Zheng, L., Yang, Y., Kautz, J.: Joint discriminative and generative learning for person re-identification. In: Proceedings of the IEEE/CVF Conference on Computer Vision and Pattern Recognition. pp. 2138–2147 (2019)
- [154] Zhou, K., Liu, Z., Qiao, Y., Xiang, T., Loy, C.C.: Domain generalization in vision: A survey (2021)
- [155] Zhou, Y., Yu, H., Wu, J., Cui, Z., Zhang, F.: Fish behavior analysis based on computer vision: A survey. In: International Conference of Pioneering Computer Scientists, Engineers and Educators. pp. 130–141. Springer (2019)
- [156] Zhu, P., Peng, T., Du, D., Yu, H., Zhang, L., Hu, Q.: Graph regularized flow attention network for video animal counting from drones. IEEE Transactions on Image Processing (2021)
- [157] Zou, Z., Shi, Z., Guo, Y., Ye, J.: Object detection in 20 years: A survey. arXiv preprint arXiv:1905.05055 (2019)
The Caltech Fish Counting Dataset: Supplementary Material
Justin Kay Peter Kulits Suzanne Stathatos Siqi Deng Erik Young Sara Beery Grant Van Horn Pietro Perona
7 Imaging Sonar
In this section we provide additional background information regarding the imaging sonar format and causes of the challenges enumerated in Fig. 2 of the main paper.
The Caltech Fish Counting Dataset (CFC) consists of video clips sourced from adaptive resolution imaging sonar (ARIS) hardware manufactured by Sound Metrics Corporation. Imaging sonars use an array of sound beams to produce underwater images (see Fig. 6B), and have been used to monitor migrating salmon populations in rivers since 2002 [71, 11]. Because sound travels much further than light in water [114], sonar can be used to make observations at longer ranges compared to photographic systems and is more robust to turbid conditions [92, 114]. It can also be used at night, when salmon often travel to minimize predation risk [42]. The latest generations of imaging sonar have the additional benefit of encoding information about real-world distances, i.e. each pixel in the resulting image represents a defined distance in meters. This can be used to directly measure the length of the observed fish, an important attribute for fisheries management programs in differentiating between species, age groups, and assessing overall population makeup [55].
The ARIS hardware is typically positioned perpendicular to the river flow, thus the fish are observed as moving left-to-right or right-to-left once the sonar data is transformed into video. There are a number of factors which impact the visual characteristics and contribute to a large variance in the images produced at different deployments.
7.0.1 Environmental factors
include the presence of sediment, floating or static debris, textured river bottom, and plant material. These affect visibility and cause occlusion of target fish. These factors change day-to-day due to weather conditions, as well as on longer time scales due to seasonal variations and anthropogenic impact [123]. The shape and size of the river, which change throughout the season as water levels rise and fall, have an impact on image quality as well. Smaller river channels can result in increased echo, and variations in the shape of the river bottom can make it difficult for a single camera to effectively observe a broad area, e.g. to cover a steep bank while maintaining visibility further out into the middle of the river.
7.0.2 Hardware settings
include sonar frequency and camera orientation, which are configured based on the monitoring objectives and river characteristics of each deployment. The operating frequency of a system, typically ranging between 0.7 MHz and 1.8 MHz, determines the image resolution of the recorded video as well as its range capabilities [11, 55]. There are trade-offs in setting this frequency, since higher frequency sound waves allow for higher resolution imagery, but reduce the range capabilities due to increased sound absorption [114]. Some hardware systems also allow users to choose the number of sonar beams used. More beams help improve resolution at the cost of reducing the observed range as well as the number of frames captured per second [55].
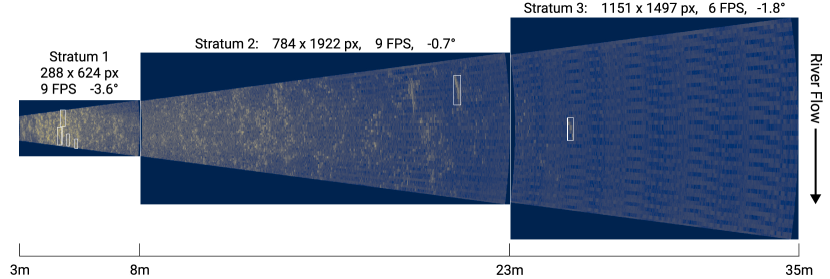
As each beam of sound travels away from the device its observed area increases, decreasing the resolution of longer-range observations. See Fig. 6B. In practice, cameras are often cycled through two or more range settings known as strata to allow a single camera to sample both near-range and far-range data at specified intervals. See Fig. 8. For example, cameras on the Kenai River cycle through 2 or 3 strata each hour, such that each camera records 20 minutes of data from a near-range setting, 20 minutes of data from a mid-range setting, and (optionally) 20 minutes of data from a long-range setting [71].
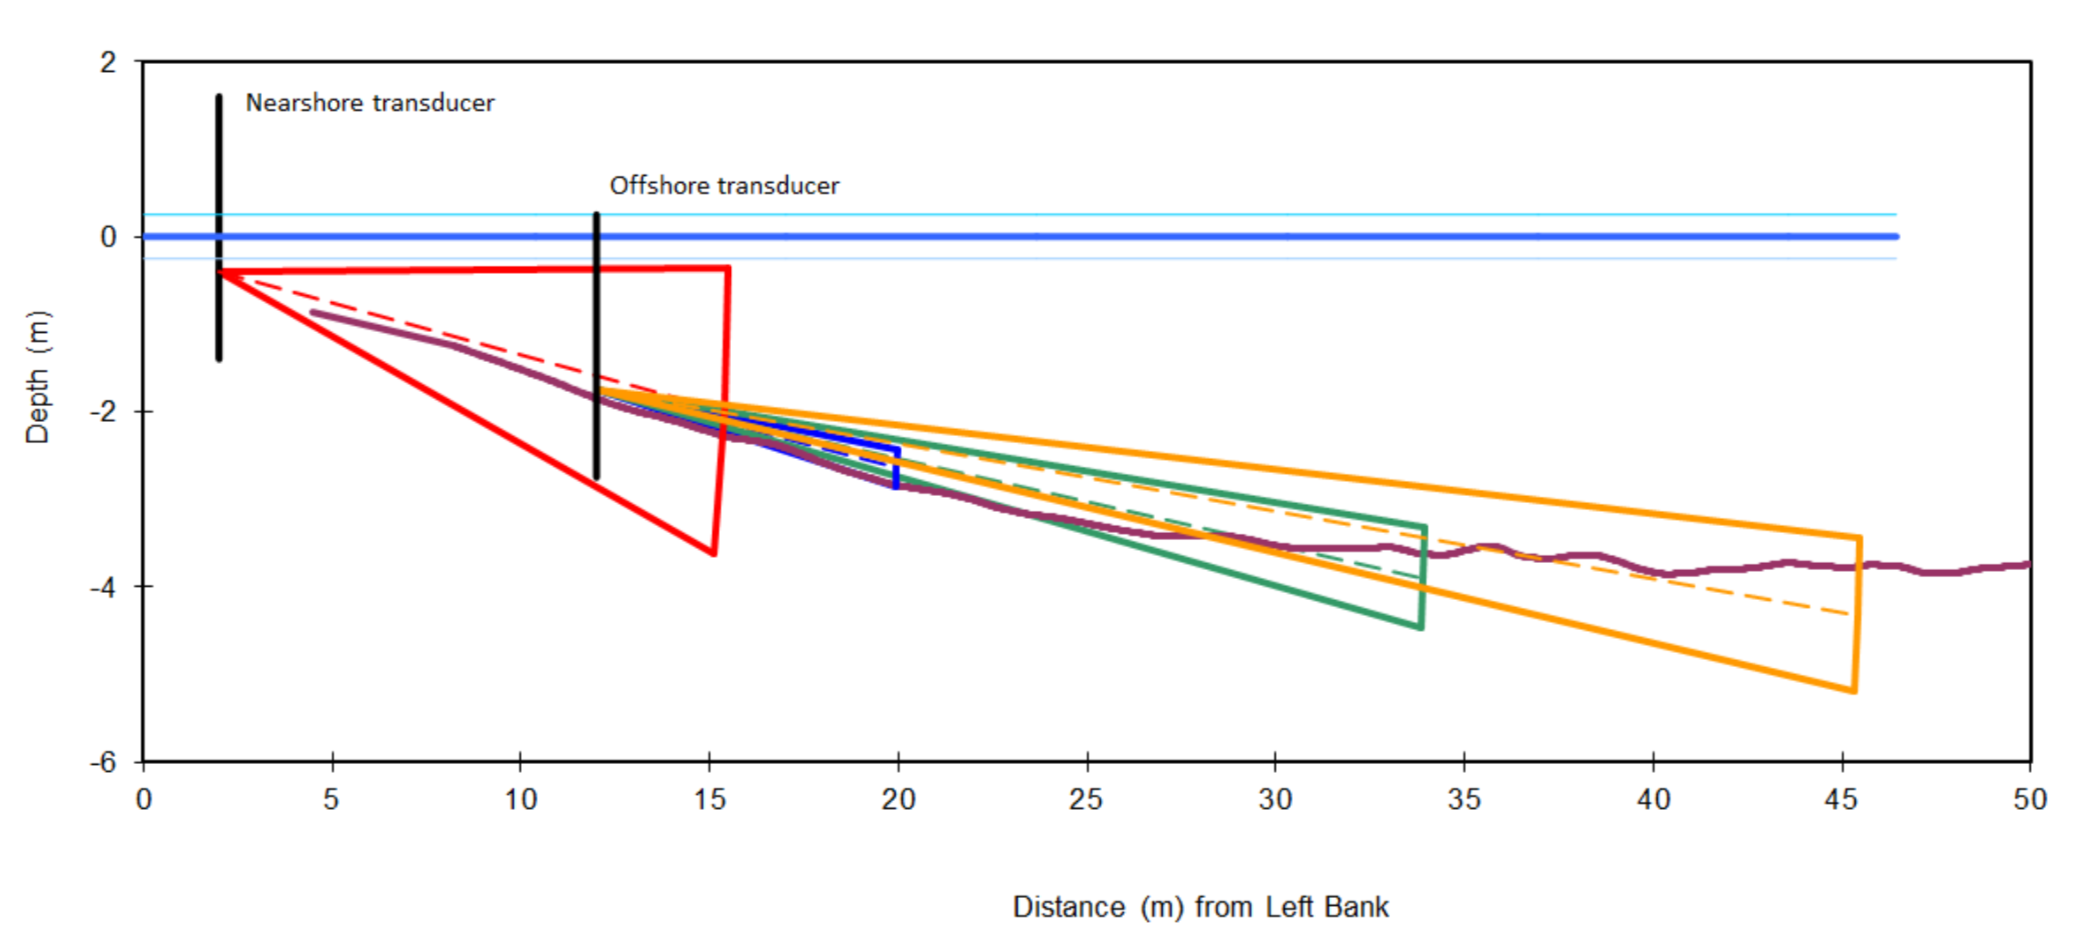
Image quality is also impacted by the camera’s position and orientation in relation to the river floor. A camera which is closer to or pitched toward the bottom will allow for observing fish which swim in deeper waters, however more background information will be picked up which can lead to severe occlusion issues. See Fig. 7.
7.0.3 Acoustic properties
can cause confounding visual phenomena which interfere with accurate fish observation and measurement. Speckle noise, caused by returning wave interference within the sonar transducer [64, 69, 52], makes for grainy imagery which can make fish detection difficult. Acoustic shadows can occlude fish. Sound waves can bounce back and forth between the river bottom and the water surface before returning to the transducer, resulting in multiple shifting bottom images [43]. This type of echo can also create multiple images of individual fish offset from each other, known as “ghost fish” [43]. The presence and extremity of these ghost images varies based on river shape, camera orientation, and water level.
8 Dataset
In this section we provide additional details about the data source locations in CFC. The distribution of video clips and annotations can be seen in Fig. 9, and generalization challenges from clip density can be seen in Fig. 10.
8.0.1 Kenai River (AK)
We received data from 5 different cameras deployed at 3 locations on the Kenai River at river mile (RM) 13.7 between May 26th and August 17th 2018. The left and right sides of the river mainstem contain one near-range camera and one far-range camera apiece. In our dataset we refer to data from the left and right sides of the main river channel as KL (Kenai Left Bank) and KR (Kenai Right Bank) respectively. There is an additional smaller tributary at RM 13.7 known as the “minor channel”, where a fifth camera is placed, the data from which we refer to as KC (Kenai Channel).
Of the data we received, the Kenai River had the most useful manual annotations, specifying a frame number, location in polar coordinates, and size measurement for each observed fish. To create the dataset for this location we extracted 200-frame video clips centered around randomly-selected manually marked frames. This duration was chosen after initial visual inspection to approximate the time it took for fish to enter and exit the field of view. If any of these clips overlapped, we merged them into one longer clip. In total we extracted 1233 clips from the Kenai River containing 4300 fish.
8.0.2 Nushagak River (AK)
We received data from 2 cameras deployed on the Nushagak River approximately 57 river kilometers (RKM) from the town of Dillingham between June 7th and September 1st 2018. We received hourly counts rather than timestamps of fish observations, so manual inspection was required to find clips containing fish. In one of the cameras, fish were very sparse and it was prohibitively time-consuming to do. We focused instead on the second camera, in which fish were very abundant (see Fig. 9F). We sampled 72 300-frame clips containing 3070 fish.
8.0.3 Elwha River (WA)
We received data from a single camera deployed at RKM 1 of the Elwha River between July 9th and September 18th 2018. Timestamps and length measurements for all fish were also provided. We used the same protocol as the Kenai, randomly sampling 200-frame clips and merging any that overlapped. In total we sampled 262 clips containing 884 fish. Compared to the other locations, the Elwha data is much more sparse due to a nascent recovery of its salmon populations (see Fig. 9B). This river is currently rebounding from a 90% reduction in salmon populations as a result of damming in the early 1900s [102], and after the largest dam removal project in history is beginning to see the return of several species [46].
9 Additional Experiments
9.1 Detector Architecture Search
| Detector | Validation AP50 |
| Faster R-CNN + Resnet101 | 65.9 |
| ScaledYOLOv4 CSP | 65.3 |
| YOLOv5m | 66.4 |
We benchmarked three state-of-the-art object detection architectures: Faster R-CNN [103] with a Resnet-101 [54] backbone; ScaledYOLOv4 [129]; and YOLOv5 [65]. We trained on the CFC training set and evaluated on the validation set. For these experiments we used the raw verison of the sonar frames (i.e. not the novel input format used by the Baseline++ method). We selected our final architecture based on validation set AP50. See Table 2.
9.1.1 Faster R-CNN Training Settings
We fine-tuned a Faster R-CNN model pretrained on COCO using the default training settings from Detectron2 v0.6 [137] with the following modifications: we trained with a batch size of 8 and a learning rate of 0.0025 on two NVIDIA RTX A5000 GPUs for 18 epochs, reducing the learning rate by a factor of 10 at epochs 12 and 16, and selected the best model checkpoint based on validation AP50.
9.1.2 ScaledYOLOv4 Training Settings
We fine-tuned a ScaledYOLOv4 CSP model pretrained on COCO using the default training settings from the official implementation with the following modifications: we resized all inputs to 896px on their longest side and selected the best model checkpoint based on validation AP50. We used a batch size of 32 and trained on two NVIDIA RTX A5000 GPUs.
9.1.3 YOLOv5 Training Settings
We fine-tuned a YOLOv5m model pretrained on COCO using the default training settings from v6.0 release with the following modifications: we resized all inputs to 896px on their longest side, trained the detector for 150 epochs, and selected the best model checkpoint based on validation AP50. We used a batch size of 64 and trained on two NVIDIA RTX A5000 GPUs.
9.2 Appearance-based Re-ID
| Dataset | mAP |
| CUHK03 [81] | 80.7 |
| Market1501 [152] | 67.9 |
| MARS* [116] | 67.7 |
| CFC (Val) | 19.2 |
Our baseline tracker [15] uses a motion model and a simple IoU metric to perform association. It is also common to incorporate appearance information into the association costs [30, 84, 153]. However, due to the lack of differentiating features between individual fish in CFC, we did not expect appearance-based re-identification methods to work well for association.
We verified this by implementing a popular visual re-identification network inspired by [56], based on a Resnet-50 and Triplet Loss. We show in Table 3 that it is indeed much less effective on CFC than on standard re-identification datasets. We trained the model by cropping out ground truth detections from our training set. Crops from the same ground-truth track were considered positive re-identification matches. We trained using the Adam optimizer [72] with a learning rate of 0.005 and batch size of 128 for 50 epochs. We used an output embedding size of 128 and the default data augmentations as described in [94, 139]. Results for other datasets are reported from [139] and [56].
9.3 Baseline Results
| Loc | Baseline | Baseline++ | ||||||||
| AP | MOTA | IDF1 | HOTA | nMAE | AP | MOTA | IDF1 | HOTA | nMAE | |
| KL | 66.4 | 44.9 | 66.7 | 49.2 | 4.9% | 68.0 | 47.8 | 68.5 | 51.2 | 3.3% |
| Val | ||||||||||
| KR | 57.7 | -28.5 | 45.4 | 33.5 | 11.8% | 87.1 | 69.8 | 82.3 | 60.3 | 3.7% |
| KC | 32.0 | -60.8 | 35.6 | 30.9 | 53.0% | 65.1 | 44.3 | 65.7 | 49.0 | 12.8% |
| NU | 70.6 | 30.2 | 60.8 | 44.4 | 14.0% | 85.5 | 56.2 | 75.1 | 54.4 | 8.6% |
| EL | 39.9 | -376.7 | 18.8 | 21.3 | 32.3% | 74.7 | -54.5 | 47.1 | 38.6 | 21.3% |
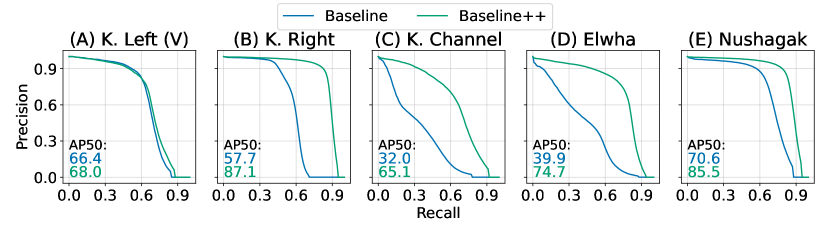
Fig. 11 shows example frames illustrating the 3-channel input format used by our Baseline++ method. We append two additional channels to the raw input frame: a background-subtracted channel obtained by subtracting the clip-wise average frame, and a frame-differenced channel obtained by taking the difference of the background-subtracted versions of the current and previous frame.
Tab. 4 shows the full results for our Baseline and Baseline++ methods across all metrics. We include additional visualizations of our Baseline and Baseline++ object detection performance in Figure 12. While the improvements for the Baseline++ method are marginal at the training/validation location (Kenai Left Bank, Fig. 12A), improvements are significant at the out-of-sample test locations, as indicated by the large increase in area under the PR curve in Fig. 12B–E.