Parametric FEM simulation of composite barrier FTJs under external bias at room temperature
Abstract
A study on a parametrized model of a composite barrier FTJ (three-interface system, with a non-polar dielectric layer) under an external bias voltage and at room temperature, using FEM-based simulations, was performed. The approach involves the Thomas-Fermi model assuming incomplete screening of polarization charges for building the energy barrier profile, and numerically simulates the electron transport through the barrier by bias-voltage-dependent tunneling, using Tsu-Esaki formulation. That naturally include the temperature dependent contributions to the total current density. The TER coefficient and current densities are computed considering variation of a large set of parameters that describe the composite barrier FTJ system in realistic physical range of values with respect to a reference (prototypical) system. In this study, the parametric simulations were performed starting from selected data reported on the SRO/STO/BTO/SRO heterostructure. The most important results of our work can be stated as follows: i) The FEM simulations prove to be reliable approach when we are interested in the prediction of FTJ characteristics at temperatures close to 300 K, and ii) We show that several configurations with large TER values may be predicted, but at the expense of very low current densities in the ON state. We suggest that the results may be useful for assessing the FTJ performances at ambient temperature, as well as to design preoptimized FTJs by using different combinations of materials to comply with a set of properties of a specific model.
Introduction
The ferroelectric tunneling junction (FTJ) device proposed by Esaki et al. as a polar switch in 1971 [1], has marked the beginning of thorough theoretical and experimental researches on understanding the physical mechanisms involved, as well as improving the predictive models to assist further developments of new FTJs applications. Basically, a FTJ design consists of two electrodes separated by a nanometer-thick ferroelectric layer, and its operation relies on switching between two resistive states when the ferroelectric polarization changes its direction normal to the junction plane. More complex designs include additional layers for improving the overall performance [2, 3, 4, 5, 6, 7].
In terms of modelling a FTJ structure, the ab-initio methods provide the most detailed insight into the local structure and physics at atomic level, but usually they are computationally consuming. On the other hand, the continuum medium model approaches, in which the numerical solution of Schrödinger equation is solved by Finite Element Method (FEM) can provide meaningful information on the FTJs behavior, at low computational costs, despite their idealization at nanometer scale, where the discrete behavior of nature manifests.
Nowadays, there is a large variety of materials to build FTJ heterostructures therefore predicting the performance of various designs or finding optimal structures at reduced costs becomes of real interest prior to experiments. Nevertheless, realistic continuum medium models are described by a relatively large number of parameters, which include thickness dependent material properties, and material to material interface properties, many of them being estimated from data obtained by ab-initio calculations. Finding complete sets of data for many materials of interest for the FTJ simulation in a FEM framework has proven a challenging task.
Mostly in theoretical studies, the FTJ performance is asserted by the tunneling electroresistance ratio (TER) expressed as (Ghigh - G / Glow, where Ghigh/low are the conductivities in the low/high resistance states at 0 K temperature. TER is an overall merit parameter and only its value cannot state the practical usefulness of a FTJ for applications because the magnitude of the write and readout currents in the ON and OFF states is also of utmost importance.
Starting from these considerations, in this work we have carried out FEM-based simulations on a parametrized FTJ model with a composite barrier including a non-polar dielectric layer besides the ferroelectric one, as an additional handle for the FTJ performance enhancement. Usually, in the case of a three-interface system, large TER values may be obtained, but they result from very low current density in the ON state. Predicting the current densities through the junction requires bias-voltage-dependent tunneling simulations which allow to evaluate the TER values as . To achieve this aim, we use a well-established continuum medium model for such structures, which assumes the incomplete screening of the polarization charges within the Thomas-Fermi approximation to build the energy barrier profile [2, 8], and simulate the electron transport through the barrier by bias-voltage-dependent tunneling at room temperature [5, 9].
The paper is organized as follows. In Section 2 we define the parameters of the model (Subsection 2.1) and briefly review the theoretical background of our approach (Subsection 2.2). The simulation results of the reference model used in this work, including potential barriers, transmission coefficients, current densities and TER values versus are presented in Subsection 2.3. The results of the parametric simulations are shown in Section 3, and their discussion is presented in Section 4. Section 5 highlights the main findings and outreach of this work.
Model and simulation
The numerical simulations were performed by using the COMSOL Multiphysics software [10]. Two main steps must be followed when simulating a FTJ in the frame of a continuum medium model, namely the construction of the energy barrier, and the simulation of electron transport process through the barrier. These determine the current densities corresponding to the two polarization directions in the ferroelectric, and hence the TER coefficient is derived.
Building the energy barrier
The key property responsible for the FTJ functionality is the change in energy barrier profile upon the ferroelectric polarization direction, as illustrated in Figure 1. The electron transport through the asymmetric barrier defines its electrical conductance with respect to the polarization direction, and therefore the junction can be switched between two states (ON for the higher conductance, and OFF for the lower conductance).
The electrostatic potential across a FTJ is determined by three components, namely the built-in electric field, , due to different workfunctions and chemistry at interfaces, the external applied electric field, , and the depolarization field, , caused by the incomplete screening of polarization charges at electrodes. The conduction band offsets at interfaces have also to be considered in order to build the energy barrier, but generally their values are not well known [11, 12].
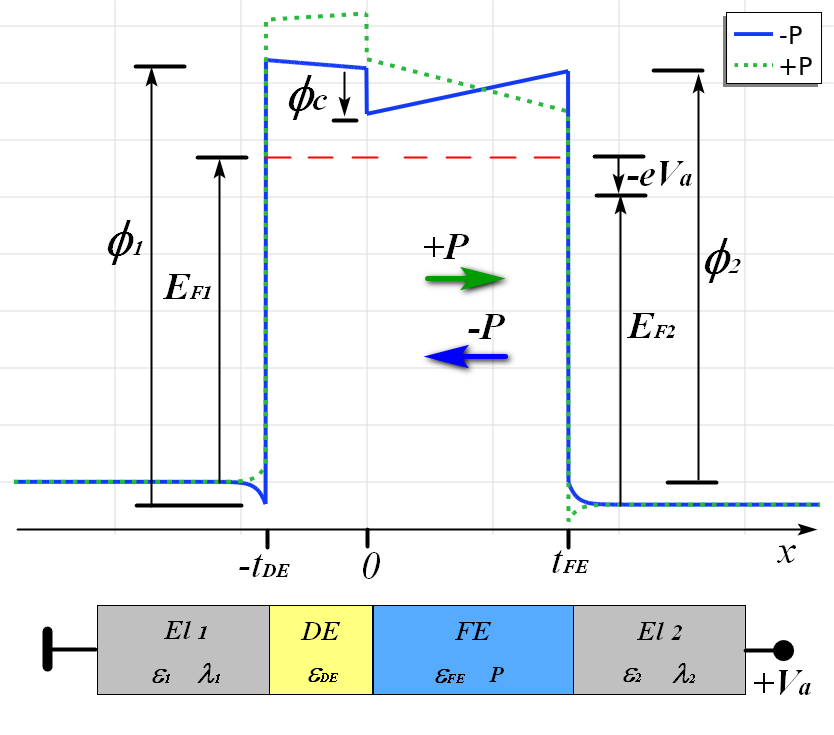
The potential energy of the barrier as seen by an electron, , is defined on 4 intervals, corresponding to the spatial domain occupied by each material in the system. We followed the derivation of the potential energy as can be found in various papers [5, 13, 14], but only its expression is given here, using our notations:
| (1) |
where is the screening charge per unit area at the electrode interfaces, are the Thomas-Fermi screening lengths in electrodes, P is the ferroelectric polarization, are the band discontinuities at the interfaces, Va is the external applied potential, is the built-in potential, and are the layers thicknesses.
Tunneling through the energy barrier
Maybe the most used method for calculating the transmission coefficient across energy barriers of FTJs is the WKB (Wentzel-Kramers-Brillouin) approximation, which is a semiclassical approach to compute the stationary solution of the Schrödinger equation, with the barrier approximated by its average value [4, 15, 16]. However, the WKB approximation cannot explain the resonance phenomena appearing in some systems [17] and is inaccurate for barrier profiles which vary abruptly. Therefore, alternative methods were proposed for calculating the transmission current across arbitrary potential barriers [18].
In the Tsu-Esaki model [19, 20], the net current through the barrier is derived considering only the longitudinal wavevector of electrons in the tunneling process, and it is also assumed that the dispersion relation, , is parabolic in the electrodes
| (2) |
where is the electron effective mass, are the Fermi energies in the electrodes, is the bias voltage across the heterojunction, is the transmission coefficient through the barrier as function of energy, and is the wavevector energy component perpendicular to the interface.
The term is known as the supply function [19, 21] and is derived from energy distributions of electrons in electrodes, in Fermi-Dirac statistics. As one can see, the above relations include both the temperature, , and externally applied bias voltage, , as parameters.
The Tsu-Esaki approach, by means of relation (2), is used in our work. The upper limit of the integral in relation (2) was set higher than the maximum barrier height, so the computed current density virtually includes the Fowler-Nordheim (tunneling across a triangular barrier) and thermionic tunnelling mechanisms [22].
Simulation of the reference system
Because finding complete sets of data on the materials involved in a FTJ system is a challenging task, we have parameterized the model as explained in Section 3. Following similar approaches, where the analysis is built around a reference or prototypical FTJ system [5, 14, 23, 24], herein we consider the SRO/STO/BTO/SRO heterostructure as a reference, with the characteristic parameters listed in Table 1.
The energy band diagram of the analyzed system is analytically implemented in the program based on relations (1) and then used in a numerical model that solves the single-particle (electron) one-dimensional Schrödinger equation. The transmission coefficient through the barrier as a function of energy, , is computed using a stationary study for both directions of the ferroelectric polarization. Then, for each analyzed system, the tunneling current densities are computed using the relation (2) and the TER coefficient is derived as TER = ( – / .
| m* [m0] | EF [eV] | [eV] | [nm] | P [C/m2] | ||
| SrRuO3 | 8.45 | 5 | 3 | 3.6 | 0.075 | - |
| SrTiO3 | 300 | 2 | - | - | - | |
| 0 | ||||||
| BaTiO3 | 125 | 2 | - | - | 0.16 | |
| 3.6 | ||||||
| SrRuO3 | 8.45 | 5 | 3 | 0.075 | - |
A particular feature of the SRO/STO/BTO/SRO system is that the band offset at the dielectric/ferroelectric interface is null, and the built-in voltage is also null because the Fermi energies are equal ( and the electrodes band discontinuities are equal (1 = .
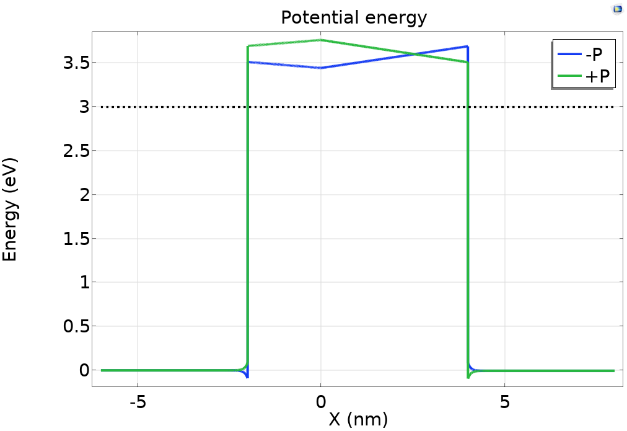
Using the data in Table 1 for the reference system, and assuming constant values for the dimensional and external parameters ( = 4 nm, = 2 nm, = 4 nm, = 0.005 V, = 300 K), the calculated TERref = 37.4. To ensure the accuracy of the results in solving the Schrödinger equation, a convergence analysis of the discretization in space and energy domains was performed, step sizes of 0.0025 nm, and 0.001 eV respectively, were determined as optimal and henceforth used in all simulations.
The relevant characteristics of the reference system under simulation are shown in Figures 2 and 3. They include the barrier profiles for both polarization directions, the supply function, , and the transmission coefficient in tunneling of the electrons through the barrier.
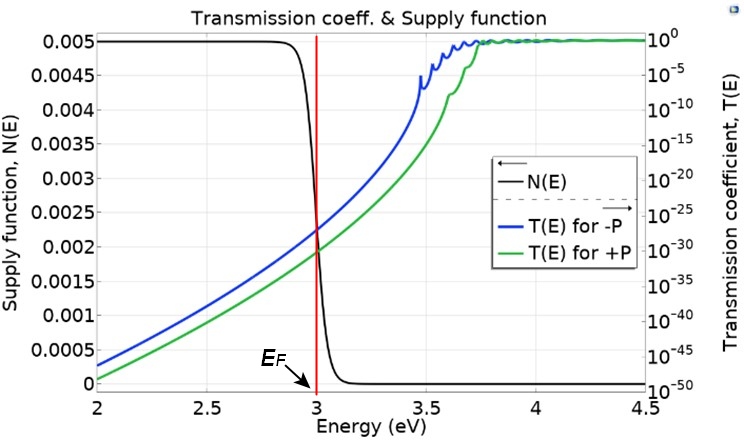
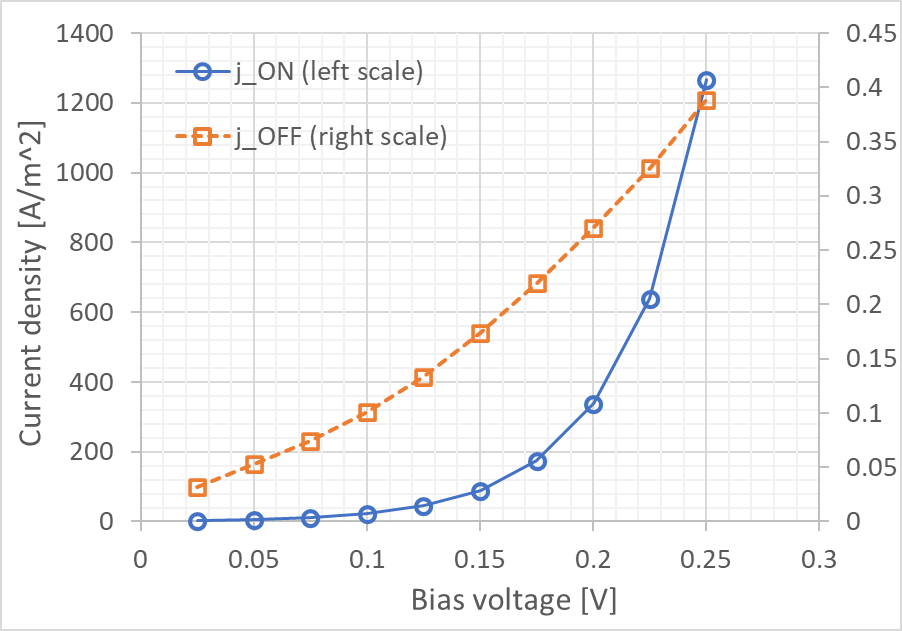
By considering the external bias voltage as a variable parameter in simulations, = 0.025–0.3 V, and TER( curves are also obtained (Figure 4 and 5). However, in the following parametric analyses, we set a fixed lower bias voltage (0.005 V) to keep the Fowler-Nordheim contribution at a low value and thus to highlight the thermal effects that characterize the FTJs behavior at ambient temperature.
Parametric simulations
Once the reference system was fully characterized, we varied the parameters that describe it within limits which encompass realistic ranges of values of a FTJ design. We also note that the variation of a given parameter was done around the reference value and independently of the other parameters.
The full description of a three-interface FTJ model requires a series of parameters used for barrier construction and transport (tunneling) problems. First, one must consider the material and interface properties, as follows:
-
•
the electric polarization, , of the ferroelectric film, considered perpendicular to the FTJ plane in all simulations in this work,
-
•
the Thomas-Fermi screening lengths, 1 and 2, of the electrodes,
-
•
the dielectric constants, , , , , of the electrodes, ferroelectric, and dielectric materials, respectively,
-
•
Fermi energy of the electrodes, and ,
-
•
band offsets at interfaces, , and , or the barriers instead, as , ,
-
•
electron effective masses, , , , , in the electrodes, ferroelectric and dielectric materials, respectively.
Therefore, to characterize the performance of a certain FTJ in the frame of this model, one needs to know the values of 16 material and interface parameters (listed in Table 1). In the case that the electrodes consist of the same material, the number of parameters reduces to 12, since = , , 1 = 2, and = . Apparently, the Fermi energy should be a parameter to be considered variable in our model, but it turns out just as a reference level. Moreover, in this work we deal only with the parameters that describe the barrier shape, so the effective masses of electrons are not varied, which means that only 7 parameters remain. The dimensional parameters, and are separately treated for a given system. The temperature of the simulated system is always considered constant, T = 300 K, if not otherwise specified.
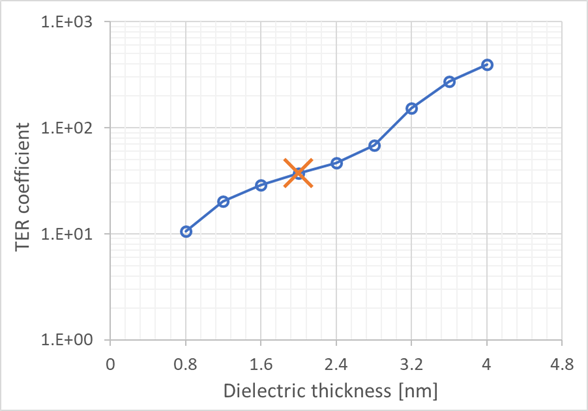
In the following, we present the results of the simulations performed by varying the above-mentioned seven material-based parameters. Lastly, we include the thickness of the dielectric layer, tDE, in our analysis, as a dimensional parameter which plays the most important part in the composite barrier FTJs [3, 4, 5, 14]. On the graphs representing the TER coefficient versus variable parameter, the position of the reference system is graphically marked by a “+” sign and represents the previously calculated value, TERref = 37.4.
Effect of ferroelectric polarization,
The current densities versus polarization curves are plotted in Figure 6(a), and the resulting TER values are shown in Figure 6(b). One may note that a small variation in , from 0.1 to 0.3 C/m2 determines a large TER variation, of two orders of magnitude. However, the jON value for = 0.3 C/m2, at maximum TER, is only 0.1 A/m2 (10-19 A/nm, which could result in small read currents for the sensing circuitry when scaling down the device.
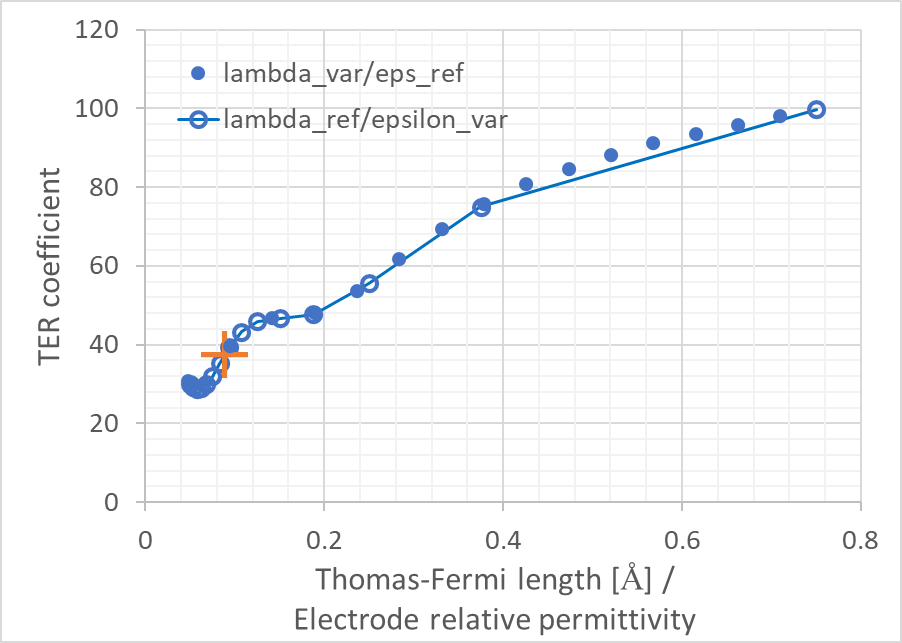
Effect of Thomas-Fermi length and electrode permittivity, /
One may note in Eq. (1) that in the barrier region is dependent on /1, and hence, the representation as a function of this ratio is more meaningful than using individual parameters. Thus, taking /1 as a parameter, we obtain the and TER plots shown in Figure 7(a) and (b). From these data it may be derived that one has to do a trade-off between and 1 values in order to obtain and TER values that are adequate for applications.
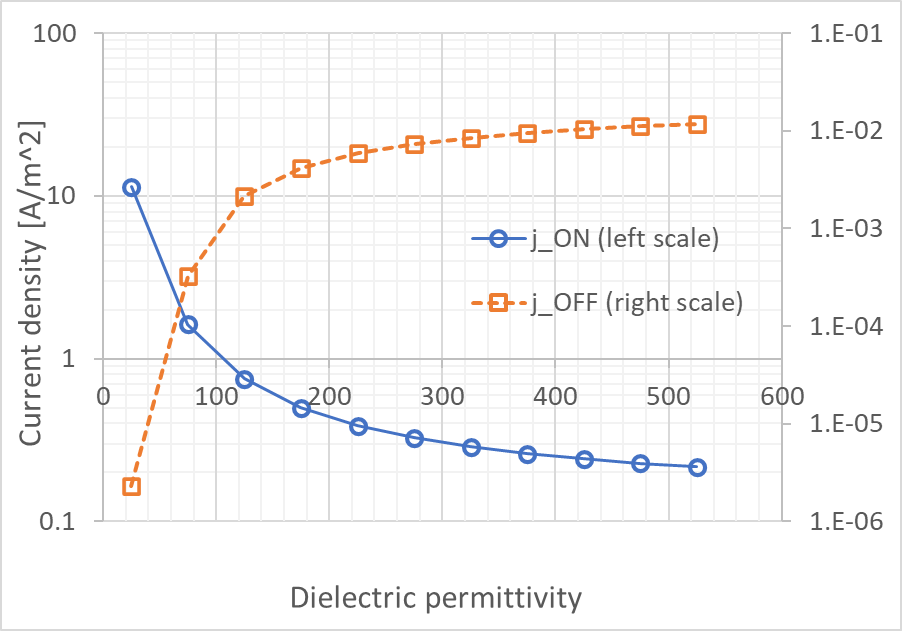
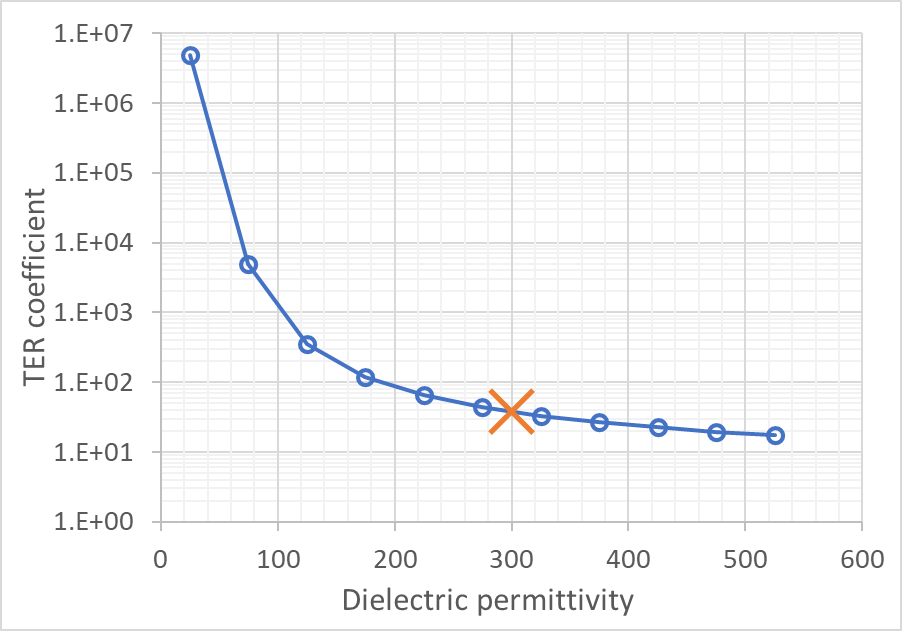
Effect of dielectric permittivity,
Both the current densities and the TER ratio show a strong dependence on DE, for a given value (see Figures 8(a) and (b)). The plots suggest that both and TER may acquire large values when DE is less than 100, in the present case.
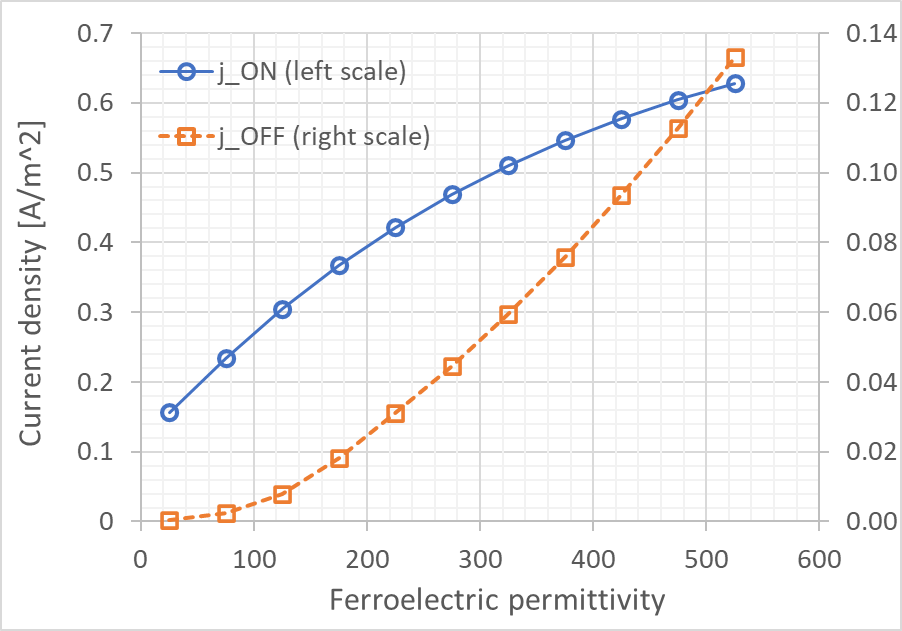
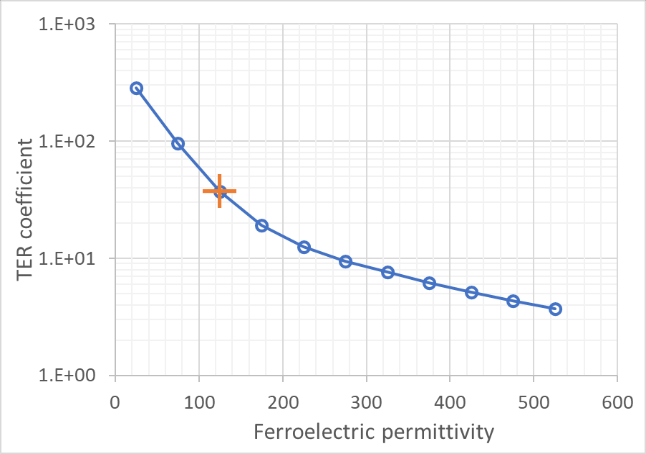
Effect of ferroelectric permittivity,
Similar with the effect discussed at 3.3, the plots in Figures 9(a) and (b) show that parameter has a significant impact on the FTJ performance. The jON and TER versus curves suggest an optimum range of the ferroelectric permittivity between about 50 and 200.
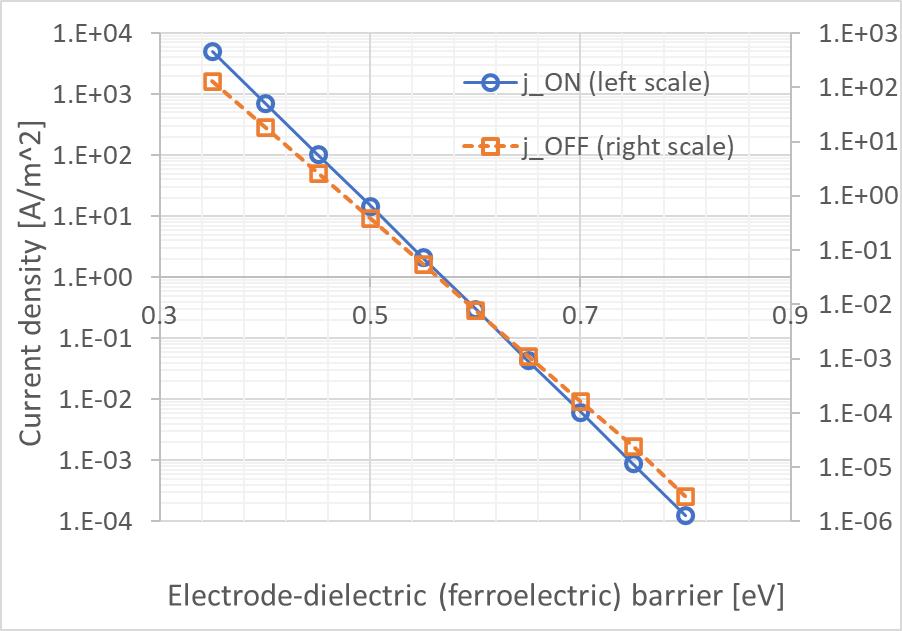
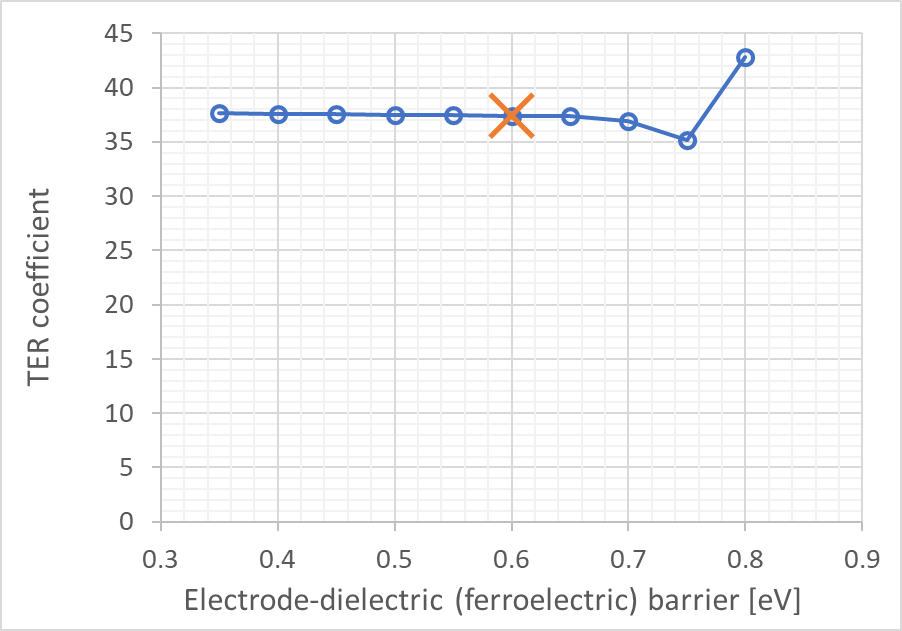
Effect of electrode-dielectric (ferroelectric) barrier,
Although each of the current densities vary about eight orders of magnitude when the energy barriers vary between 0.35 and 0.8 eV, the resulting TER ratio remains rather insensitive and takes small values (see Figures 10(a) and (b)). Because of the practical limitation posed to the lower values of jON, these data show that it may be impractical to increase the band offsets above 0.8 eV.
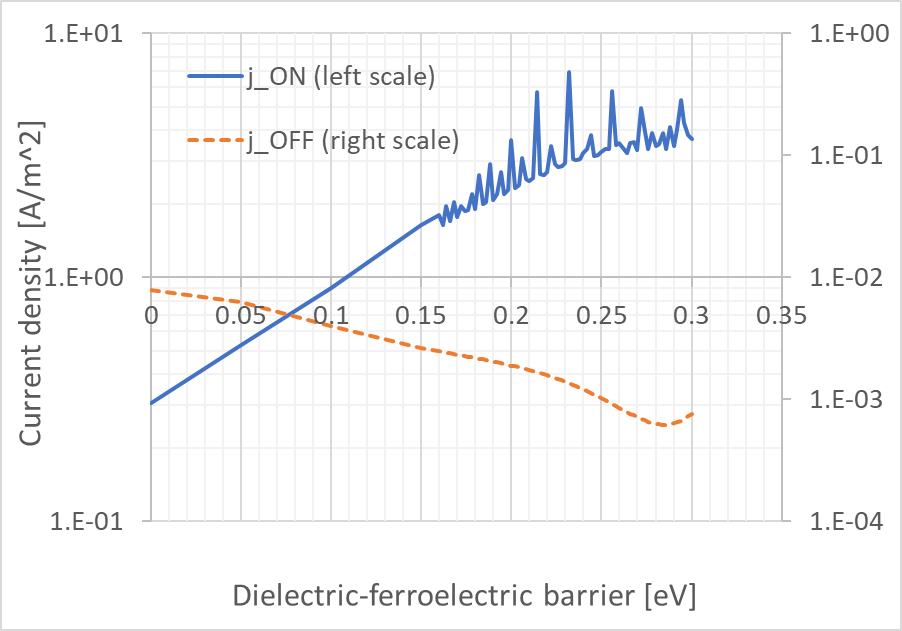
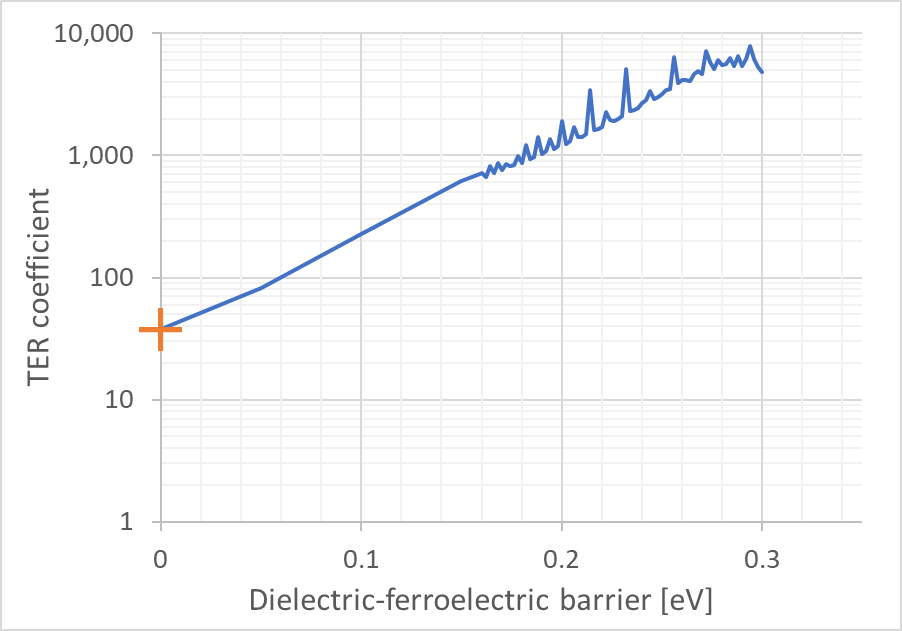
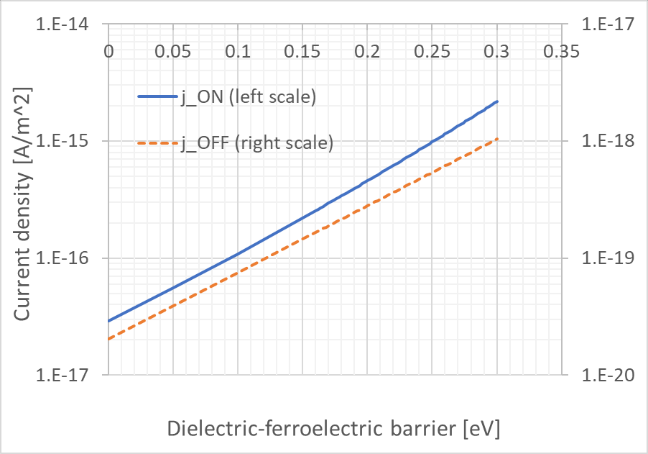
Effect of dielectric-ferroelectric barrier,
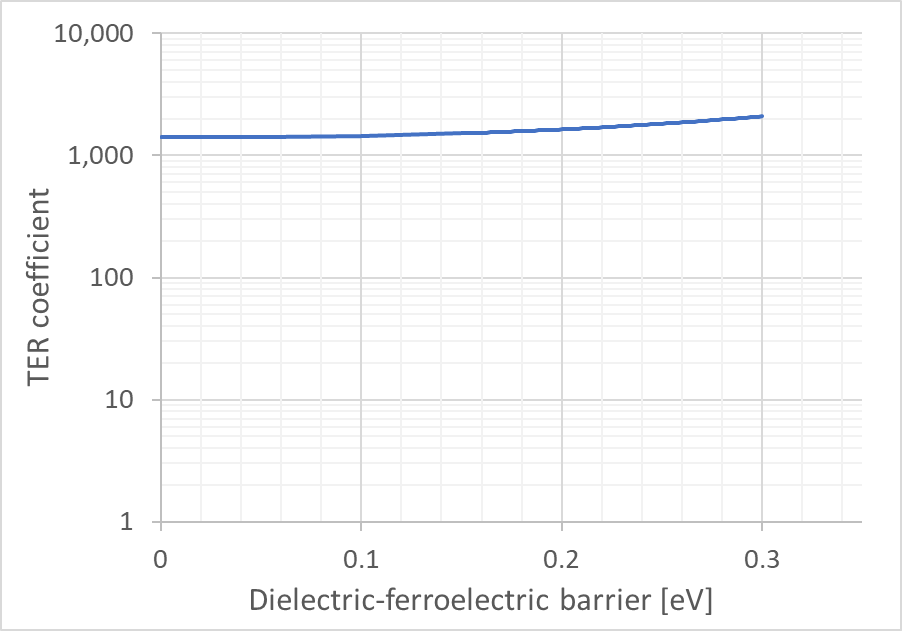
The plots of jON(OFF) versus Uc in Figure 11(a) show that increasing the dielectric-ferroelectric barrier determines a significant increase of jON and a moderate decrease of jOFF, both variations leading to athree orders of magnitude increase in TER (see Figure 11 (b)). Also, one may note the oscillations appearing on the upper part of jON and TER curves. Recently, such features have been related to emerging resonant states at energies above the triangular barrier energy, where Uc is situated, at temperatures up to 300 K [17]. It has also been suggested that such resonances may enhance the thermionic contribution to jON and hence determine the increase of the TER ratio. Recalling that the present simulations have been performed considering ambient temperature, which is of interest for most applications, we have calculated all quantities at 50 K, and the results are plotted in Figures 12(a) and (b). Both jON and jOFF increase by about two orders of magnitude when Uc increases, whereas TER varies only between 1.5103 – 2103. However, the most important result of the simulations at 50 K is the disappearance of the features in jON an TER curves, which supports their assignment to the presence of resonant states at higher temperature, in fair agreement with the findings in [17].
Effect of dielectric thickness,
In this Subsection we present the results which additionally include the potential barriers as function of dimensional parameter (Figures 13(a) and (b)), when the other parameters are fixed to those of the SRO/STO/BTO/SRO reference system. Note that the barrier is independent of and only the transport through the barrier is temperature dependent.
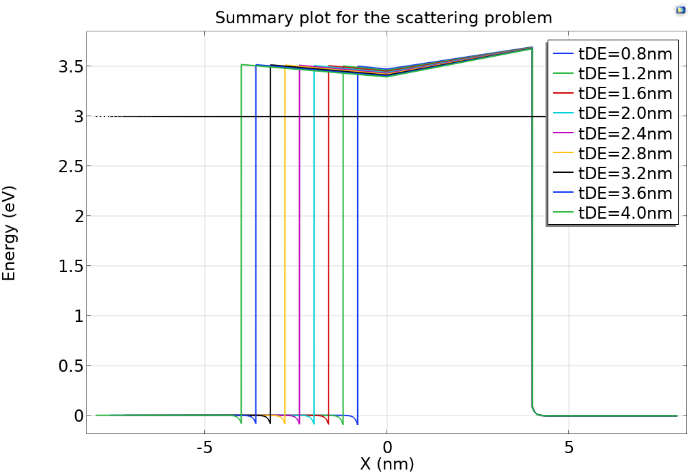
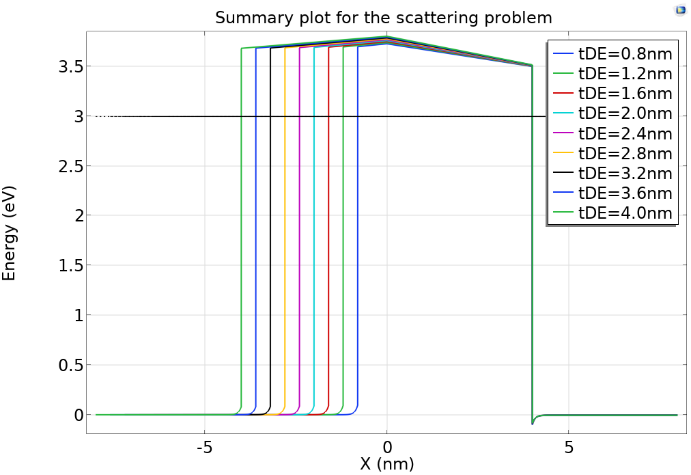
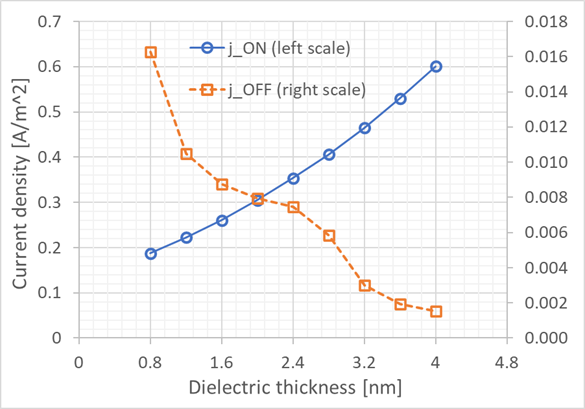
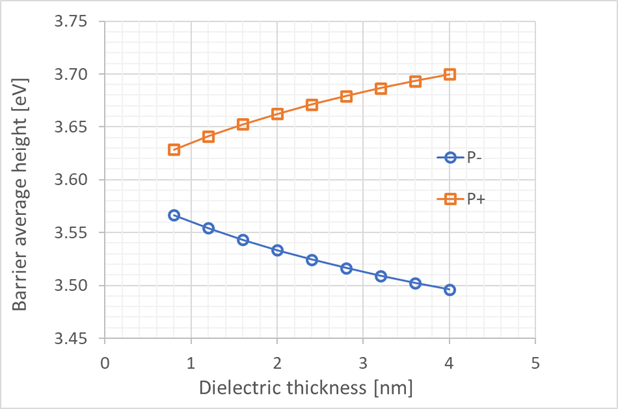
By using the FEM-based approach presented in this paper, the current densities and TER coefficient were simulated at = 300 K (see Figures 14(a) and (b)). One may note an intriguing behavior related to the current density of the ON state, which increases when barrier width substantially increases. However, at the same time, the average barrier height only slightly decreases (Figure 15), which is in apparent contradiction with the direct tunneling theory for a rectangular barrier [25]. However, we underscore that within our model the temperature dependent conduction mechanisms are included, so this behavior should be the result of thermionic conduction mechanism, prevailing at 300 K. Also, these results agree with experimental observations [3].
To verify the statement, the barriers from Figure 13 were averaged, and their heights were used in Simmons equation [25, 26] for calculating the current densities and TER coefficient. Because the Simmons equation is derived at = 0 K, we performed a FEM simulation at = 50 K (see Figure 16(a) and (b)), to allow a comparison of the results.
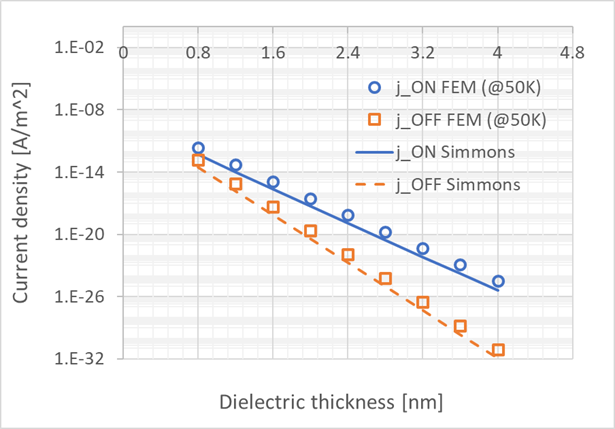
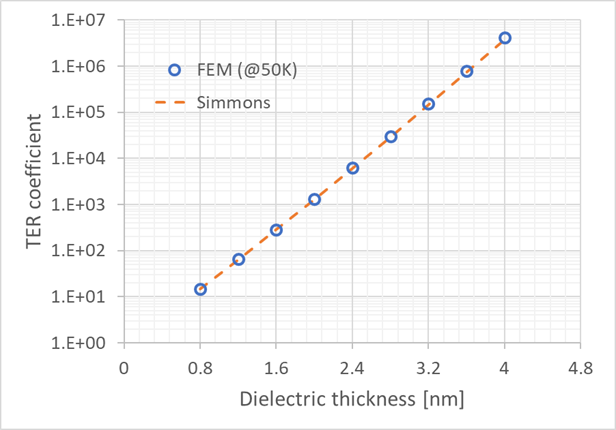
Thus, by comparing the results of FEM simulations and analytical computations (Simmons equation) one may see that the data fit quite well, which indicate that averaging the barriers and using Simmons equation is still a valid approach at T = 50 K. However, at ambient temperatures ( = 300 K), only the FEM simulations are able to predict the FTJ behavior in agreement with experiments, and one can note huge differences in current densities and TER values between 50 K and 300 K.
Discussion
In order to substantiate the results of the various simulations performed in this study we mainly examine their effect on the TER ratio. First, one may note that the variation of the potential barriers at the dielectric/electrode and ferroelectric/electrode interfaces, and , respectively, has a smaller effect, less than 15% on the TER values, but of about seven orders of magnitude on the current densities. This is a non-intuitive outcome, as one could expect a major effect of the height and shape of and on TER, as predicted in the WKB approach previously [4].
Second, the group of parameters that includes the Thomas-Fermi length and electrode permittivity shows a rather significant effect on TER, (Figures 7(a) an (b)). However, in contrast to the two-interface FTJ systems, were the asymmetry due to different Thomas-Fermi lengths dictates the magnitude of TER [13, 23, 27], in the composite barrier system under study, / EL variations have only a moderate impact.
Third, the parameters with really huge impact on the TER value (orders of magnitude) pertain to the remaining group, as follows. Thus, increasing the polarization from 0.1 to 0.3 C/m2 increases TER by two orders of magnitude. The TER versus curve in Figure 6(b) follows an exponential trend, with a good accuracy. The electric permittivities of the dielectric and ferroelectric have similar effects on TER. By decreasing their values one can reach remarkable high TER values, especially in the case of DE (Figure 9(b)). The influence of the dielectric and ferroelectric permittivity on the TER can be physically ascribed to the screening effect on the barrier potential. Consequently, the higher TER values are obtained at low values of dielectric and ferroelectric permittivities (Figures 8 and 9).
The dielectric-ferroelectric barrier, , determines a quite different aspect of the TER curve at energies higher than 0.15 eV, which is the threshold value for which resonance may accommodate in the triangular well at the top of the barrier. The observed oscillations are indicative of the fact that resonances play a significant role in the transport process at high temperatures. However, the oscillations disappear at lower temperature of the system, such as = 50 K (Figures 13(a) and (b)), in support of a resonant mechanism of electron transport at high temperature [17]. We also note that increasing the dielectric thickness determines large increases in jON and TER values at 300 K, (Figures 14(a) and (b)), an effect that we ascribe to a large thermionic contribution to jON via resonance states.
Conclusions
FEM-based simulations using the Tsu-Esaki formula applied to a composite barrier FTJ, under external bias voltage and at room temperature, were performed considering a parametrized model starting from a reference one. The selected reference is SRO/STO/BTO/SRO system, for which a complete data set has been reported in literature. Using a continuum medium model, the current densities (for ON/OFF states) and TER coefficient were computed as a function of seven different material parameters, and a dimensional one (the dielectric layer thickness) each of them being varied in a reasonable range of values.
In our approach, the transport through the barrier problem was solved in principle exactly by using a FEM software tool, revealing that the temperature is important in determining the FTJ’s figure of merit. The importance of temperature is clearly visible when comparing the results obtained by varying the thickness of the dielectric, at 50 K and 300 K, respectively, where one can notice huge differences in current densities and TER values. Also, it is found that analytical computations using Simmons’ equation and averaged barrier heights predict current densities and TER dependences versus tDE in good agreement with the FEM results at 50 K.
The results for the present case show that several configurations with large TER values may be predicted, but at the expense of very low current density in the ON state. Therefore, the FEM simulations can be more valuable than approximate models (direct tunneling, Fowler-Nordheim, and thermionic tunneling) when we are interested in the prediction of FTJ characteristics at temperatures close to 300 K.
We suggest that the present approach may provide useful guidelines in the design of preoptimized FTJs, by choosing appropriate combinations of materials. Also, the method may be implemented in computational schemes for generating training data sets for Machine Learning, if connection to comprehensive materials data bases is ensured.
References
- [1] Esaki, L., Laibowitz, R. B. & Stiles, P. J. Polar switch. \JournalTitleIBM Tech. Discl. Bull. 13, 2161 (1971).
- [2] Zhuravlev, M. Y., Wang, Y., Maekawa, S. & Tsymbal, E. Y. Tuneling electroresistance in ferroelectric tunnel junctions with composite barriers. \JournalTitleAppl. Phys. Lett. 95, 052902 (2009).
- [3] Garcia, A. & Bibes, M. Ferroelectric tunnel junctions for information storage and processing. \JournalTitleNat. Commun. 5, 4289 (2014).
- [4] Velev, J. P., Burton, J. D., Zhuravlev, M. Y. & Tsymbal, E. Y. Predictive modelling of ferroelectric tunnel junctions. \JournalTitlenpj Comput. Mater. 2, 16009 (2016).
- [5] He, J., Ma, Z., Geng, W. & Chou, X. Ferroelectric tunneling through a composite barrier under bias voltages. \JournalTitleMater. Res. Express 6, 116305 (2019).
- [6] Yang, Q. et al. Ferroelectric tunnel junctions enhanced by a polar oxide barrier layer. \JournalTitleNano Lett. 19, 7385 (2019).
- [7] Hwang, J., Goh, Y. & Jeon, S. Effect of insertion of dielectric layer on the performance of hafnia ferroelectric devices. \JournalTitleIEEE Transactions on Electron Devices 68, 22 (2021).
- [8] Mehta, R. R., Silverman, B. D. & Jacobs, J. T. Depolarization fields in thin ferroelectric films. \JournalTitleJ. Appl. Phys. 44, 3379 (1973).
- [9] Franchini, G. et al. Characterization and modeling of current transport in metal/ferroelectric/semiconductor tunnel junctions. \JournalTitleIEEE Transactions on Electron Devices 67, 33 (2020).
- [10] Comsol multyphysics. [Online] http://www.comsol.com.
- [11] Junquera, J. & Ghosez, P. First-principles study of ferroelectric oxide epitaxial thin films and superlattices: Role of the mechanical and electrical boundary conditions. \JournalTitleJ. Comput. Theor. Nanosci. 5, 2071 (2008).
- [12] Stengel, M., Aguado-Puente, P., Spaldin, N. A. & Junquera, J. Band alignment at metal/ferroelectric interfaces: Insights and artifacts from first principles. \JournalTitlePhys. Rev. B 83, 235112 (2011).
- [13] Chang, S.-C., Naeemi, A., Nikonov, D. E. & Gruveman, A. Theoretical approach to electroresistance in ferroelectric tunnel junctions. \JournalTitlePhys. Rev. Applied 7, 024005 (2017).
- [14] Su, J., Li, J., Zheng, X., Xie, S. & Liu, X. Integration of resonant band with asymmetry in ferroelectric tunnel junctions. \JournalTitlenpj Comput. Mater. 8, 54 (2022).
- [15] Ma, Z. J. et al. Enhanced tunneling electroresis-tance effect in composite ferroelectric tunnel junctions with asymmetric electrodes. \JournalTitleMRS Communications 9, 258 – 263 (2019).
- [16] Gruverman, A. et al. Tunneling electroresistance effect in ferroelectric tunnel junctions at nanoscale. \JournalTitleNano Lett. 9, 3539 – 3543 (2009).
- [17] Sandu, T., Tibeica, C., Plugaru, R., Nedelcu, O. & Plugaru, N. Insights into electron transport in a ferroelectric tunnel junction. \JournalTitleNanomaterials 12, 1682 (2022).
- [18] Ando, Y. & Itoh, T. Calculation of transmission tunneling current across arbitrary potential barriers. \JournalTitleJ. Appl. Phys. 61, 1497–1502 (1987).
- [19] Tsu, R. & Esaki, L. Tunneling in a finite superlattice. \JournalTitleAppl. Phys. Lett. 22, 562–564 (1973).
- [20] Tuomisto, N., van Dijken, S. & Puska, M. Tsu-esaki modeling of tunneling currents in ferroelectric tunnel junctions. \JournalTitleJ. of Appl. Phys. 122, 234301–10 (2017).
- [21] Duan, H., Fang, W., Liu, L. & Chen, W. Theoretical study of bilayer composite barrier based ferroelectric tunnel junction memory. \JournalTitleIEEE MTT-S International Conference on Numerical Electromagnetic and Multiphysics Modeling and Optimization (NEMO) 1–3 (2020).
- [22] Guo, R., Lin, W., Yan, X., Venkatesan, T. & Chen, J. Ferroic tunnel junctions and their application in neuromorphic networks. \JournalTitleAppl. Phys. Rev. 7, 011304–20 (2020).
- [23] Banerjee, S. & Zhang, P. generalized self-consistent model for quantum tunneling current in dissimilar metal-insulator-metal junction. \JournalTitleAIP Advances 9, 085302–12 (2019).
- [24] Klyukin, K., Tao, L. L., Tsymbal, E. Y. & Alexandrov, V. Defect-assisted tunneling electroresistance in ferroelectric tunnel junctions. \JournalTitlePhys. Rev. Lett. 121, 056601–4 (2018).
- [25] Simmons, J. G. Generalized formula for the electric tunnel effect between similar electrodes separated by a thin insulating film. \JournalTitleJ. of Appl. Phys. 34, 1793–1803 (1963).
- [26] Chapline, M. G. & Wang, S. X. Analytical formula for tunneling current versus voltage for multilayer barrier structures. \JournalTitleJ. of Appl. Phys. 101, 083706–10 (2007).
- [27] Pantel, D. & Alexe, M. Electroresistance effects in ferroelectric tunnel barriers. \JournalTitlePhys. Rev. B 82, 134105–10 (2007).
Acknowledgements
The authors acknowledge financial support from UEFISCDI Grant No. PN-III-P4-ID-PCE-2020-1985 and from the Core Program 14N/2019 MICRO-NANO-SIS PLUS of the Romanian Ministry of Research, Innovation, and Digitalization.
Author contributions statement
N.P. proposed the research and supervised the project, C.T. designed and performed the calculations, T.S., O.N. and R.P. contributed to theory and data discussion. All authors contributed to the writing of the manuscript.
Additional information
Competing interests The authors declare no competing interests.