Explosive Transitions in Epidemic Dynamics
Abstract
Standard epidemic models exhibit one continuous, second order phase transition to macroscopic outbreaks. However, interventions to control outbreaks may fundamentally alter epidemic dynamics. Here we reveal how such interventions modify the type of phase transition. In particular, we uncover three distinct types of explosive phase transitions for epidemic dynamics with capacity-limited interventions. Depending on the capacity limit, interventions may (i) leave the standard second order phase transition unchanged but exponentially suppress the probability of large outbreaks, (ii) induce a first-order discontinuous transition to macroscopic outbreaks, or (iii) cause a secondary explosive yet continuous third-order transition. These insights highlight inherent limitations in predicting and containing epidemic outbreaks. More generally our study offers a cornerstone example of a third order explosive phase transition in complex systems.
Phase transitions separate qualitatively different collective states emerging in large complex systems [anderson1992infectious, daley2001epidemic, huang2009introduction, wolf1998spontaneous, huang2009introduction, timme2020disentangling, sethna2021statistical]. Many models of complex systems dynamics, for instance the standard susceptible-infected-recovered (SIR) model of epidemic dynamics and models of random percolation, exhibit a single phase transition that often is second order and thus continuous [kermack1927contribution, Hethcote2000mathematics, House2012ModellingEpidemicsNetworks]. For epidemic spreading dynamics, a continuous transition implies that the total number of individuals infected during an epidemic continuously varies with the infectiousness.
Previous research has shown that complex systems may exhibit more intricate and involved collective dynamics and include discontinuous or explosive transitions if the settings become strongly nonlinear, severely constrained or heterogeneous. Examples include a strong dependence of the epidemic transition on the connectivity in structured populations with scale-free interaction topology [eguiluz2002_epidemic, nielsen2020_superspreading], epidemics where treatment options are limited by resource availability [bottcher2015diseaseInducedResourceConstraints] and discontinuous hybrid phase transitions of co-evolving epidemics of two or more diseases [cai2015avalanche, grassberger2016_coninfections]. Recent related results for explosive percolation processes, however, indicate that such explosive transitions might only appear discontinuous in finite size systems but are often continuous with non-standard critical exponents [achlioptas2009explosive_original, nagler2011impact, costa2010explosive, riordan2011explosive, grassberger2011continuous, schroder2013crackling, dSouza2015anomalousExplosivePercolation_review, dSouza2019explosive]. To the best of our knowledge, all phase transitions reported to date, across epidemic models, are standard continuous, second order, or standard discontinuous, first order transitions. In this Letter, we demonstrate that capacity-limited interventions may induce explosive transitions that may appear discontinuous but in fact are third order.
The COVID-19 pandemic has highlighted the importance of interventions such as testing, contact tracing and vaccinations to control the spread of epidemics [scarselli2021discontinuous]. Importantly, the limited capacity of such interventions restricts their capability to contain epidemic outbreaks, especially when the time scales of test or vaccination rates are similar to those of the disease spread and progression. Recent empirical observations and modeling studies [vyska2016complexEpidemicsWithControl, bottcher2015diseaseInducedResourceConstraints, diMuro2018multipleOutbreaksWithVaccination, scarselli2021discontinuous] suggest that interventions may prevent outbreaks or reduce their size, yet total case numbers may rapidly increase once the intervention capacity limit is reached, leading to sudden explosive and apparently discontinuous transitions to large outbreaks. However, the exact type of phase transitions and the mechanisms underlying them remain unclear.
Here, we uncover explosive phase transitions emerging in epidemic models with limited-capacity interventions. We find three distinct types of transitions depending on the scaling of the intervention capacity with the total population size. We clarify the mechanisms underlying these transitions by providing generic arguments under which conditions these transitions emerge, valid for a broad class of models. More generally, our results highlight an example of a third order explosive phase transition in a generic complex system.
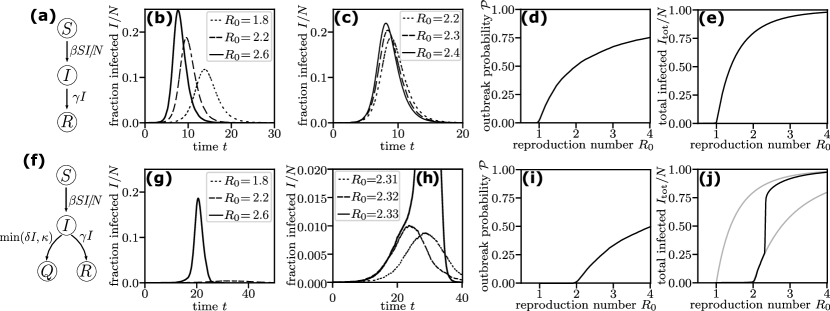
In the standard SIR model, susceptible (S) individuals become infected (I) with rate and are removed or recovered (R) with a rate (Fig. 1a-e). Here, we denote both the states and the absolute number of individuals in that state with capital letters , and . The parameters and describe the infection rate per contact and the recovery rate per individual, respectively. The basic reproduction number quantifies the expected secondary infections caused by a single infected in a fully susceptible population and characterizes the qualitative collective dynamics of the model. If , the number of infected individuals on average exponentially decreases with time . If , it initially increases exponentially. As a result, in the limit of an infinitely large population , a macroscopic outbreak occurs and ultimately affects some positive fraction of the total population, where describes the total number of individuals ever infected. This relative total outbreak size serves as an order parameter, distinguishing the two regimes, and is implicitly given by [House2012ModellingEpidemicsNetworks]
| (1) |
with a solution only above a critical reproduction rate, , compare Fig. 1e.
We modify the standard SIR model to include capacity-limited interventions by adding a single new state (Q) (e.g. quarantine or treatment), see Fig. 1f-j for an illustration of this SIRQ model. In addition to the standard state transitions, infected individuals are removed into a state at an additional rate but at most at a rate , denoting the intervention capacity in units of individuals per time. The microscopic dynamics of both models follow a stochastic process where all transitions occur as independent Poisson processes at their given rates. These dynamics determine the probability of an outbreak when a single individual is initially infected (compare Fig. 1d and i). The macroscopic dynamics in the limit of infinitely large populations, are described by the mean field rate equations
| (2) | |||||
where the lower case letters , and denote the fraction of individuals in the corresponding state, e.g. . These dynamics govern the relative total outbreak size if a macroscopic outbreak occurs. We numerically illustrate our arguments and calculations for parameters for clarity of presentation and vary the infection rate to set .
Compared to the standard SIR model, the interventions shift the critical point because infected individuals are additionally removed into state . Macroscopic outbreaks only occur when (compare Fig. 1e and j). Once the reproduction number even slightly crosses a second threshold , the total number of infected surges dramatically (Fig. 1j). In contrast to the smooth changes with the reproduction number in the standard SIR model (Fig. 1b,c), such explosive transitions may pose major challenges for predictability and control of epidemic dynamics. Small changes such as stochastic number fluctuations in finite size systems or small deviations in the reproduction number may yield large qualitative changes in the epidemic dynamics (Fig. 1h).
Do these capacity-limited interventions create a discontinuous transition in the epidemic dynamics? As long as , infected individuals recover at an effective rate . The expected dynamics of the system are described by an effective reproduction number . Consequently, we expect the critical point above which macroscopic outbreaks occur to be shifted to . If at any time there are more infected individuals, , the effective recovery rate reduces to . To understand how this change affects the epidemic dynamics, we consider the early microscopic spreading dynamics. With a single initially infected individual, the number of currently infected changes by or with each infection or recovery event, respectively. The probability for each event is proportional to the rates of the respective state transitions. Even if the number of infected should decrease on average and we would expect the epidemic to die out, there is a non-zero probability to reach any number of currently infected . The early dynamics if ever becomes larger than is thus equivalent to the Gambler’s Ruin threshold crossing problem, see [supp] for a more detailed description. In the following, we reveal three distinct phase transitions depending on the scaling of the intervention capacity with the population size, .
Constant intervention capacity.
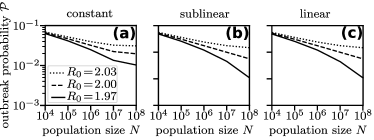
For constant , the system exhibits some positive probability of reaching . While this probability is exponentially suppressed with increasing intervention capacity , the interventions cannot completely prevent outbreaks. Once the number of infected becomes sufficiently large, the constant intervention rate becomes negligible compared to the natural recovery rate and the system behaves like a standard SIR model without interventions. Consequently, macroscopic outbreaks occur with positive probability as soon as , similar to the standard SIR model, but the outbreak probability is exponentially suppressed with the intervention capacity (Fig. 2a). The macroscopic dynamics of the outbreaks that do occur is determined by the rate equations (2). The size of an outbreak (when it does occur) is thus the same as in the standard SIR model (compare Fig. 3a,b).
Sublinear intervention capacity.
For sublinearly scaling intervention capacity with , the same argument for the microscopic dynamics applies. However, now the threshold value grows with the population size. Thus, the probability for the outbreak to grow beyond this threshold becomes zero in the large population limit as long as the effective reproduction number , i.e. as long as . Only then can macroscopic outbreaks occur with a finite probability (Fig. 2b). When a macroscopic outbreak does occur, the intervention rate becomes negligible since it scales sublinearly with the population size, as . The dynamics is equivalent to the standard SIR model. Consequently, we observe a discontinuous transition of the outbreak size at (Fig. 3c,d).
Linear intervention capacity
For linear intervention capacity with constant , the dynamics become more intriguing. Again, the same argument for the microscopic dynamics applies as for the sublinearly scaling intervention capacity. Macroscopic outbreaks are only possible for (Fig. 2c). However, sufficiently small macroscopic outbreaks do not immediately exceed the intervention capacity threshold , and remains smaller than during the outbreak. We thus observe a continuous second order transition equivalent to an SIR model with recovery rate . Only if the reproduction number is larger than a second critical value, , the concurrently infected exceed the threshold during the outbreak and a second transition occurs.
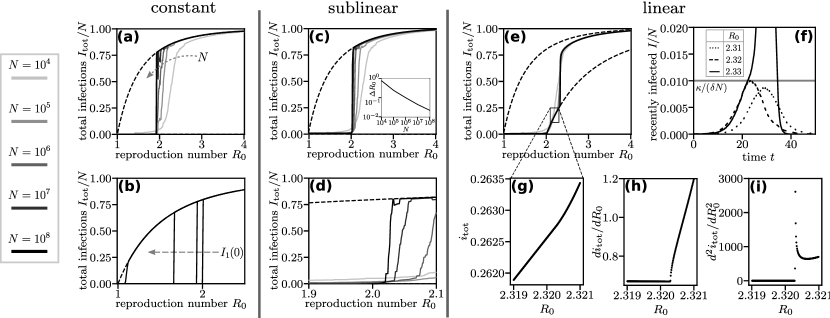
To reveal the type of the second transition, we compute the scaling of the number of additionally infected when the intervention capacity is overwhelmed. We here sketch the main steps in the argument, a step-by-step calculation is provided in the Supplemental Material [supp]. We focus on the time at which the number of infected first exceeds the threshold , or equivalently . Until , the dynamics are identical to a system with infinite intervention capacity with infected. Exactly at both and its first derivative are still the same as for infinite intervention capacity [Eq. (2)], but the second derivative changes to the right of . Compared to a system with infinite intervention capacity we thus find
| (3) | |||||
However, the number of infected remains above the threshold only for a short time , following from the quadratic expansion around the maximum of which increases linearly with (see Supplemental Material [supp] for details). We then find the leading order scaling of the additional infections by integrating the additional infection rate for the time , resulting in a leading order correction proportional to . Secondary infections enter only as higher order corrections. We thus find that the second derivative of is discontinuous at and the transition is sudden, yet third order, and thus surprisingly even smoother than the second order transition at (Fig. 3e-i).
The above explanations remain qualitatively valid for a broad class of systems since they only rely on scaling arguments to understand the impact of the limited intervention capacity on the microscopic dynamics and generic leading order behavior for the effect on the macroscopic dynamics. Our argument only requires that: (i) The system exhibits non-trivial outbreak dynamics even with infinite intervention capacity, ensuring that outbreaks exist in the first place if the intervention capacity scales with the population size. (ii) The intervention capacity enters the macroscopic dynamics as a hard limit such that the derivative of is continuous but not differentiable when the number of infected overwhelms the intervention capacity [compare Eq.(2)]. We provide a range of simple and more complex model variations illustrating these conditions and the robustness of the reported transitions in the Supplemental Material [supp].
Overall, our results offer a novel perspective on epidemic containment with capacity-limited countermeasures. The different types of explosive transitions to large outbreaks present different challenges for the predictability and control of epidemic dynamics. This applies in particular to the evaluation of containment measures across cities or countries when the intervention capacity depends on the population size. They also highlight the option of novel types of simultaneously explosive as well as third order phase transitions in complex systems in general.
We acknowledge support from the Volkswagen Foundation under Grant. No. 99 720 and the German Federal Ministry for Education and Research (BMBF) under grant number 16ICR01. This research was supported by the Deutsche Forschungsgemeinschaft (DFG, German Research Foundation) under Germany´s Excellence Strategy – EXC-2068 – 390729961– Cluster of Excellence Physics of Life of TU Dresden.