Precision measurements of the zero temperature dielectric constant and density of liquid 4He
Abstract
The resonant frequencies of three-dimensional microwave cavities are explicitly dependent on the dielectric constant of the material filling the cavity, making them an ideal system for probing material properties. In particular, dielectric constant measurements allow one to extract the helium density through the Clausius-Mossotti relation. By filling a cylindrical aluminum cavity with superfluid helium, we make precision measurements of the dielectric constant of liquid 4He at saturated vapor pressure for range of temperatures 30 – 300 mK and at pressures of 0-25.0 bar at 30 mK, essentially the zero temperature limit for the properties of 4He. After reviewing previous measurements, we find systematic discrepancy between low and high frequency determination of the dielectric constant in the zero-temperature limit and moderate discrepancy with previously reported values of pressure-dependent density. Our precision measurements suggest 3D microwave cavities are a promising choice for refining previously measured values in helium, with potential applications in metrology.
I Introduction
Three dimensional (3D) microwave cavities are an important tool for the physicist. For example, they are used as accelerating cavities in particle colliders [1] and are often used in combination with transmon qubits [2, 3] — one of the most promising qubit architectures. One reason for the ubiquity of the 3D microwave cavity is that the open structure allows the electric and magnetic fields to reside in a material-free volume, reducing dissipation from lossy materials [4, 5]. This can be compared with on-chip microwave cavities, where substrate loss from two-level systems [6, 7, 8] generally dominates. Furthermore, the open structure allows for the incorporation of materials into the microwave cavity [9, 10] making 3D cavities a valuable tool for precision measurements of material properties [11, 12].
Incorporating superfluid 4He with microwave systems is beneficial for multiple applications. Filling a 3D microwave cavity with superfluid helium allows easy tunability of the cavity frequency [13], and improves thermalization of superconducting qubits [14]; superfluid helium, when coupled to a microwave optomechanical system, is a promising mechanical medium for proposed detectors of gravitational waves [15, 16, 17] and dark matter [18]; and allows novel studies of 2D electron systems [19], including a design of new type of qubit [20].
Here, we use a 3D microwave cavity for a precision study of the dielectric constant and density of superfluid 4He in the low temperature limit. Using the Clausius-Mossotti relation, the dielectric constant measurements can be interpreted as measurements of the helium density, in a manner essentially similar to approaches such as dielectric constant (or refractive index) gas thermometry [21, 22]. The ability to resolve small frequency shifts in the high- microwave cavity allows this to be done with precision comparable to – or exceeding – the state-of-the-art capacitance measurements [23, 24, 25, 26, 8]. Interestingly, for temperature dependence of the dielectric constant, we find a systematic discrepancy between low (capacitive) and high (microwave resonance) frequency determination of the dielectric constant which cannot be accounted for by frequency dependence of the polarizability. For a particular choice of polarizability of helium [22], we find good agreement with commonly used literature values [27, 28] of pressure dependence of the low-temperature density and the speed of sound. We find the largest sources of uncertainty to originate in the value of the molar polarizability of liquid helium and complex deformation of the cavity in a pressurized bath.
II Theory
The helium density was calculated by measuring the resonant frequency of a cylindrical microwave cavity, which will have standing-wave modes determined by Maxwell’s equations. For a right cylinder with height and radius , the resonant frequencies for transverse electric (TE) modes, where with the axis of the cylinder, are given by [29]
| (1) |
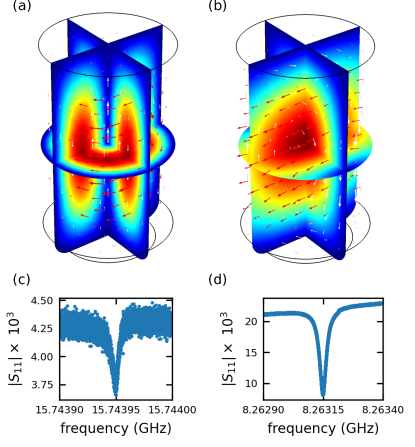
where is the th zero of the derivative of the th Bessel function of the first kind, is the speed of light, and , are the relative permeability and permittivity, respectively, of the material filling the cavity. In particular, we are interested in the TE011 and TE111 modes, pictured in Fig. 1. Particularly for the mode TE011, since the electric field vanishes at all surfaces for this mode, dielectric and seam losses are negligible, and only conductor losses contribute [30]. This results in a low loss rate and hence a high-quality mode, capable of achieving internal quality factors on the order of 108 for high-purity aluminum cavities [4].
When filling a microwave cavity with superfluid helium, only the relative permittivity of the material inside the cavity changes, and the filled resonant frequency will be reduced from the in-vacuum resonant frequency by the relation
| (2) |
where is the dielectric constant of superfluid 4He. This allows us to directly calculate the dielectric constant by comparing measurements of the filled and in-vacuum resonant frequencies as
| (3) |
This expression, however, needs to be corrected for finite compressiblity of the cavity walls (see (10) below).
The dielectric constant and density are related through the Clausius-Mossotti relation
| (4) |
where is the polarizability volume per mole (shortened to ‘polarizability’ henceforth), is the molar mass of 4He and is the density 111The polarizability volume per mole is related to the molecular polarizability (per mole) . In dielectric constant gas thermometry literature (e.g., [22]) the common definition of polarizability is ..
Finally, given a pressure dependence of the density, the long-wavelength limit of the speed of sound is
| (5) |
III Experimental setup
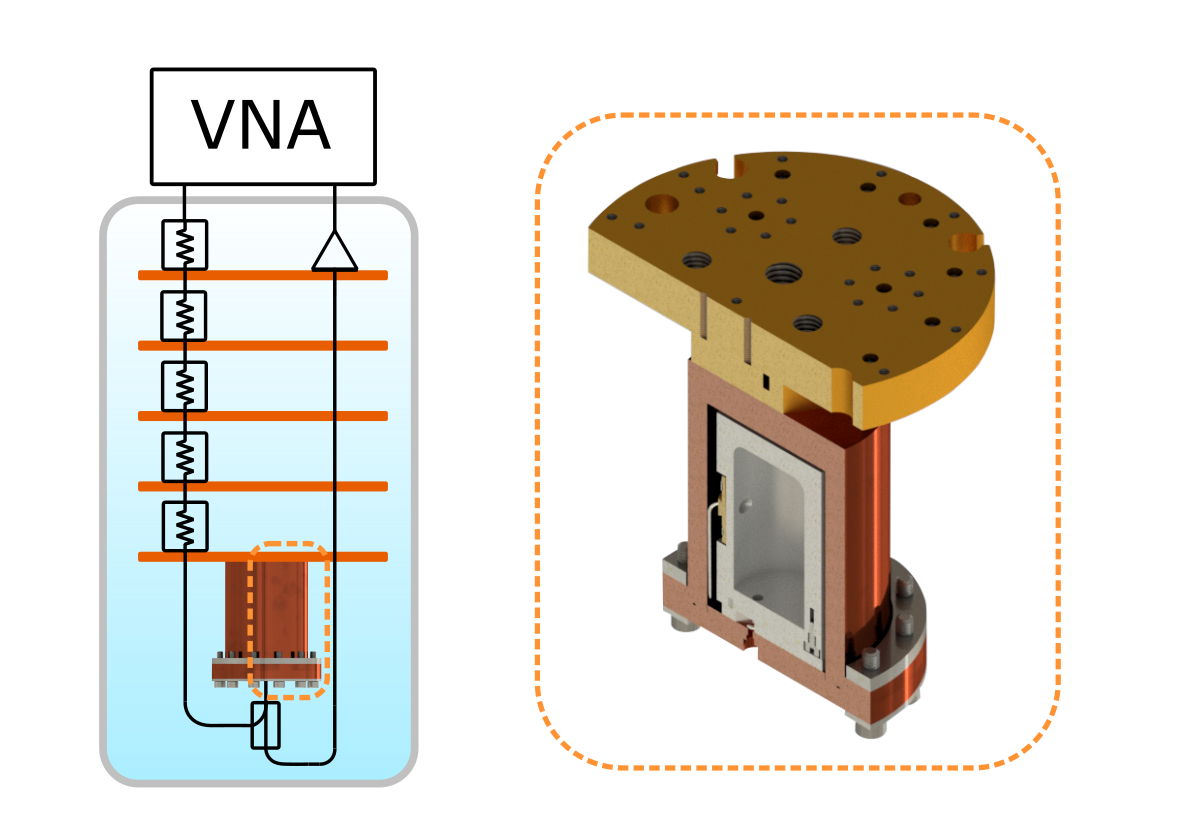
The dielectric constant was measured using a superconducting cylindrical aluminum microwave cavity cooled to approximately 30 mK using a dilution refrigerator, as schematically shown in Fig. 2. The cavity was machined to be 2.4 cm in diameter and 4 cm tall at room temperature, for an approximate total volume of 18 cm3. The cavity was designed to operate in the TE011 and TE111 modes, with a measured resonant frequencies of 15.74 GHz and 8.26 GHz, respectively, for mK. For our cavity machined out of 6061 aluminum, we measured an internal quality factor at 30 mK of 2 106 for TE011. Higher quality factors could be achieved with pure aluminum or niobium [4, 32]. The TE011 mode of a perfectly cylindrical cavity is degenerate with the low- TM111 mode. To break this degeneracy, a 1-inch-radius fillet was added to the bottom edge of the cavity. The microwave cavity was placed inside a hermetically sealed copper cell, as shown in Fig. 2 (b). This design allows helium to freely flow in and around the microwave cavity such that there are no pressure differentials across the walls of the cavity. This eliminates the possibility of the cavity bowing under high pressures, which can shift the resonant frequency of the cavity considerably, as was seen in past measurements [13].
The complex-valued reflection from the cavity is fit to the expected frequency dependence of the scattering parameter [33]
| (6) |
where is the resonance frequency, characterizes impedance mismatch and , and characterize the overall loss, delay and phase rotation due to wiring and amplification within the cryostat [33]. The total quality factor is given by where is the external quality factor characterizing the coupling to the microwave mode and is the internal quality factor due to all other dissipation processes [33].
The cavity was coupled to using a pin coupler, which was aligned parallel to the electric field of the TE011 mode. By adjusting the length of the pin coupler, we decreased the coupling such that the external quality factor was at base temperature. This meant that the total cavity quality factor was almost entirely limited by internal losses, allowing for maximum precision in our measurements.
To take measurements in the zero-temperature limit, the cell was mounted on the mixing chamber plate of a dilution refrigerator. The resonant modes were measured using a vector network analyzer (VNA), in an RF circuit shown in Fig. 2 (a). At each stage of the dilution refrigerator, attenuators were used to heat sink the microwave coaxial line, attenuating the signal a total of 24 dBm. A directional coupler with 10 dB of attenuation was used to transmit the microwave power to and from the cavity. The reflected signal was then amplified through a low noise amplifier at the 4K stage of the refrigerator and returned to the VNA.
The temperature of the mixing chamber was measured using an ultra-low-temperature ruthenium oxide sensor and controlled through an AC resistance bridge. Close to the base temperature, we were able to achieve temperature stability of 0.5 mK, while at higher temperatures ( mK), temperature stability decreased to 1 mK. The pressure of the helium inside the cell was set using a homemade control system, which consists of a ballast volume immersed in liquid nitrogen with a resistive heater controlled by a PID loop. The stability of the pressure measured at room temperature was about 1 mbar.
Once at base temperature ( mK), measurements of both TE011 and TE111 modes were taken in vacuum over several days to ensure that the resonant frequency was stable. The resonant frequency was observed to shift no more than a few hundred Hz (i.e., less than 1 ppm), which is within the precision of the fitting method used. The cavity was then filled with helium, and measurements were taken first at saturated vapor pressure (SVP), and then pressurized up to 25 bar. For each pressure, 200 traces of the signal were taken for both modes, which were individually fit using (6) to find the resonant frequency and its standard deviation. The pressurized density was measured during two cool downs of the dilution refrigerator. These data sets will be referred to as Run 1 and Run 2.
IV Drive Power Analysis
To ensure that the drive power would not heat the cavity, the effect of the VNA drive power was measured for the cavity while in-vacuum, filled to SVP, and pressurized to 25.0 bar. In each set of measurements, the drive power at source was varied from -20 to 0 dBm (0.01 to 1.00 mW), and the resonant frequency of the TE011 mode was measured.
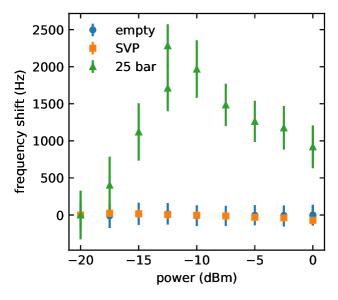
Fig. 3 shows the resonant frequency of the TE011 mode for powers between 0 and -20 dBm while in-vacuum, filled to SVP, and pressurized to 25 bar. Heating of the cavity ought to correspond to decrease of the resonance frequency [30], which is observed weakly for the empty and SVP data. The origin of the peak in frequency shift for the 25 bar data is unknown, but it is unlikely to be related to the heating of the cavity itself. Nevertheless, even at the peak, the relative frequency shift is small and we use -10 dBm drive power which we find to be a good compromise between low-pressure heating and signal-to-noise ratio. However, to account for power-dependent frequency shifts we include an additional 100 Hz error on resonance frequencies measured at saturated vapour pressure (the data in Sec. VI.1) and additional 2500 Hz error on all resonance frequencies measured at increased pressures (the data in Sec. VI.2).
V Corrections due to systematic errors
The low temperature density of 4He was measured in the range 0.5-25.0 bar. While at 30 mK, the cell was pressurized in steps of 1 bar. Measurements were taken while ramping up the pressure from 1.0-25.0 bar, and then ramping down the pressure from 24.5-0.5 bar. There are multiple known sources of systematic error related to the pressure that may affect our measurements. Here we identify and correct for the following: 1) a hydrostatic pressure head, 2) superfluid fountain pressure, and 3) compression of the aluminum cavity.
-
1.
A hydrostatic pressure head arises from excess liquid helium in the fill line a height above the microwave cavity. This will not affect the measured frequency, but will shift the pressure in the cell from what is measured at room temperature to
(7) where is the acceleration due to gravity.
Since the level of helium in the dewar surrounding the dilution unit is not constant, the level of liquid helium in the cell fill line will fluctuate, changing the hydrostatic pressure head. We estimate that the liquid level will vary between 59 and 79 cm above the cavity. We correct our data for a hydrostatic pressure head of height cm, but consider the 59-79 cm range as one component of the uncertainty of the pressure reading.
-
2.
When two reservoirs of He-II at different temperatures are connected via a thin channel that does not admit the flow of the viscous normal fluid component, a pressure difference develops according to
(8) where is the specific entropy [34]. The helium fill line of the cell passes through sintered copper heat exchangers on each stage of the dilution refrigerator that strongly restrict the flow of helium. Assuming that the effect is negligible below the temperature of the still ( 0.8 K) we assume that the pressure drop is dominated by the temperature gradient across the heat exchanger at the 1 K pot ( 1.45 K), i.e.,
(9) which has to be subtracted from the pressure measured at room temperature to obtain the correct cell pressure. Here, for and , HEPAK dataset was used [35] and the influence of the pressure gradient on the material parameters and was neglected. The resulting fountain pressure correction is shown in Fig. 4.
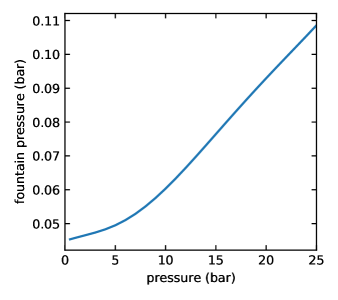
Figure 4: Pressure difference between two ends of a superleak due to the fountain effect calculated using (9). End temperatures are assumed to be 0.8 K and 1.45 K. -
3.
As the pressure of the helium increases, the cavity frequency will also be affected by deformation of the cavity itself. Assuming small elastic deformation, all cavity dimensions (i.e., radius and height ) will be re-normalized to where is the pressure, the bulk modulus of the cavity material and is the cavity dimension at . The dielectric constant corrected for deformation is thus (cf. Eq. (1))
(10) The bulk modulus is related to the Young’s modulus through , where for Al the Poisson ratio . The value of the Young’s modulus of Al alloy 6061 at low temperatures reported in the literature varies in the range [36, 37] 77.7 – 78 GPa. Error estimates are generally not available. Conservatively, we chose GPa. The uncertainties of pressure, , and are propagated into the uncertainties shown below. Yield stress of 6061 is in the range of 350 MPa [36], making corrections due to plastic deformation under our highest applied pressure, approximately 2.5 MPa, negligible.
Finally, a significant source of uncertainty for calculating the density from the measured frequency shift and dielectric constant using (4) is the value of the polarizability of liquid 4He. Various values for the molar polarizability have been obtained [38, 39, 24, 35, 12] which disagree on the level of about 0.1%. For helium in the gas phase, the value of the polarizability is known to satisfactory precision with ppm-level agreement between experiment [22] and ab-initio theory [40]. However, due to inter-atomic interactions, the Clausius-Mossotti equation requires a virial expansion [41, 42], suggesting that the value of effective polarizability of the liquid used in (4) will likely differ from the polarizability of individual atoms [43, 44].
Despite these difficulties, we believe the currently available low-density value of polarizability is the most reliable. In the following, we calculate density and speed of sound using the polarizability measured with a dielectric constant gas thermometer near the triple point of water [22], which produces the best absolute agreement with previously accepted values of density [28, 27] without the necessity of explicitly correcting using external reference [26].
VI Results
VI.1 Temperature dependence of the dielectric constant at saturated vapor pressure
The temperature dependence of the dielectric constant has been measured in the past, but few have measured it in the low temperature limit. Chan et al. [45] measured the dielectric constant using a parallel plate capacitor in the range 100-1200 mK. They obtained their value for the dielectric constant at zero temperature by extrapolating their data using
| (11) |
Only Berthold et al. [12] have directly measured the dielectric constant at SVP in the low temperature limit. Their method was similar to ours — they measured the resonant frequency of the TE011 mode of a cylindrical niobium cavity. They do not report an exact temperature, saying only that their measurement was taken below 100 mK. The most recent measurement of the dielectric constant was made by Niemela & Donnelly [25], who only measured the dielectric constant above 1 K, but extrapolated to zero temperature using empirical formulas.
We measured the dielectric constant at saturated vapor pressure (SVP) during Run 2 using the TE011 mode. This was done by slowly filling the cell while watching the frequency shift using the VNA. Once the frequency stabilized, the cell was assumed to be filled, and the filling was halted by closing a room-temperature valve in the gas handling system. This method leads to some uncertainty in the height of the helium above the cell, which would increase the pressure in the cell from SVP by an unknown amount. Assuming the pressure head is no more than 1 cm above the cavity, the pressure would be increased by at most bar. The temperature was increased in steps of 25 mK from 30-330 mK, and the shift in the resonant frequency was measured. This data was then compared to in-vacuum data at the same temperature through Eq. 2.
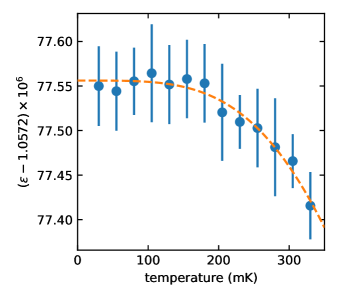
Figure 5 plots our calculated dielectric constant at SVP as a function of temperature. Following Chan [45], we fit our data to Eq. 11 (orange dashed line in Fig. 5), finding the zero-temperature dielectric constant and the fitting parameters and to be
The uncertainties were estimated using a Monte-Carlo method, where multiple datasets were generated by drawing a random sample for each temperature from a normal distribution centered on the experimental mean and with variance equal to the square of the experimental error estimate. Each generated dataset was fit using (11); the values shown above are the averages and standard deviations of a set of the individual fit parameters. The procedure was repeated for sufficiently high number of samples such that the estimates of values and their error have converged. The large uncertainties on and are due to weak temperature dependence of in the range accessible to the present experiment, which results in a poorly conditioned fit.
Table 1 summarizes the values for the zero-temperature dielectric constant obtained by several studies. Kierstead [39] and Harris-Lowe and Smee [24] extrapolated high temperature data to obtain a zero-temperature value. Note in Tab. 1 that the value of zero-temperature dielectric constant obtained here is systematically higher, and outside of estimated error bars, than previously reported values measured using helium-filled capacitors but in excelled agreement with ref. [12], the only other work measured using a microwave cavity. The reason for this relatively large and apparently systematic discrepancy between low-frequency and high-frequency estimation of the dielectric constant is at present unknown, since the relative change in polarizability between DC and 15 GHz is expected to be negligible, on the order of [40].
| Authors | method | |
|---|---|---|
| Niemela and Donnelly [25] | capacitance | 1.057255 |
| Chan et al. [45] | capacitance | 1.0572190(5) |
| Kierstead [39]222Extrapolated to zero-temperature by Chan et al. | capacitance | 1.0571374(10) |
| Harris-Lowe and Smee [24]a | capacitance | 1.0572467(100) |
| Tanaka et al. [26] | capacitance | 1.0572025 |
| Berthold et al. [12] | cavity | 1.0572784(5) |
| Current authors | cavity | 1.05727755(2) |
VI.2 Pressure dependence of dielectric constant and density.
The corrected results for the low-temperature pressure-dependent dielectric constant are shown in Fig. 6. This includes data taken over two separate runs, using two different microwave modes, increasing and decreasing pressure ramp, and a separate measurement at saturated vapour pressure.
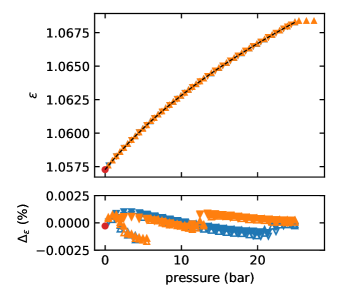
Since the calculation of density from the dielectric constant depends on polarizability, which is not presently known with sufficient accuracy for liquid helium, we adopt an approach common in dielectric constant gas thermometry [22] and fit the pressure dependence of the Clausius-Mossotti parameter (the proportionality assumes that the polarizability is density-independent) using a 3rd degree polynomial
| (12) |
where are fit parameters. To account for measurement errors in both pressure and dielectric constant, (12) was fit to the data using orthogonal distance regression weighted by the estimated uncertainties of the individual measurements of pressure and [46]. The errors of the fit parameters were estimated by bootstrap [47]. The resulting parameter values are
To invert (12) and obtain the (and ) relationship a standard root-finding algorithm is employed. The relative residuals are shown in the bottom panel of Fig. 6. In the plot of the residuals, there are two distinct jumps in the data. The first jump occurs in both runs at 5 bar while increasing the pressure, but does not follow the same behavior while decreasing the pressure. The second jump happens at higher pressures, 13 and 21 bar for Run 1 and Run 2, respectively, and the jump in resonant frequency is observed both while increasing and decreasing the pressure. By taking multiple data sets, we have shown that these jumps are repeatable at similar pressures.
We suspect that these jumps are caused by mechanical slipping - the cavity lid or pin coupler may shift at certain pressures, causing the resonant frequency to shift since the effective volume of the cavity has changed. Berthold et al. [12] observe a similar effect, stating that mechanical shock arising from the opening and closing of valves in their system can cause a frequency shift of up to 1 kHz in their cylindrical microwave cavity.
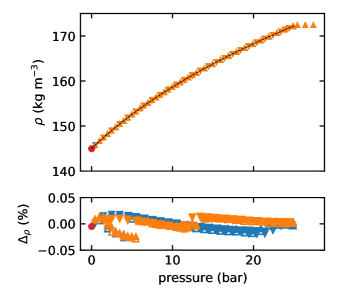
We calculate the density from with Clausius-Mossotti equations (4) using the polarizability determined through a helium-based dielectric constant gas thermometer near the triple point of water cm3 [22]. The resulting density and relative residuals are shown in Fig. 7. The residuals are calculated with respect to the density calculated from the fit of (12).
The calculated density crucially depends on the chosen value of polarizability. The pressure dependence of density is tabulated by Brooks and Donnelly [27], who derived values from the functional form reported by Abraham et al. [28]. Tanaka et al. [26] later made capacitive measurements of the helium density, producing their own functional form. The comparison of these two past experiments with present data is shown in Fig. 8 using three different values of polarizability . We see that depending on the choice of polarizability, the typical deviations are quite significant and in the range 0.1% – 0.5%. Note, however, that the apparent low-pressure agreement between Abraham et al. [28] and Tanaka et al. [26] is artificial, since both of these experiments measured only relative change in density with respect to the zero-temperature, zero-pressure limit value . In both cases, kg m-3 was chosen, which was obtained by Kerr and Taylor [23], who measured changes in density with respect to a reference point near 1.2 K for which an error bar was not specified and then extrapolating a fit below approximately 1 K [23].
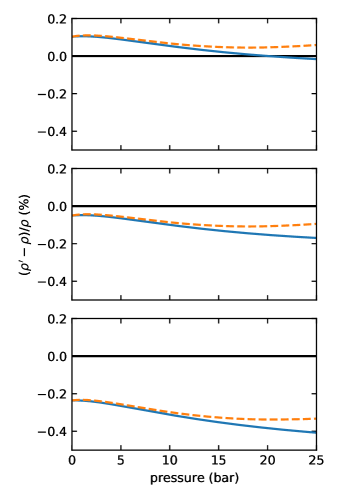
While the low-pressure value of has a fairly weak empirical basis and uncertainties in the polarizability complicate absolute comparisons, it is clear from Fig. 8 that pressure dependence differs among the experiments. In the present case, the largest uncertainties are likely due to cavity deformation which is not captured accurately enough using elastic compressibility. Another issue might arise in the neglected viscous flow through the heat exchanger in the calculation of the fountain pressure correction (9). These issues can be mitigated in future experiments, for example, using cryogenic valves and mechanically stronger cavity materials.
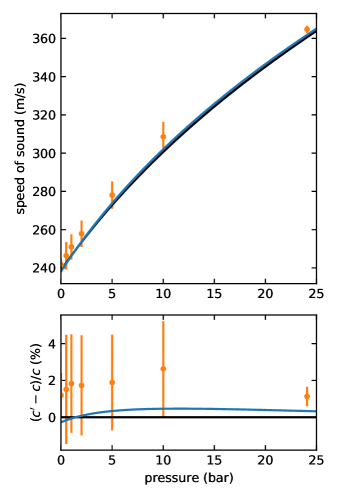
Finally, in Fig. 9(a) we show the speed of sound according to (5). Using the polynomial expression (12) and the Clausius-Mossotti equation (4) yields
| (13) |
where to obtain the expression (12) is first inverted to obtain . In Fig. 9(b) we show the relative difference between the data obtained here and the speed of sound obtained using ultrasonic pulses by Abraham et al. [28] and inelastic neutron scattering by Godfrin et al. [48]. Apart from the low pressure region, our data lie systematically bellow the ultrasound velocities. Since the data reported in Ref. [28] have relative uncertainty of approximately 0.1% (due to uncertainty of zero-pressure limit value and statistical uncertainty of the fit), this, again, most likely indicates that the deformation of the cavity is not fully accounted for by linear elastic compressibility.
VII Conclusions
We have presented measurements of the dielectric constant and density of superfluid 4He in the zero-temperature limit for pressures up to 25 bar, showing that very high experimental accuracy is attainable under cryogenic conditions using a superconducting microwave cavity. Reviewing multiple past experiments, we find a systematic discrepancy between low-frequency and high-frequency measurements of the dielectric constant – measured in the present experiment with the highest precision to-date – which exceeds the expected frequency dependence of the polarizability [40]. For the pressure-dependent density, after careful consideration of dominant sources of systematic errors – a hydrostatic pressure head, fountain effect in the helium fill line, and the cavity compressibility – we find moderate discrepancies with respect to the values of density reported in the literature, which could be to large extent attributed to the nonlinear deformation of the cavity geometry and rather uncertain value of the molecular polarizability of liquid 4He. Finally, using the measured pressure dependence of density we calculate the speed of sound which is found to be in good agreement, but systematically underestimating, the speed of sound obtained either by ultrasonic pulse propagation [28] or inelastic neutron scattering [48].
The uncertainty of polarizability in the high-density liquid is in stark contrast with the 4He gas near the triple point of water, where experimental accuracy [22] and ab-initio calculation of 4He polarizability [40] advanced to the point where helium can be used for metrological purposes, such as creation of a pressure standard. Such detailed, quantitative understanding of liquid helium under cryogenic conditions is equally desirable and would allow, for example, accurate calibration of cryogenic secondary pressure transducers. Thanks to high achievable quality factors of superconducting microwave cavities and the high purity of cryogenic liquid helium, extremely accurate measurements of dielectric properties of 4He are possible, which presents an ideal test bed for future extensions of ab-initio calculations. Finally, we note that if filled with 3He, a similar system could be used as a highly accurate and sensitive primary thermometer at very low temperatures [49].
Acknowledgements.
This work was supported by the University of Alberta; the Natural Sciences and Engineering Research Council, Canada (Grants RGPIN-2016-04523, CREATE-2017-495446, and RGPIN-2022-03078); and the Alberta Quantum Major Innovation Fund. As researchers at the University of Alberta, we acknowledge that we are located on Treaty 6 territory, and that we respect the histories, languages, and cultures of First Nations, Métis, Inuit, and all First Peoples of Canada, whose presence continues to enrich our vibrant community.References
- Padamsee et al. [1993] H. Padamsee, K. W. Shepard, and R. Sundelin, Physics and Accelerator Applications of RF Superconductivity, Annu. Rev. Nucl. Part. Sci. 43, 635 (1993).
- Reagor et al. [2016] M. Reagor, W. Pfaff, C. Axline, R. W. Heeres, N. Ofek, K. Sliwa, E. Holland, C. Wang, J. Blumoff, K. Chou, M. J. Hatridge, L. Frunzio, M. H. Devoret, L. Jiang, and R. J. Schoelkopf, Quantum memory with millisecond coherence in circuit QED, Phys. Rev. B 94, 014506 (2016).
- Wang et al. [2016] C. Wang, Y. Y. Gao, P. Reinhold, R. W. Heeres, N. Ofek, K. Chou, C. Axline, M. Reagor, J. Blumoff, K. M. Sliwa, L. Frunzio, S. M. Girvin, L. Jiang, M. Mirrahimi, M. H. Devoret, and R. J. Schoelkopf, A Schrödinger cat living in two boxes, Science 352, 1087 (2016).
- Reagor et al. [2013] M. Reagor, H. Paik, G. Catelani, L. Sun, C. Axline, E. Holland, I. M. Pop, N. A. Masluk, T. Brecht, L. Frunzio, M. H. Devoret, L. Glazman, and R. J. Schoelkopf, Reaching 10 ms single photon lifetimes for superconducting aluminum cavities, Appl. Phys. Lett. 102, 192604 (2013).
- Kudra et al. [2020] M. Kudra, J. Biznárová, A. Fadavi Roudsari, J. J. Burnett, D. Niepce, S. Gasparinetti, B. Wickman, and P. Delsing, High quality three-dimensional aluminum microwave cavities, Appl. Phys. Lett. 117, 070601 (2020).
- Béjanin et al. [2021] J. H. Béjanin, C. T. Earnest, A. S. Sharafeldin, and M. Mariantoni, Interacting defects generate stochastic fluctuations in superconducting qubits, Phys. Rev. B 104, 094106 (2021).
- Müller et al. [2019] C. Müller, J. H. Cole, and J. Lisenfeld, Towards understanding two-level-systems in amorphous solids: Insights from quantum circuits, Rep. Prog. Phys. 82, 124501 (2019).
- Martinis et al. [2005] J. M. Martinis, K. B. Cooper, R. McDermott, M. Steffen, M. Ansmann, K. D. Osborn, K. Cicak, S. Oh, D. P. Pappas, R. W. Simmonds, and C. C. Yu, Decoherence in Josephson Qubits from Dielectric Loss, Phys. Rev. Lett. 95, 210503 (2005).
- Tretiakov et al. [2020] A. Tretiakov, C. A. Potts, T. S. Lee, M. J. Thiessen, J. P. Davis, and L. J. LeBlanc, Atomic microwave-to-optical signal transduction via magnetic-field coupling in a resonant microwave cavity, Appl. Phys. Lett. 116, 164101 (2020).
- Ruether et al. [2021] M. Ruether, C. A. Potts, J. P. Davis, and L. J. LeBlanc, Polymer-loaded three dimensional microwave cavities for hybrid quantum systems, J. Phys. Commun. 5, 121001 (2021).
- Hanson et al. [1976] H. N. Hanson, J. E. Berthold, G. M. Seidel, and H. J. Maris, Density of liquid at freezing and entropy of solid at low temperatures, Phys. Rev. B 14, 1911 (1976).
- Berthold et al. [1976] J. E. Berthold, H. N. Hanson, H. J. Maris, and G. M. Seidel, Investigation of the phonon dispersion relation in liquid 4He by thermal-expansion measurements, Phys. Rev. B 14, 1902 (1976).
- Souris et al. [2017] F. Souris, H. Christiani, and J. P. Davis, Tuning a 3D microwave cavity via superfluid helium at millikelvin temperatures, Appl. Phys. Lett. 111, 172601 (2017).
- Lane et al. [2020] J. R. Lane, D. Tan, N. R. Beysengulov, K. Nasyedkin, E. Brook, L. Zhang, T. Stefanski, H. Byeon, K. W. Murch, and J. Pollanen, Integrating superfluids with superconducting qubit systems, Phys. Rev. A 101, 012336 (2020).
- De Lorenzo and Schwab [2014] L. A. De Lorenzo and K. C. Schwab, Superfluid optomechanics: Coupling of a superfluid to a superconducting condensate, New J. Phys. 16, 113020 (2014).
- Singh et al. [2017] S. Singh, L. A. Lorenzo, I. Pikovski, and K. C. Schwab, Detecting continuous gravitational waves with superfluid 4He, New J. Phys. 19, 073023 (2017).
- Vadakkumbatt et al. [2021] V. Vadakkumbatt, M. Hirschel, J. Manley, T. J. Clark, S. Singh, and J. P. Davis, Prototype superfluid gravitational wave detector, Phys. Rev. D 104, 082001 (2021).
- Manley et al. [2020] J. Manley, D. J. Wilson, R. Stump, D. Grin, and S. Singh, Searching for Scalar Dark Matter with Compact Mechanical Resonators, Phys. Rev. Lett. 124, 151301 (2020).
- Zadorozhko et al. [2018] A. A. Zadorozhko, Y. P. Monarkha, and D. Konstantinov, Circular-Polarization-Dependent Study of Microwave-Induced Conductivity Oscillations in a Two-Dimensional Electron Gas on Liquid Helium, Phys. Rev. Lett. 120, 046802 (2018).
- [20] J. Pollanen, N. Beysengulov, and D. Rees, Qubit hardware for electrons on helium, U. S. Patent US10892398B2 (2021)
- Rourke [2021] P. M. C. Rourke, Perspective on the Refractive-Index Gas Metrology Data Landscape, J. Phys. Chem. Ref. Data 50, 033104 (2021).
- Gaiser and Fellmuth [2018] C. Gaiser and B. Fellmuth, Polarizability of Helium, Neon, and Argon: New Perspectives for Gas Metrology, Phys. Rev. Lett. 120, 123203 (2018).
- Kerr and Taylor [1964] E. C. Kerr and R. D. Taylor, The molar volume and expansion coefficient of liquid 4He, Ann. Phys. (N. Y.) 26, 292 (1964).
- Harris-Lowe and Smee [1970] R. F. Harris-Lowe and K. A. Smee, Thermal Expansion of Liquid Helium II, Phys. Rev. A 2, 158 (1970).
- Niemela and Donnelly [1995] J. J. Niemela and R. J. Donnelly, Density and thermal expansion coefficient of liquid helium-4 from measurements of the dielectric constant, J Low Temp Phys 98, 1 (1995).
- Tanaka et al. [2000] E. Tanaka, K. Hatakeyama, S. Noma, and T. Satoh, Molar volume of pure liquid 4He: Dependence on temperature (50–1000 mK) and pressure (0–1.57 MPa), Cryogenics 40, 365 (2000).
- Brooks and Donnelly [1977] J. S. Brooks and R. J. Donnelly, The calculated thermodynamic properties of superfluid helium‐4, J. Phys. Chem. Ref. Data. 6, 51 (1977).
- Abraham et al. [1970] B. M. Abraham, Y. Eckstein, J. B. Ketterson, M. Kuchnir, and P. R. Roach, Velocity of Sound Density, and Gruneisen Constant in Liquid , Phys. Rev. A 2, 550 (1970).
- Pozar [2011] D. M. Pozar, Microwave Engineering, 4th ed. (Wiley, 2011).
- Reagor [2015] M. J. Reagor, Superconducting Cavities for Circuit Quantum Electrodynamics, Ph.D. thesis, Yale (2015).
- Note [1] The polarizability volume per mole is related to the molecular polarizability (per mole) . In dielectric constant gas thermometry literature (e.g., [22]) the common definition of polarizability is .
- Allen et al. [1971] M. A. Allen, Z. D. Farkas, H. A. Hogg, E. W. Hoyt, and P. B. Wilson, Superconducting Niobium Cavity Measurements at SLAC, IEEE Trans. Nucl. Sci. 18, 168 (1971).
- Probst et al. [2015] S. Probst, F. B. Song, P. A. Bushev, A. V. Ustinov, and M. Weides, Efficient and robust analysis of complex scattering data under noise in microwave resonators, Rev. Sci. Instrum. 86, 024706 (2015).
- Tilley and Tilley [1990] D. R. Tilley and J. Tilley, Superfluidity and Superconductivity, 3rd ed. (IOP Publishing, Bristol, 1990).
- Arp et al. [1998] V. D. Arp, R. D. McCarty, and D. G. Friend, Thermophysical Properties of Helium-4 from 0.8 to 1500 K with Pressures to 2000 MPa, Technical Note (NIST TN) (1998).
- Ekin [2006] J. Ekin, Experimental Techniques for Low-Temperature Measurements: Cryostat Design, Material Properties and Superconductor Critical-Current Testing (Oxford University Press, Oxford, 2006).
- Sciver [2012] S. W. V. Sciver, Helium Cryogenics, 2nd ed., International Cryogenics Monograph Series (Springer, 2012).
- Kerr and Sherman [1970] E. C. Kerr and R. H. Sherman, The molar polarizability of 3He at low temperatures and its density dependence, J. Low Temp. Phys. 3, 451 (1970).
- Kierstead [1976] H. A. Kierstead, Dielectric constant and molar volume of saturated liquid 3He and 4He, Journal of Low Temperature Physics 23, 791 (1976).
- Piszczatowski et al. [2015] K. Piszczatowski, M. Puchalski, J. Komasa, B. Jeziorski, and K. Szalewicz, Frequency-Dependent Polarizability of Helium Including Relativistic Effects with Nuclear Recoil Terms, Phys. Rev. Lett. 114, 173004 (2015).
- Buckingham and Pople [1955] A. D. Buckingham and J. A. Pople, The dielectric constant of an imperfect non-polar gas, Trans. Faraday Soc. 51, 1029 (1955).
- Hill [1958] T. L. Hill, Theory of the Dielectric Constant of Imperfect Gases and Dilute Solutions, J. Chem. Phys. 28, 61 (1958).
- Kim et al. [2005] H.-Y. Kim, J. O. Sofo, D. Velegol, M. W. Cole, and G. Mukhopadhyay, Static polarizabilities of dielectric nanoclusters, Phys. Rev. A 72, 053201 (2005).
- Gaiser and Fellmuth [2008] C. Gaiser and B. Fellmuth, Molar polarizability change in gaseous 4He far from the condensation possibly due to the creation of bosonic clusters, EPL 83, 15001 (2008).
- Chan et al. [1977] M. Chan, M. Ryschkewitsch, and H. Meyer, The dielectric constant in liquid and solid4He, J Low Temp Phys 26, 211 (1977).
- Brown and Fuller [1990] P. J. Brown and W. A. Fuller, Statistical Analysis of Measurement Error Models and Applications: Proceedings of the AMS-IMS-SIAM Joint Summer Research Conference Held June 10-16, 1989, with Support from the National Science Foundation and the U.S. Army Research Office (American Mathematical Soc., 1990).
- Efron [1981] B. Efron, Nonparametric estimates of standard error: The jackknife, the bootstrap and other methods, Biometrika 68, 589 (1981).
- Godfrin et al. [2021] H. Godfrin, K. Beauvois, A. Sultan, E. Krotscheck, J. Dawidowski, B. Fåk, and J. Ollivier, Dispersion relation of Landau elementary excitations and thermodynamic properties of superfluid 4He, Phys. Rev. B 103, 104516 (2021).
- Greywall and Busch [1982] D. S. Greywall and P. A. Busch, 3He-melting-curve thermometry, J Low Temp Phys 46, 451 (1982).