March 15, 2022
Study of Thin Iron Films for Polarization Analysis of Ultracold Neutrons
Abstract
The TUCAN (TRIUMF Ultra-Cold Advanced Neutron) collaboration aims to search for the neutron electric dipole moment (nEDM) with unprecedented precision. One of the essential elements for the nEDM measurement is a polarization analyzer of ultracold neutrons (UCNs), whose main component is a magnetized thin iron film. Several thin iron films were deposited on aluminum and silicon substrates and were characterized by vibrating sample magnetometry and cold-neutron reflectometry. A magnetic field required to saturate the iron film is 12 for those on the aluminum substrates and 6.4 for the silicon substrates. The magnetic potential of the iron films on the Si substrate was estimated to be 2 by the neutron reflectometry, which is sufficient performance for an UCN polarization analyzer of the nEDM measurement.
1 Introduction
1.1 Background
Searches of CP violation occupy an important place in today’s particle physics. According to the Sakharov’s scenario [1], sources of CP violation beyond the Standard Model are required to explain the baryon asymmetry of the universe. The measurement of the neutron electric dipole moment (nEDM) has great significance in this context. A finite value of the nEDM would violate time-reversal symmetry and therefore CP symmetry. Decades of experimental searches of the nEDM have set stringent upper limits on the nEDM and put severe constraints on theories beyond the Standard Model. The current best experimental upper limit on the nEDM is 1.8, obtained at the Paul Scherrer Institute using ultracold neutrons (UCNs) [2]. UCNs refer to neutrons with kinetic energies of 300 that can be stored in cells made of appropriate materials and surfaces for times on the order of 100. The limitation of the latest measurement comes from the statistical uncertainty due to the number of UCNs available for the measurement. In this context, the TUCAN (TRIUMF Ultra-Cold Advanced Neutron) collaboration is developing a high-intensity UCN source and aiming at a nEDM measurement with a sensitivity of .
Measurements of the nEDM are performed in an UCN storage cell under a weak (1 T) magnetic field and a strong (10) electric field. The magnitude of the nEDM is evaluated by the difference of precession frequencies under two configurations of the electric and the magnetic fields, where they are parallel or anti-parallel. The Ramsey’s method of separated oscillating fields[3] is used to measure the precession frequencies. Here, a sequence of two pulses is applied to the UCNs and their polarization is measured at the end of every cycle. By observing a spin resonance by varying the frequency of the pulses, the precession frequency is determined from the center of the resonance. Thus, the polarization analysis of UCNs is one of the essential elements of the experiment.
1.2 Principle of UCN Polarization
The polarization analysis of UCNs is based on a spin-dependent potential due to the magnetic moment of the neutron 60 and an external magnetic flux density . Magnetized thin iron films are commonly used to produce a strong magnetic potential for UCNs. An UCN traversing a thin iron film magnetized to a flux density of experiences a spin-dependent effective potential
| (1) |
where the spin states and of the neutron are defined by the sign of the magnetic potential. The ideal average Fermi potential of an iron film is represented by 209. Because the kinetic energies of UCNs are neV, only the state neutrons pass through the film.
1.3 Requirements for thin iron films for UCN polarization analysis
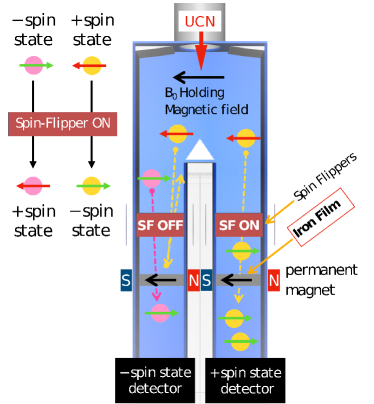
In the TUCAN nEDM measurement, spin-state analysis of UCNs will be performed by a device called the simultaneous spin analyzer (SSA), which allows for simultaneous analysis of the two spin components [5]. As shown in Fig. 1, it is equipped with two arms, each consisting of a spin flipper, a thin iron film with a permanent magnet surrounding it, and an UCN detector. The polarized UCNs detected by each arm can be controlled by the spin-flipper. To be used for the SSA, the thin iron films are required to reach a large saturation magnetization with a smaller applied field. In the present study, we aimed to develop films that are saturated by a magnetic field smaller than 40 kA/m of the previous studies [5, 7]. Such a small operational magnetic field will minimize the influence of the SSA on the neighboring devices and provide flexibility in the design of the apparatus. The goal for the saturation flux density is T, which corresponds to an acceptance range of the UCN energies from 90 to 330 neV from Eq. (1), sufficiently covering expected energies of UCNs detected by the SSA.
2 Production of thin iron films and evaluation of their magnetic properties
Thin iron films were simultaneously deposited on aluminum (Al) and silicon (Si) substrates by the ion beam sputtering (IBS) facility of the Institute for Integrated Radiation and Nuclear Science, Kyoto University (KURNS) [6]. The thicknesses of the iron layers were 30, 50 and 90. In the previous studies, thin iron films with thicknesses of 150–400 sputtered on Al substrates were developed [4, 5, 7]. These thicknesses of 100 were selected, as they were expected to make the iron coercivity small [9]. In addition to the Al substrate used in the previous studies, polished Si wafers with a diameter of 3 inches were employed as the substrates, because it is expected to have a smaller magnetization induced by the strains of the film due to the Villari effect [8]. Another advantage of the Si substrate films is that they can be characterized by cold-neutron reflectometry, which enables direct determination of the effective potential Eq. (1), as discussed in detail in Sec. 3.
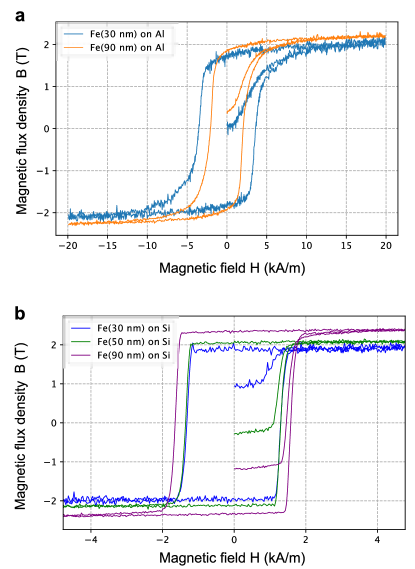
The magnetic properties of the samples were measured by vibrating sample magnetometry (VSM). For the measurement, a piece of about 810 was cut out from each sample and a magnetization curve was obtained. The obtained curves are shown in Fig. 2. It can be seen that the iron is fully saturated by a magnetic field of about 12 for samples on the Al substrates and about 4 for those on the Si substrates.
3 Characterization of thin iron films on Si substrate by cold-neutron reflectometry
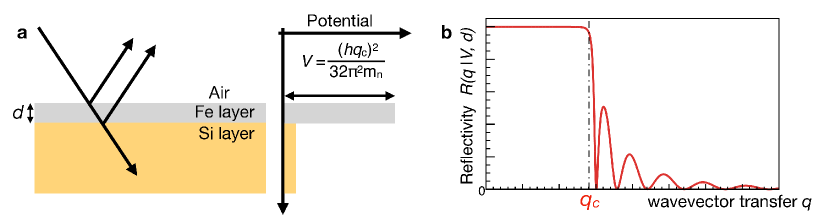
The thin iron film samples on Si substrates with thicknesses of 30, 50 and 90 (2030) were also characterized by polarized cold-neutron reflectometry, where the reflectivity of the sample is obtained as a function of the wavevector transfer of the neutron beam. As described in Fig. 3, the dependence of the reflectivity of a single-layer thin film on a sufficiently thick substrate can be described by a simple model which is characterized by the potential , the thickness of the thin layer , and the cut-off wavevector . By fitting the model to the obtained data, the effective potential experienced by neutrons at each spin states can be estimated.
The measurement was carried out at the low-divergence branch of J-PARC/MLF BL05 [10], where pulsed cold neutrons in an energy range of – are provided. The pulse structure of the beam allows for determination of the wavelength of the detected neutrons from their time of flight.
3.1 Measurement of the beam polarization
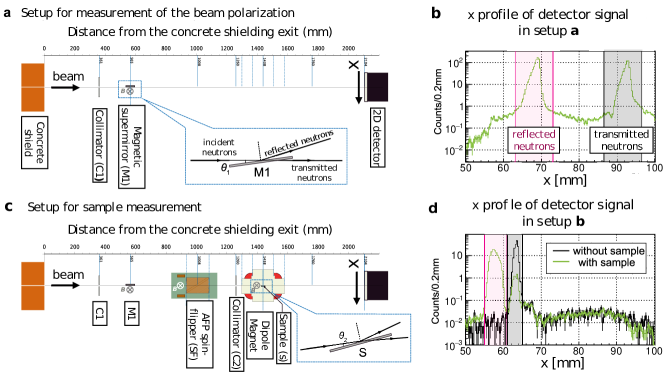
The measurement requires a polarized beam of neutrons. To polarize an unpolarized beam from the beamline, a magnetic supermirror is utilized. Owing to the difference of the magnetic potentials of the different spin states of neutrons, the most of reflected neutrons from the supermirror are dominated by neutrons of the spin state. Before measuring the actual sample, the polarized beam from the mirror was characterized with an experimental setup in Fig. 4a. The beam was collimated to 100.1 by a collimator C1 and then injected to a magnetic supermirror M1 which is composed of Fe, Ge and Si layers [11]. Both the transmitted neutrons and the reflected neutrons are detected by a two-dimensional detector based on a resistance photomultiplier tube (RPMT) [12], the reflectivity of M1 is obtained from the ratio of integrated signals of transmitted and reflected neutrons. Here, losses due to scattering and absorption by M1 are supposed to be negligibly small. Assuming an unpolarized incident beam, the measured reflectivity of M1 is given by
| (2) |
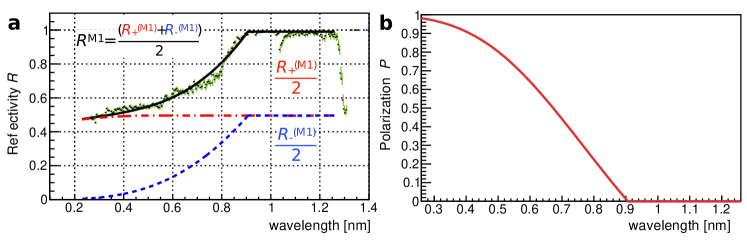
where the M1 reflectivities of the spin state and spin state are expressed as , respectively. Measured neutron intensity detected in the setup of Fig. 4a is shown in Fig. 4b. The detector signals are integrated in the ranges indicated in Fig. 4b to obtain the intensities of the transmitted neutrons and the reflected neutrons . The reflectivity of M1 and the wavelength-dependent polarization are defined as . Assuming that is constant and obeys a known model function discussed in Ref. [13]. The reflectivties and are obtained by fitting the model to the data as shown in Fig. 5a. As a result, is obtained as shown in Fig. 5b.
3.2 Measurement of the thin iron film samples
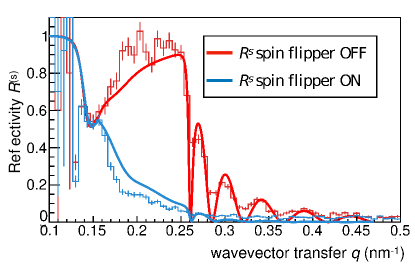
The reflectivities of polarized neutrons were measured by a setup shown in Fig. 4c to determine the magnetic potentials of the iron film samples. As shown in Fig. 4c, the sample was placed in a dipole magnet with an applied magnetic field up to 6.4. A collimator C2 100.1 was added between the M1 and the sample to avoid scattering of neutrons at the edge of the sample. A spin-flipper based on the principle of adiabatic free passage (AFP) [14] is placed upstream of the C2 to select the spin state of incident neutrons to the sample. Measured neutron intensities detected with this setup are shown in Fig. 4b shows Fig. 4d, where the reflectivity of samples, is defined as the ratio of direct beam intensity to reflection intensity of the sample. The measured reflectivity of the sample with a thickness of 90, is shown in Fig. 6. The is related to the beam polarization and the reflectivity function as
| (3) |
where are the effective potentials experienced by the neutrons in each spin state. The polarization obtained in Sec. 3.2 was converted to the wavevector transfer by , with being the incident angle of the sample in this setup. Fitting the functions of Eq. (3) to the measured data in Fig. 6, the effective potentials are evaluated as and . From these, and are determined.
4 Conclusions and Outlook
The thin iron films for polarization analysis of UCNs are successfully developed and characterized. From the results of the VSM measurements, the magnetic field required to saturate the iron films was obtained as for films on the Si substrates and 12 for those on the Al substrates. The cold neutron reflectometry of the Si-substrate films were conducted, and yielded the effective potentials of and , corresponding to the saturation magnetization of 2 T. These characteristics satisfy the requirements for the use as a part of the TUCAN SSA. As the next step, a prototype UCN polarizer is planned to be constructed and tested by pulsed UCNs provided from J-PARC/MLF BL05 [15].
5 Acknowledgements
This research was supported by JSPS KAKENHI Grant Numbers 18H05230 and 20KK0069. The neutron experiment at the Materials and Life Science Experimental Facility of J-PARC was performed under user S-type project of KEK (Proposal No. 2019S03). The thin iron films production work has been carried out under the visiting Researcher’s Program of the Institute for Integrated Radiation and Nuclear Science, Kyoto University.
References
- [1] A. D. Sakharov, Pisma Zh. Eksp. Theor. Fiz. 5, 32 (1967).
- [2] C. Abel et al., Phys. Rev. Lett. 124, 081803 (2020).
- [3] N. F. Ramsey, Phys. Rev. 78, 695 (1950).
- [4] T. Lauer, Presentation on Workshop on Neutron EDM Experimental Techniques (2012).
- [5] S. Afach, et al., Euro. Phys. Jour. A 51, 143 (2015).
- [6] M. Hino et al., Nucl. Inst. Meth. A 797, 265 (2015).
- [7] M. Burghoff, Progress Report, PSI Proposal R-05-03.1, pp. 21–23 (2012).
- [8] A. G. Olabi, et al., Mater. Des. 29, 469(2008).
- [9] Y. K. Kim and M. Oliveria, J. Appl. Phys. 74, 1233 (1993).
- [10] K. Mishima et al., Nucl. Inst. Meth. A 600, 342 (2009).
- [11] M. Hino et al., Physica B. 385-386, 1187 (2006).
- [12] K. Hirota, et al., Phys. Chem. Chem. Phys., 7, 1836 (2005).
- [13] P. Willendrup et al., McStas, Component Manual 46 (2021).
- [14] S. V. Grigoriev, A. I. Okorokov and V. V. Runov, Nucl. Inst. Meth. A, 384, 451 (1997).
- [15] S. Imajo et al., Prog. Theor. Exp. Phys. 2016, 013C22 (2016).