Luminous Optical and X-ray Flaring of the Putative Redback Millisecond Pulsar 1FGL J0523.52529
Abstract
Several redback and black widow millisecond pulsar binaries have episodes of flaring in X-rays and optical. We initially detected such behavior from the Fermi selected redback candidate 1FGL J0523.52529 during optical time-series monitoring. Triggered observations with the Neil Gehrels Swift Observatory over the next days showed episodic flaring in X-rays with luminosity up to erg s-1 ( times the minimum), and a comparable luminosity in the optical/UV, with similar power-law spectra of . These are the most luminous flares seen in any non-accreting “spider” pulsar system, which may be related to the large size of the companion through the fraction of the pulsar wind that it or its ablated wind intercepts. Simultaneously with an optical flare, we see Balmer-line and He I emission, not previously known in this object, which is evidence of a stellar wind that may also inhibit detection of radio pulsations. The quiescent optical light curves, while dominated by ellipsoidal modulation, show evidence of variable non-uniform temperature that could be due either to large starspots or asymmetric heating of the companion by the pulsar. This may explain a previous measurement of unusual non-zero orbital eccentricity as, alternatively, distortion of the radial-velocity curve by the surface temperature distribution of the large companion.
1 Introduction
Millisecond pulsars (MSPs) have shorter spin periods and smaller spin-down rates than ordinary pulsars, which in the dipole spindown paradigm implies weaker surface magnetic fields ( G) and much older ages ( yr). Unlike canonical pulsars, the majority of MSPs have binary companions, either white dwarfs or low-mass, evolved stars. The standard model for their origin is spin-up (recycling) of the neutron star by accretion during a low-mass X-ray binary (LMXB) stage (Alpar et al., 1982; Radhakrishnan & Srinivasan, 1982), with the radio pulsar turning on after accretion stops. Accretion-induced collapse of a white dwarf has been considered an alternative formation scenario (Ferrario & Wickramasinghe, 2007; Tauris et al., 2013).
Of 3329 cataloged pulsars111https://www.atnf.csiro.au/research/pulsar/psrcat/ (version 1.67) (Manchester, 2005), 501 have spin periods ms and G, a combination that reliably indicates a recycled origin. Low--field pulsars with slightly longer periods may also have been recycled, albeit “mildly”. There are also 20 accretion-powered MSPs known as of 2020 (Papitto & de Martino, 2022), all in X-ray transient systems with orbital periods day, that may eventually become radio MSPs.
The Large Area Telescope on the Fermi Gamma-ray Space Telescope detects many known and new MSPs222https://confluence.slac.stanford.edu/display/GLAMCOG/Public+List+of+LAT-Detected+Gamma-Ray+Pulsars. Of the 276 -ray pulsars detected to date, 127 are MSPs, of which 95 are Fermi discoveries, e.g., Bhattacharyya et al. (2021). Follow-up radio pulsar searches of unidentified Fermi source positions identifies the pulsar counterpart, and continued timing measures its orbital parameters. Discovery of the corresponding -ray pulsations often follows. Direct pulsar searches of the -rays themselves have also revealed MSPs (Pletsch et al., 2012; Clark et al., 2018, 2021; Nieder et al., 2020b); in two of these cases the pulsar remains undetected in radio.
An important Fermi discovery is the abundance of black widows and redbacks, previously rare MSPs in which the relativistic pulsar wind heats the photosphere of a companion and helps drive a wind. With orbital periods generally day, black widows have degenerate companions of , while redbacks have non-degenerate companions that are generally hotter and of lower density than main-sequence stars of the same mass. These distinct sub-classes were recognized (Roberts, 2011, 2013) as a bimodal mass distribution became apparent among the Fermi MSP identifications. Hui & Li (2019) catalogued 44 black widows (27 in the Galactic field and 17 in globular clusters), and 26 redbacks (14 in the Galactic field and 12 in globular clusters).
Redback companions are close to filling their Roche lobes (Strader et al., 2019), and their winds often obscure the radio pulsar signal for a large fraction of the orbit (e.g., Camilo et al. 2016; Deneva et al. 2016; Clark et al. 2021; Corongiu et al. 2021). The winds are sometimes seen in optical emission lines (Halpern et al., 2017b; Strader et al., 2019), while nonthermal emission, likely due to shocks from the collision of the pulsar wind and the stellar wind, is ubiquitous in X-rays (Bogdanov et al., 2005, 2011, 2014; Al Noori et al., 2018). When good photon statistics are available, the X-ray flux is often seen to be modulated around the orbit, which has been interpreted in terms of the geometry of the intrabinary shock and relativistic beaming of synchrotron radiation by the emitting particles (Romani & Sanchez, 2016; Wadiasingh et al., 2017; Córtes & Sironi, 2022).
The photosphere of the companion can be heated either by high-energy photons from the shock region, or direct bombardment by pulsar wind particles (Sanchez & Romani, 2017). The resulting optical modulation can be dominated by the contrast between the heated and the “dark” side of the companion (Breton et al., 2013; Schroeder & Halpern, 2014), or, if the heating effect is small, by ellipsoidal modulation of the light from the tidally distorted star (Li et al., 2014; Bellm et al., 2016; van Staden & Antoniadis, 2016; Shahbaz et al., 2017), with large starspots possibly playing a role.
All of these effects can also vary on timescales of minutes to months. A change in photospheric heating sometimes occurs over weeks and months, while minutes long flares increase the luminosity by a factor of 10 or more in X-rays, and up to mag in optical, as seen in PSR J10482339 (Cho et al., 2018) and 3FGL J0838.82829 (Halpern et al., 2017a). In the latter redback candidate, a flare was seen simultaneously in X-ray and optical by XMM-Newton. One benefit of these signature effects is that putative redbacks are easily recognized even if their millisecond pulsations have not yet been detected. The detailed properties of well-studied redbacks were summarized by Strader et al. (2019), including six of the putative ones. More recent identifications of candidate redbacks among Fermi sources are 4FGL J2333.15527 (Swihart et al., 2020), 4FGL J0935.3+0901 (Wang et al., 2020), 4FGL J0940.37610 (Swihart et al., 2021), and 4FGL J1702.75655 (Corbet et al., 2022). Pulsations have not been detected from these last four despite dedicated searches in radio (Camilo et al., 2015, 2016; Zheng et al., 2022). Of these, 4FGL J0935.3+0901 has both X-ray flares (Zheng et al., 2022) and optical flares (Halpern, 2022), although it is not clear if it is a redback or a black widow.
Some relatives of redbacks have an accretion disk, but one that is truncated at the inner boundary by the rotating pulsar magnetosphere or pulsar wind. They are easily recognized by their pattern of temporal variability, a distinctive moding behavior in the X-ray and optical that is unique to this class of X-ray binary (Bogdanov et al., 2015; Bogdanov & Halpern, 2015; de Martino et al., 2015). [Although, similar behavior has been observed in several cataclysmic variables (Scaringi et al., 2017, 2022; Littlefield et al., 2022; Duffy et al., 2022) and attributed to a similar mechanism, magnetic gating of the accretion.] Known as transitional millisecond pulsars (tMSPs) in the sub-luminous disk state, the majority of these were also identified from Fermi sources.
tMSPs may be the evolutionary link between the MSPs and their LMXB progenitors (Archibald et al., 2009). Three tMSPs have been observed to transition between the disk state and the redback pulsar state, PSR J1023+0038 (Stappers et al., 2014), XSS J122704859 (Bassa et al., 2014), and PSR J18242452I in the globular cluster M28 (Papitto et al., 2013). One of these, PSR J18242452I, transitioned directly between LMXB and redback states. There are an additional five putative tMSPs identified whose spin periods are not yet known because they have not yet been observed in a pulsar state (Bogdanov & Halpern, 2015; Strader et al., 2016a; Miller et al., 2020; Coti Zelati et al., 2021; Strader et al., 2021). See Papitto & de Martino (2022) for a review of tMSPs, their accretion physics, and their relation to redbacks.
Evolutionary pathways that lead to the transformation of LMXBs into black widows and redbacks have been modeled using physical processes that are likely relevant, although difficult to quantify. These effects include irradiation feedback by accretion luminosity during Roche-lobe overflow, evaporation of the companion by pulsar wind and its radiation, and loss of orbital angular momentum by magnetic braking (Benvenuto et al., 2012, 2014, 2015; Chen et al., 2013; De Vito et al., 2020; Ginzburg & Quataert, 2020, 2021; Jia & Li, 2015, 2016). The resulting evolutionary tracks are tested against the observed orbital periods, companion masses, and Roche-lobe filling factors where measured. Accretion-induced collapse of a white dwarf to a MSP has also been considered as a formation mechanism for redbacks and black widows (Liu & Li, 2017; Ablimit, 2019).
These studies generally found that stronger evaporation of the companion leads to the formation of redbacks, which may go through repeated cycles of accretion and shrinkage within the Roche-lobe. Weaker evaporation leads to black widows, but evaporation alone is not strong enough to completely destroy the companion. Black widows require a mechanism of angular momentum loss to remove matter by Roche-lobe overflow. Theoretically, both redback and black widow companions should not be much smaller than their Roche lobes, which is broadly in accord with the interpretation of observations (Strader et al., 2019; Draghis et al., 2019).
The subject of this paper is the first one of the putative redbacks to be identified without a spin period, 1FGL J0523.52529. It is less studied than most of the others. Strader et al. (2014) identified its X-ray counterpart with the Neil Gehrels Swift Observatory, and discovered its 0.688 day optical period in the Catalina Real-Time Transient Survey (CRTS; Drake et al. 2009). Radial velocity spectroscopy of the late G or early K type star, together with a measurement of its rotational broadening, indicated a mass ratio of , and a companion mass in the range for an assumed NS mass in the range . These parameters require an orbital inclination in the range .
The companion mass of 1FGL J0523.52529 is the largest among redbacks (Strader et al., 2019). In addition, an orbital eccentricity of was measured, which is unexpected for such old systems. Other redback eccentricities are consistent with zero. The evidence for a pulsar in the system was less direct than in most other such candidates. The optical light curve in CRTS is consistent with ellipsoidal modulation and no heating. There was no evidence for emission lines in the spectra, and no flaring in X-rays or optical, although very little if any monitoring had been done.
In this paper, we present optical time-series observations, spectra, and Swift monitoring that reveal multiple epochs of flaring behavior and variable heating in 1FGL J0523.52529, confirming that a relatively energetic MSP must be present even though its pulsations have not yet been detected. We assume a distance of 2.24 kpc from the Gaia measured parallax of mas in its extended third data release (EDR3; Brown et al. 2021). Section 2 describes the optical data and results from MDM Observatory, while Section 3 examines light curves from the Transiting Exoplanet Survey Satellite (TESS; Ricker et al. 2015). Section 4 compiles long-term survey results from the CRTS, the All-Sky Automated Survey for Supernovae (ASAS-SN; Jayasinghe et al. 2019), and the Zwicky Transient Facility (ZTF; Bellm et al. 2019). Observations from the Swift X-ray Telescope (XRT) and UV/Optical Telescope (UVOT) are presented in Sections 5 and 6, respectively. Interpretation of the results follows in Section 7. The main conclusions are summarized in Section 8.
2 MDM Optical Observations
| Date | ExposureaaPoints in Figure 1a for 2014 December are the average of three 15 s exposures. | Time | Phase |
|---|---|---|---|
| (UT) | (s) | (UTC) | () |
| 2014 Dec 23 | 05:07–07:39 | 0.905–0.057 | |
| 2014 Dec 23 | 04:55–07:33 | 0.346–0.506 | |
| 2014 Dec 27 | 03:44–07:30 | 0.636–0.861 | |
| 2014 Dec 28 | 03:42–07:29 | 0.087–0.313 | |
| 2014 Dec 29 | 03:40–06:56 | 0.536–0.733 | |
| 2020 Jan 23 | 30 | 02:03–03:22 | 0.321–0.400 |
| 2020 Jan 24 | 30 | 01:45–04:55 | 0.755–0.947 |
| 2020 Jan 25 | 30 | 02:01–07:50 | 0.225–0.576 |
| 2020 Jan 26 | 30 | 01:41–07:40 | 0.658–0.020 |
| 2020 Feb 6 | 30 | 01:49–07:03 | 0.650–0.967 |
| 2020 Feb 7 | 30 | 01:48–07:00 | 0.102–0.417 |
| 2020 Nov 12 | 30 | 06:19–12:37 | 0.822–0.176 |
| 2020 Nov 13 | 30 | 06:05–12:10 | 0.261–0.612 |
| 2020 Nov 14 | 30 | 06:07–12:29 | 0.716–0.102 |
| 2020 Nov 15 | 30 | 05:58–12:31 | 0.160–0.557 |
| 2020 Nov 16 | 30 | 05:49–12:27 | 0.605–0.007 |
| 2020 Dec 17 | 60 | 03:49–10:20 | 0.534–0.928 |
| 2021 Jan 7 | 60 | 02:44–08:56 | 0.071–0.360 |
| 2021 Jan 8 | 60 | 02:25–08:55 | 0.418–0.813 |
| 2021 Jan 9 | 60 | 03:01–08:55 | 0.908–0.265 |
| 2021 Jan 10 | 60 | 02:17–08:50 | 0.317–0.714 |
| 2021 Jan 11 | 60 | 02:09–08:47 | 0.762–0.163 |
| 2021 Nov 12 | 60 | 06:08–12:46 | 0.231–0.632 |
| 2021 Nov 13 | 60 | 06:03–12:42 | 0.679–0.083 |
| 2021 Nov 14 | 60 | 05:59–12:38 | 0.128–0.531 |
| 2021 Nov 15 | 60 | 05:55–12:34 | 0.578–0.980 |
We used the MDM Observatory 1.3 m McGraw-Hill telescope for time-series photometry of 1FGL J0523.52529 in the -band. Thinned, backside-illuminated CCDs were windowed to achieve an efficient read/prep cycle time of 3 s compared with the exposure times of 15, 30, or 60 s as listed in the observing log (Table 1). To create the light curves, differential photometry was performed with respect to a nearby comparison star. Two methods were used to calibrate the comparison star. First, we measured its magnitude using Landolt (1992) standard stars on a photometric night. Second, we transformed its Pan-STARRS and magnitudes to . The results agree to 0.01 mag. We also obtained two spectra on the MDM 2.4 m Hiltner telescope using OSMOS, the Ohio State Multi-Object Spectrograph (Martini et al., 2011).
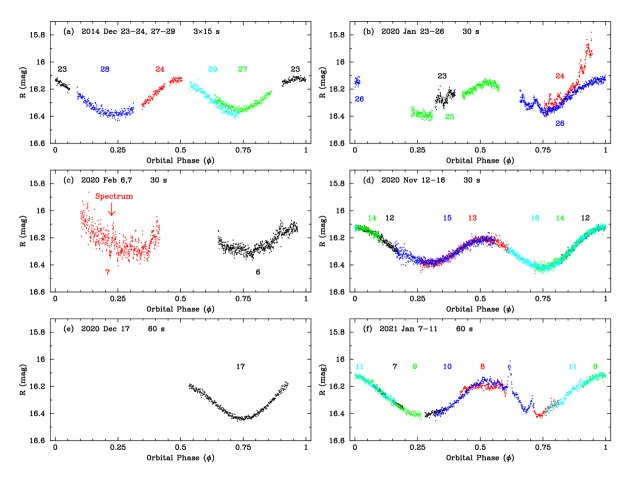
Figure 1 shows our 26 nights of photometry grouped into the seven observing runs: one in 2014, and six in 2020–2021. Given the 16.5 hr orbital period and southerly declination of 1FGL J0523.52529, it is possible to cover at most 0.4 orbit cycles per night, while taking several nights to (almost) sample the full range of phase. The light curves are color coded by night in Figure 1, grouped by observing run and graphed as a function of orbital phase.
All computations of orbital phase in this paper use the spectroscopic ephemeris of Strader et al. (2014): d, (BJD), and Gaia-CRF3 position R.A.=, decl.= (Brown et al. 2021), which is referenced for proper motion to epoch 2016.0. Here is the epoch of superior conjunction of the companion star, which is phase , while is the ascending node of the pulsar according to the radio pulsar convention. The uncertainty in the period measured in 2013–2014 extrapolates to an expected error in orbital phase of 0.15 by the beginning of 2021, but our light curves empirically suggest that the extrapolation is more precise than predicted. However, the light curves are seen to depart in character from a pure ellipsoidal model in ways that will be described below. Therefore, it is not obvious from these light curves how to generate a new photometric ephemeris that could be used to verify or refine the old spectroscopic ephemeris. The extrapolation of the old ephemeris therefore remains a source of uncertainty in absolute phasing.

We next describe the basic features of the data by individual observing runs:
2.1 2014 December 23–29
Our initial run was designed to obtain a more precise light curve than was previously available only from the CRTS (Strader et al., 2014). Figure 1a shows the result, which was largely as expected, a light curve dominated by the effect of ellipsoidal modulation of a tidally distorted star. The quadrature points at and 0.5 are maxima of equal brightness, as expected. The minima, however are unusual in that superior conjunction of the companion () is slightly brighter than inferior conjunction, the opposite of what is expected for a Roche-lobe filling star, in which the L1 point of the star is the dimmest due to gravity darkening and limb darkening. This might indicate that there is in fact some pulsar heating of the “day” side of the companion, which brightens the superior conjunction.
Furthermore, it is apparent that at least one of the nights that sampled around superior conjunction is discrepant. At first we assumed that this was a calibration problem, which could be fixed by raising the December 29 data by mag. But we cannot identify a specific cause of this discrepancy, and our subsequent observations of variability now lead us to believe that the change could be real.
2.2 2020 January 23–26
We returned to 1FGL J0523.52529 in 2020 January in order to add it to our program to characterize the light curves of redbacks and their variability. From the first exploratory observation on January 23, new behavior consisting of rapid variability was apparent. A high point of (above the quiescent magnitude of 16.15) was reached on January 24, when the star was continuing to brighten with multiple, overlapping flares through the end of the series (red points in Figure 1b). It is possible that the peak of the flaring was missed. Based on these results we triggered a series of Swift observations, which began on January 26 and detected X-ray flaring for several days thereafter (see Section 5). Intermittent flaring continued to be observed at MDM through the end of this run on January 26.


2.3 2020 February 1,6,7
We obtained an optical spectrum of 1FGL J0523.52529 on 2020 February 1 and found a late-type stellar spectrum (Figure 2), similar to those of Strader et al. (2014), but with weak H emission as a new feature. On February 6 and 7, time-series photometry revealed a new type of continuous, rapid flaring behavior (Figure 1c). This is real variability, not noisy statistics. The flares peak mag above the quiescent level, similar to the smoother, more isolated flares seen on other nights. But the rapid temporal behavior is qualitatively different. Although the February 7 data may give an impression of possibly being periodic, a power spectrum does not pick out a coherent or quasi-periodic signal. We also obtained another spectrum simultaneous with the time-series on February 7, which shows much stronger Balmer emission lines as well as He I , the brightest expected He I line in this spectral range.
The equivalent width of H increased from Å on February 1 to Å (or larger, depending on the extent of its broad wing) on February 7. In addition, the velocities of the line peaks differ by km s-1, while the FWHM on February 7 is also km s-1. The line broadening and wavelength shift of H evident between the two spectra must be contributed to by velocity structure of the ablated stellar wind, not just orbital dynamics, for which Strader et al. (2014) found a radial velocity amplitude of only km s-1. In view of the extreme variability seen simultaneously on February 7, and the lack of emission lines in the Strader et al. (2014) spectra, it seems reasonable to conclude that emission lines are connected with flaring behavior, which was probably not occurring in late 2013 – early 2014.
2.4 2020 November 12–16
Five nights of time-series photometry in 2020 November did not detect any flaring. There are episodes of noisier than usual data in Figure 1d, but these are due to poor seeing and/or thin clouds, especially at the high-airmass ends of the series. However, it is now easier to see that there are subtle differences in the character of this quiescent light curve from the one in 2014 December, which is also largely quiescent. We observe three types of changes:
First, the maxima at and 0.5 are no longer equal, with the one at being brighter by mag, a significant fraction of the total modulation of mag. The same effect was observed by Pal et al. (2020) in the light curve of 1FGL J0523.52529 as observed by TESS in 2018 November – 2019 January. In the absence of evidence for pulsar heating, which would affect the most, it is difficult to appeal to asymmetric heating of the companion as the cause of the mismatched peaks. A possible explanation is a large starspot or spots that preferentially darken one side of the star, which would be the orbit-trailing side to make it darker at . We will revisit this idea of starspots in the context of how they might affect the radial velocity curve (Section 7.2).
The second change is in the minimum at . It is now lower than the one at , reversing the trend from 2014 December in both relative and absolute sense. That is, the brightness at remained the same, while became dimmer. This could be attributed to a decrease in heating by the pulsar, either directly, or indirectly through the intermediary of an intrabinary shock.
The third change is a shift in the phase of the first minimum (inferior conjunction of the companion) from to . The two minima are no longer exactly apart in phase. Note that at we are viewing the “dark” side of the star, the side least likely to be affected by pulsar heating. Together with the unequal maxima, this delay of the minimum could indicate that the trailing side of the star is darker than the leading side.
While the 2000 November data are the simplest, being free of flares and other variability, they cannot be modelled entirely by ellipsoidal modulation. The deviations are illustrated in Figure 3, where we have superposed an analytic ellipsoidal model (Morris & Naftilan, 1993; Gomel et al., 2021) incorporating the spectroscopic binary parameters from Strader et al. (2014). Similar difficulties would attend the fitting of any of the data in Figure 1, and are discussed in more detail in Section 7.1.
2.5 2020 December 17
Only one night in 2020 December was used for 1FGL J0523.52529, resulting in coverage only of the minimum at (Figure 1e). It is clear from this light curve that the minimum is as low as, or even slight lower than a month earlier. So there is no evidence for pulsar heating.
2.6 2021 January 7–11
Renewed flaring was detected on two of the five nights observed in 2021 January (Figure 1f). These share many of the features of previous results, with the example of a strong and well-resolved flare on January 10 that lasts minutes at . An expanded view of this flare is shown in Figure 1g. The light curves create an illusion that flares on January 8 and 10 may be repeating at the same phases, 0.62 and 0.71, but there is no evidence for this since most of the overlapping January 8 run (red points) is missing due to clouds. The minimum at still appears to be late.
2.7 2021 November 12–15
Low-level flaring was again detected. A failure of the telescope drive interrupted the time-series for 1 hour on November 12 (black points in Figure 1h). The minimum at still appears to be late.
3 TESS Observation (2018 November 15 - 2019 January 6)
Light curves with 120 s cadence were obtained by TESS spanning 52 days in 2018–2019, with three gaps totaling days. These were first described by Pal et al. (2020), where we see that the period listed differs from the one we are using by an amount that is certainly incompatible. Actually, two orbital period values are listed, 0.68505(62) days and 0.68973(17) days, deriving respectively from the fundamental and first harmonic in the power spectrum. The harmonic is more precise because it contains most of the power from the double-peaked light curve, by our own calculation. But the period values are inconsistent with each other, and both disagree with 0.688134(28) days from Strader et al. (2014), by 0.45% and 0.23% respectively. The Strader et al. spectroscopic ephemeris is clearly correct because it continues to accurately fit the phases of our light curves 7 yr later, while the periods from Pal et al. produce a phase drift with respect to this standard, by either 0.17 cycles or 0.34 cycles over the 52 day span of the TESS observation alone.

We analyzed the TESS light curve files in order to check the ephemeris and search for any variability of the type seen in the MDM light curves. A Lomb-Scargle periodogram gives a period from TESS of 0.68751(28) days using the fundamental and 0.688109(34) days using the harmonic. The latter is fully consistent with Strader et al., while the less precise fundamental is only marginally in agreement. The small differences may be due to evolution of the waveform during the span of the observation.
In Figure 4, we show binned light curves of the TESS data divided into segments of 6.5 or 5.5 days, folded on the Strader et al. ephemeris. This shows essentially perfect agreement in phase, as already seen in the MDM observations. The ellipsoidal model of Figure 3 is reproduced for comparison. Some of the same deviations that are seen in the MDM light curves are present here, such as the differing heights of the maxima, and phase offsets of the minima. However, we emphasize that these effects are not variable enough to allow the Pal et al. periods. Finally, we also examined unbinned light curves and find no obvious flares.

4 Archival Optical Surveys
We examined the same data that Strader et al. (2014) used from the CRTS second data release, collected over the years 2006–2013. Figure 5 shows the data folded on the orbital period, excluding points whose error bars are mag, leaving 229 points. Evidently there are two high points, which we list in Table 2 as candidate flares. On a typical night, four unfiltered 30 s exposures of a field are taken in a time span of minutes. This was the case with the candidate flares, but in each case only one point stands out, which raises suspicion that they are spurious. However, the nearest neighboring point is separated by minutes, so it is conceivable that a short flare such as the ones detected on 2021 January 10 in Figure 1f was caught in only one exposure.
We also used the ZTF 10th data release, which provided 101 points in and 102 in over the years 2018–2021. Six high points in the folded ZTF light curves in Figure 5 are marked, which come from three different flaring episodes as listed in Table 2. In two of these episodes, more than one high point was detected within one day; therefore, we consider these multiple detections to be confirmed flares. In fact, the event of 2020 January 23–24 was detected at the same time that MDM was observing it (Figure 1b). There may be additional low-level flaring episodes that contribute to the excess scatter of the ZTF points over a smooth curve, but we have not attempted to identify all such candidates in these data. It also appears that the minimum at is late, at least in most of the ZTF data.
ASAS-SN data comprise 314 detections in over the years 2014–2018, filling the gap between CRTS and ZTF. We list four points as probable flares that are mag brighter than the quiescent level. As in the other surveys, there may be lower-level flares in these data as well. Two of the four flares in ASAS-SN occurred within 17 days of each other in 2015 September. Eight intervening measurements between these two were of normal brightness, so this not necessarily indicative of a duty cycle for a flaring episode. Such a coincidence may occur over four seasons of monitoring.
| Band | Day (BJD) | Date/Time (UTC) | Magnitude | Phase () |
|---|---|---|---|---|
| 2454320.32881 | 2007-08-07 19:53:23 | 15.72(9) | 0.404 | |
| 2454899.95191 | 2009-03-09 10:49:46 | 16.10(12) | 0.706 | |
| 2457276.91974 | 2015-09-11 10:03:12 | 16.058(86) | 0.938 | |
| 2457293.74568 | 2015-09-28 05:51:00 | 16.154(92) | 0.389 | |
| 2457409.75224 | 2016-01-22 05:58:10 | 15.874(75) | 0.971 | |
| 2458148.65494 | 2018-01-30 03:38:36 | 16.33(10) | 0.748 | |
| 2458767.98108 | 2019-10-11 11:28:34 | 17.173(25) | 0.756 | |
| 2458871.71100 | 2020-01-23 04:58:35 | 16.995(23) | 0.497 | |
| 2458872.69188 | 2020-01-24 04:31:08 | 16.598(20) | 0.922 | |
| 2458872.75550 | 2020-01-24 06:02:45 | 15.883(14) | 0.015 | |
| 2459216.81502 | 2021-01-02 07:27:16 | 16.126(14) | 0.004 | |
| 2459216.85765 | 2021-01-02 08:28:40 | 16.823(21) | 0.066 |
5 Swift X-ray Observations
| ObsID | Date | Time | Exposure | Mean Count Rate |
|---|---|---|---|---|
| (UT) | (UTC) | (s) | (s-1) | |
| 00031535001aaQuiescent state in Table 4: observations with mean count rate s-1. | 2009 Nov 12 | 01:01–12:23 | 4791 | |
| 00032938001aaQuiescent state in Table 4: observations with mean count rate s-1. | 2013 Sep 17 | 02:17–23:33 | 14440 | |
| 00092233001aaQuiescent state in Table 4: observations with mean count rate s-1. | 2016 Sep 15 | 21:18–21:36 | 1078 | |
| 00092233002aaQuiescent state in Table 4: observations with mean count rate s-1. | 2016 Oct 20 | 19:50–22:10 | 1080 | |
| 00092233003aaQuiescent state in Table 4: observations with mean count rate s-1. | 2016 Nov 24 | 01:42–01:58 | 978 | |
| 00092233004aaQuiescent state in Table 4: observations with mean count rate s-1. | 2016 Dec 29 | 14:29–16:12 | 1009 | |
| 00092233005aaQuiescent state in Table 4: observations with mean count rate s-1. | 2017 Feb 2 | 22:49–23:05 | 995 | |
| 00092233006 | 2017 Mar 9 | 04:09–04:26 | 1046 | |
| 00013184001 | 2020 Jan 26 | 00:52–10:56 | 4837 | |
| 00013184002bbFlare state in Table 4: observations with mean count rate s-1. | 2020 Jan 27 | 11:44–14:01 | 2653 | |
| 00013184003 | 2020 Jan 28 | 03:55–21:28 | 4523 | |
| 00013184004 | 2020 Jan 29 | 14:59–23:11 | 3790 | |
| 00013184005aaQuiescent state in Table 4: observations with mean count rate s-1. | 2020 Feb 24 | 01:10–14:03 | 4697 | |
| 00013184006aaQuiescent state in Table 4: observations with mean count rate s-1. | 2020 Feb 25 | 01:10–22:04 | 2027 | |
| 00013184007aaQuiescent state in Table 4: observations with mean count rate s-1. | 2020 Feb 26 | 18:37–23:34 | 2408 | |
| 00013184008aaQuiescent state in Table 4: observations with mean count rate s-1. | 2020 Feb 27 | 07:14–23:38 | 3399 | |
| 00013184009 | 2020 Mar 3 | 00:24–00:49 | 1509 | |
| 00013184010aaQuiescent state in Table 4: observations with mean count rate s-1. | 2020 Mar 25 | 09:21–17:53 | 4618 | |
| 00013184011aaQuiescent state in Table 4: observations with mean count rate s-1. | 2020 Mar 26 | 06:11–09:42 | 3523 | |
| 00013184012 | 2020 Mar 27–28 | 01:08–06:13 | 3737 | |
| 00013184013 | 2020 Apr 1 | 04:05–11:57 | 1549 | |
| 00013184014ccIntermediate state in Table 4: selected observations with long exposure times and mean count rate s-1. | 2020 Apr 24–25 | 20:41–05:01 | 6275 | |
| 00013184015ccIntermediate state in Table 4: selected observations with long exposure times and mean count rate s-1. | 2020 Apr 26–27 | 15:42–17:26 | 10948 | |
| 00013184016ccIntermediate state in Table 4: selected observations with long exposure times and mean count rate s-1. | 2020 Apr 29 | 02:39–09:13 | 6792 | |
| 00095619001bbFlare state in Table 4: observations with mean count rate s-1. | 2020 May 10 | 03:34–06:47 | 2084 | |
| 00095619002bbFlare state in Table 4: observations with mean count rate s-1. | 2020 Aug 2 | 01:11–01:25 | 842 | |
| 00095619003aaQuiescent state in Table 4: observations with mean count rate s-1. | 2020 Oct 25 | 13:39–13:57 | 1078 | |
| 00095619004 | 2021 Jan 17 | 08:37–08:53 | 953 | |
| 00095807001aaQuiescent state in Table 4: observations with mean count rate s-1. | 2021 Nov 28 | 12:13–12:28 | 910 |
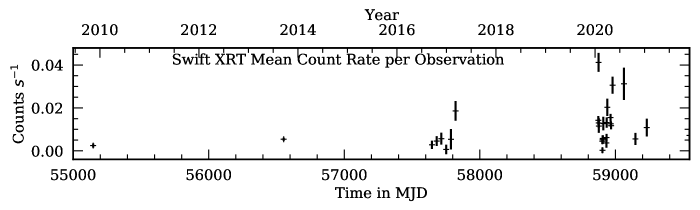
Table 3 is a log of all observations of 1FGL J0523.52529 by the Swift XRT through the end of 2021, while Figure 6 plots their mean count rates, which are highly variable. Xing et al. (2014) analyzed the first two observations (in 2009 and 2013), and found a mean count rate of s-1, corresponding to an average flux of erg cm-2 s-1 in the 0.3–7 keV band. Their fitted photon spectral index was . Using the Gaia EDR3 parallax of indicating a nominal distance of 2.24 kpc, the X-ray luminosity was then erg s-1. In comparison with later observations, this evidently represents the “quiescent” luminosity of 1FGL J0523.52529, which is typical of redbacks (Linares, 2014; Strader et al., 2019).
In 2017 March a significantly higher count rate of was detected, but we did not observe 1FGL J0523.52529 again until 2020, when we triggered Swift observations immediately following our discovery of optical flaring. Fast flaring was then detected in several of these triggered observations, which we analyzed as described next.
5.1 X-ray Light Curves
Using FTOOLS version 6.28, we processed each XRT observation of 1FGL J0523.52529 taken in photon counting mode, and produced background-subtracted light curves in the 0.3–10 keV band. We used an aperture radius of of 25 pixels (59) for the source and 50 pixels (118) for the background region. Within the good time intervals (GTIs), we found the correction factors for bad columns in each 10 s time interval, and applied them to the 60 s time bins of the light curve. Using the 60 s bins, we subtracted the background rate from the corrected source rate. The mean net count rate for each observation is what is listed in Table 3.
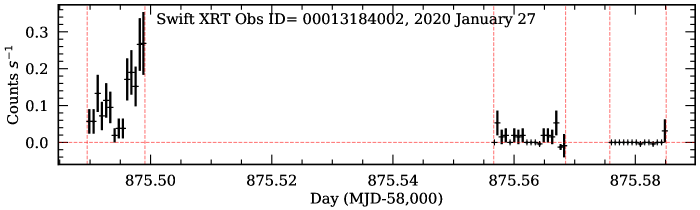
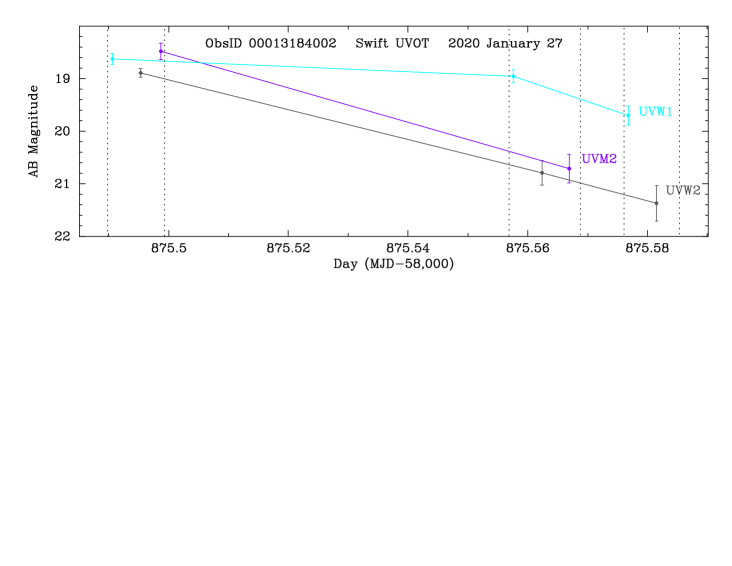
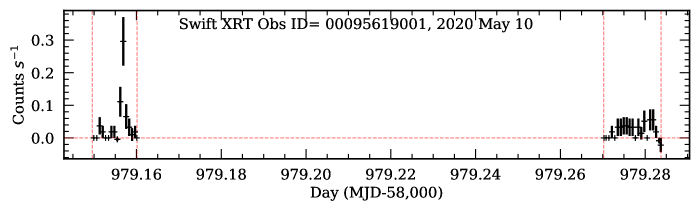
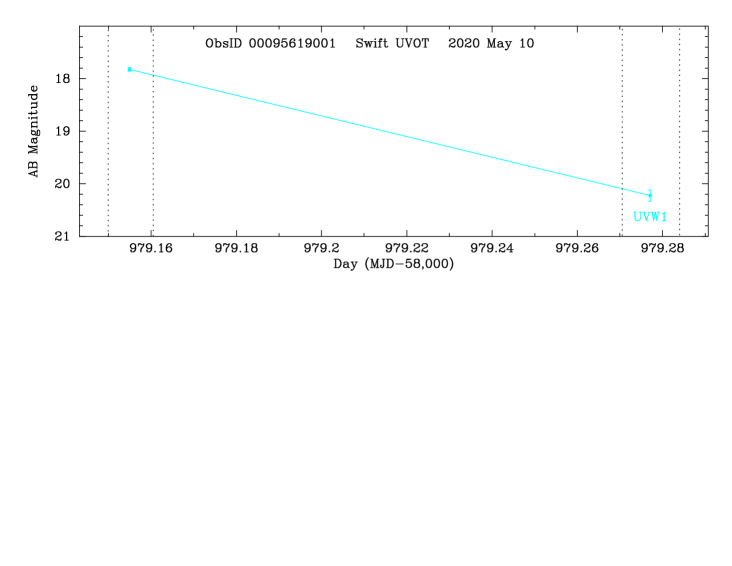
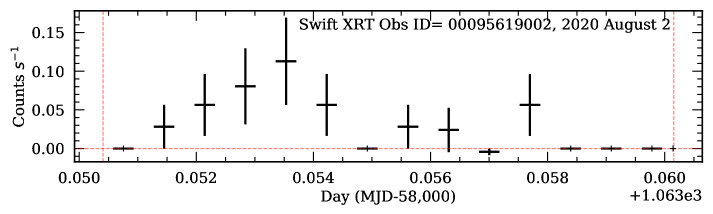
Beyond the highly variable mean count rates, several of the observations contain strong flares on time scales of minutes, similar to the optical flares, with the count rate in a 60 s bin reaching as high as 0.3 s-1, a factor of 100 above the minimum flux level. Three of these flares are shown in Figures 7 and 8. Accompanying the X-ray flares are brightening in the UVOT filters, also shown in the Figures. They will be discussed in Section 6.
The highest instantaneous XRT count rate of 0.3 s-1 occurred in ObsID 00013184002 on 2020 January 27, and ObsID 00095619001 on 2020 May 10, corresponding to a 0.3–10 keV flux of erg cm-2 s-1, and erg s-1 (see Section 5.2). Note from Figure 7 that the flare on January 27 may have peaked even higher, as the X-ray flux was possibly still rising at the end of the first GTI. These are the most luminous X-ray flares that we know of from a non-accreting redback. In comparison, the strong X-ray flares seen in PSR J10482339 (Cho et al., 2018) and 3FGL J0838.82829 (Halpern et al., 2017b) had peak luminosities of erg s-1.
5.2 X-ray Spectra
In order to obtain sufficient statistics for spectral fitting at the various flux levels of 1FGL J0523.52529, we first grouped observations having similar mean count rates into what we call flaring, intermediate, and quiescent states. The observations selected for these groups are indicated in Table 3. For each group, we combined the exposure maps using ximage. For each state we combined the same clean Level 2 event files that were used in Section 5.1, and extracted a spectrum from the final image using the extraction regions used in our light curves. We generated the ancilliary response file using the tool xrtmkarf, which corrects for hot columns and bad pixels, and applied the point-spread-function correction. We used grppha to bin the counts in energy, ignoring energies keV. We used group min 20 to ensure that there are at least 20 counts per bin in order to employ statistics. We grouped any remaining counts into a final bin, which therefore has an upper energy limit defined by the highest energy photon; energy channels above that are ignored. Using XSPEC, we fit absorbed power-law models and integrated their flux over a 0.3–8 keV range. Because the column density is small and weakly constrained by the fits, we also computed models in which is fixed at cm-2, the total Galactic value along the line of sight as given by HI4PI Collaboration et al. (2016). At its high Galactic latitude of , 1FGL J0523.52529 is distant enough for the the total Galactic to apply.
| StateaaSee Table 3 for included observations. | Exposure | bbUnabsorbed 0.3–8 keV flux in units of erg cm-2 s-1. | /dof | ||
|---|---|---|---|---|---|
| (s) | ( cm-2) | (0.3–8 keV) | |||
| Flare | 5579 | 2.54/7 | |||
| 1.48cc held fixed at the Galactic value from HI4PI Collaboration et al. (2016). | 3.62/8 | ||||
| Intermediate | 18015 | 21.47/14 | |||
| 1.48cc held fixed at the Galactic value from HI4PI Collaboration et al. (2016). | 21.52/15 | ||||
| Quiescent | 47031 | 11.25/10 | |||
| 1.48cc held fixed at the Galactic value from HI4PI Collaboration et al. (2016). | 11.45/11 |
Note. — Errors are 90% confidence for one interesting parameter.
The results in Table 4 show that the quiescent state of 1FGL J0523.52529, represented by the 15 faintest observations in Table 3, has a mean 0.3–8 keV luminosity of erg s-1. This is similar to other redbacks (Strader et al., 2019). The intermediate state has a mean luminosity of erg s-1. The flaring states are on average another factor of 2–3 higher, but the three observations in this group are highly variable in themselves. To characterize the peak instantaneous luminosity of a flaring state, we apply a counts-to-erg conversion factor of erg count-1, derived from the average flare spectrum, to the light curves in Figures 7 and 8. The maximum observed count rate of s-1 corresponds to a luminosity of erg s-1. The total range of luminosity displayed by quiescent and flaring observations is thus a factor of , as was seen in the light curves.
Another result is that the photon index of in the flaring state is steeper than in the quiescent state. This is the opposite of what was found in the case of the flaring redback PSR J10482339, in which the quiescent state was similar to that of 1FGL J0523.52529, while the flaring spectrum was even flatter, with (Cho et al., 2018). However, the intermediate state of 1FGL J0523.52529 does have a fairly flat spectrum, with .
6 Swift UVOT Observations
Along with the XRT, 1FGL J0523.52529 was observed with the UVOT through all of its filters (, and ). The photometry was extracted using the uvotsource command in FTOOLS. The net flux was obtained from an aperture of radius for the source and for the background region. Magnitudes are in the AB system (Breeveld, 2011). Table 5 is a log of the observations, including the number of exposures in each filter. Many observations had multiple exposures per filter, which were examined individually to look for variability. Some exposures yielded only upper limits; the number of these is indicated in parentheses. We chose the threshold for reporting a detection as .
All of the UVOT detections are plotted in Figure 9, folded according to orbital phase. This shows the normally dominant effect of ellipsoidal modulation on the flux in , and as expected. The middle panel of Figure 9 shows only the points with uncertainties mag in order clarify the effect. The amplitude of modulation increases toward shorter wavelength, as would be expected for the effects of limb darkening and gravity darkening. In contrast, detections in the UV filters are sparse, and have no obvious dependence on orbital phase. Most of the UV detections may be due to flares, not quiescent photospheric emission.
| ObsID | Date (UT) | Number of ImagesaaNumber of images in each filter. The number of these yielding non-detections (upper limits) is in parentheses. | |||||
|---|---|---|---|---|---|---|---|
| 00031535001 | 2009 Nov 12 | – | – | – | 4 | – | – |
| 00032938001 | 2013 Sep 17 | – | – | 9 | – | – | – |
| 00092233001 | 2016 Sep 15 | – | – | – | – | 1(1) | – |
| 00092233002 | 2016 Oct 20 | – | – | – | – | – | 2(2) |
| 00092233003 | 2016 Nov 24 | – | – | 1 | – | – | – |
| 00092233004 | 2016 Dec 29 | – | – | – | 2 | – | – |
| 00092233005 | 2017 Feb 2 | – | – | – | – | 1(1) | – |
| 00092233006 | 2017 Mar 9 | – | – | – | – | – | 1 |
| 00013184001 | 2020 Jan 26 | 4(1) | 6 | 6 | 7(3) | 3(3) | 6(6) |
| 00013184002 | 2020 Jan 27 | 3 | 3 | 3 | 3 | 3(1) | 3 |
| 00013184003 | 2020 Jan 28 | 7 | 7 | 7 | 7(7) | 7(7) | 7(7) |
| 00013184004 | 2020 Jan 29 | 3 | 3 | 3 | 3(1) | 3(3) | 3(2) |
| 00013184005 | 2020 Feb 24 | 6 | 6 | 6 | 6(5) | 6(6) | 6(6) |
| 00013184006 | 2020 Feb 25 | 3 | 4 | 4 | 4(4) | 3(3) | 4(4) |
| 00013184007 | 2020 Feb 26 | 3 | 3 | 3(1) | 4(3) | 4(4) | 4(4) |
| 00013184008 | 2020 Feb 27 | 2 | 2 | 3 | 3(1) | 2(2) | 2(2) |
| 00013184009 | 2020 Mar 3 | 1 | 1 | 1 | 1(1) | 1(1) | 1(1) |
| 00013184010 | 2020 Mar 25 | 3 | 3 | 3 | 3(2) | 3(3) | 3(3) |
| 00013184011 | 2020 Mar 26 | 3 | 3 | 3 | 3(2) | 3(3) | 3(3) |
| 00013184012 | 2020 Mar 27–28 | 4 | 4 | 4 | 4(2) | 3(2) | 4(2) |
| 00013184013 | 2020 Apr 1 | 2 | 2 | 2(1) | 2(1) | 2(2) | 2(2) |
| 00013184014 | 2020 Apr 24–25 | 4 | 4 | 4 | 4 | 4(4) | 4(2) |
| 00013184015 | 2020 Apr 26–27 | 8 | 8 | 8(1) | 8(7) | 8(7) | 8(5) |
| 00013184016 | 2020 Apr 29 | 5 | 5 | 5(2) | 5(3) | 5(5) | 5(5) |
| 00095619001 | 2020 May 10 | – | – | – | 2 | – | – |
| 00095619002 | 2020 Aug 2 | – | – | – | 1 | – | – |
| 00095619003 | 2020 Oct 25 | – | – | – | 1 | – | – |
| 00095619004 | 2021 Jan 17 | – | – | – | 1 | – | – |
| 00095807001 | 2021 Nov 28 | – | – | – | – | 1(1) | – |
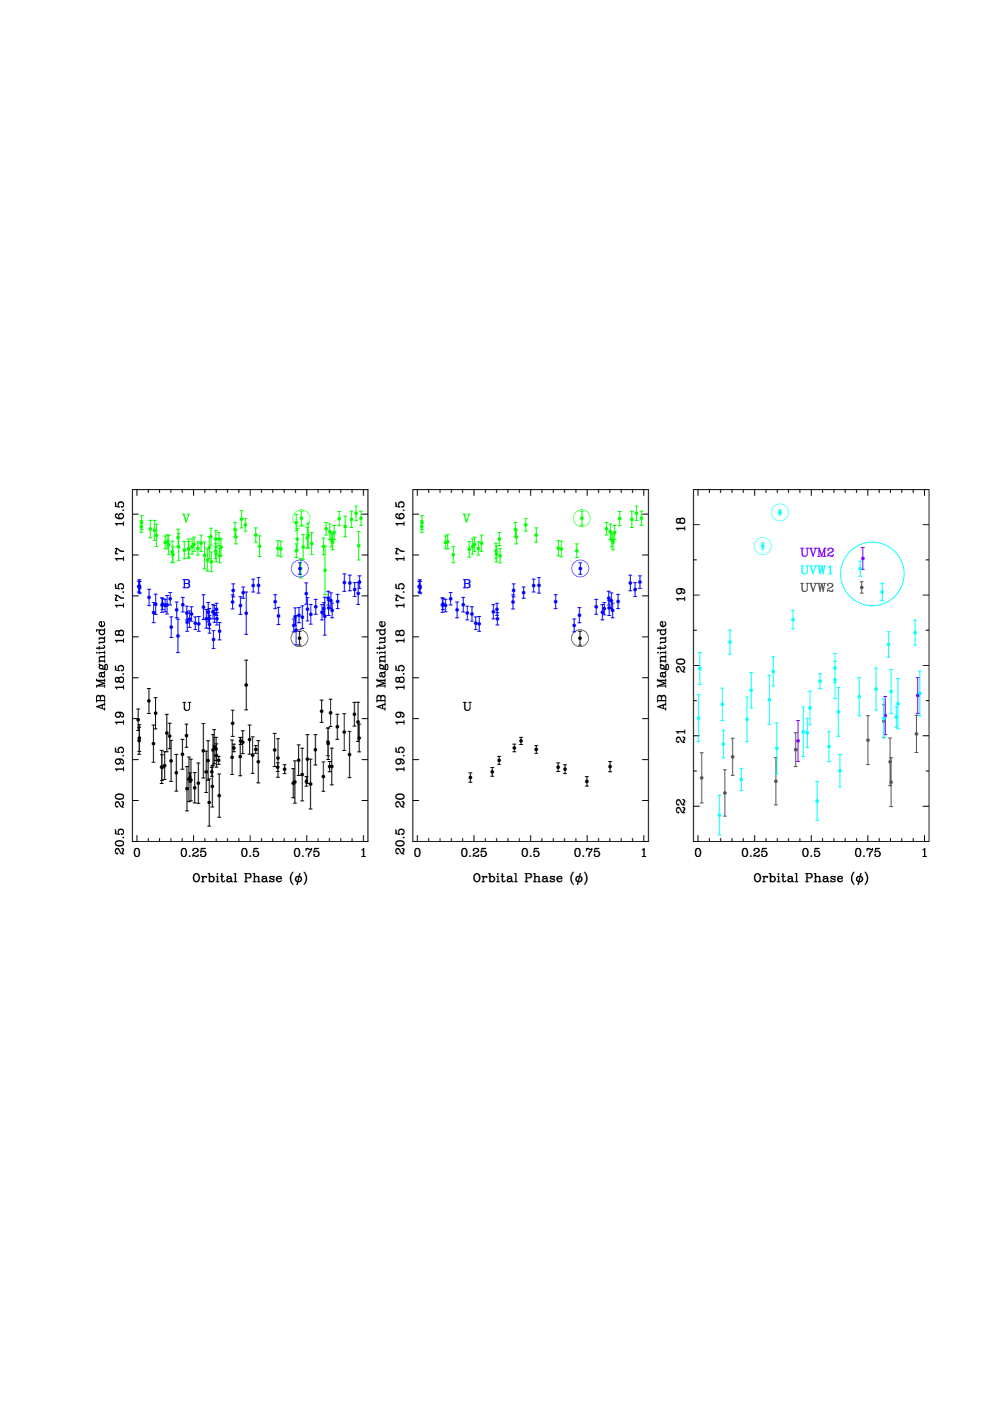
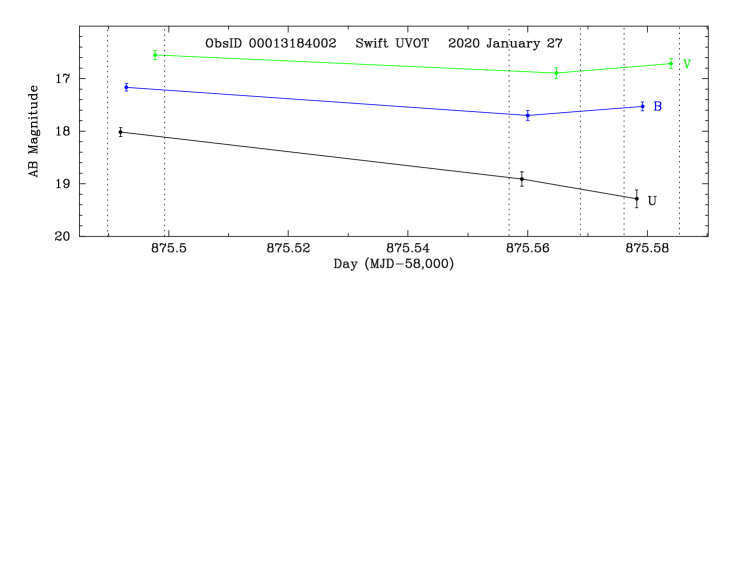
It is clear that the bright X-ray flares are accompanied by brightening in optical and UV, and the amplitude of the flare increases to shorter wavelengths. Table 6 lists the UVOT magnitudes that accompanied the three brightest XRT flares, as shown in Figures 7 and 8. The peak magnitudes of these flares are also circled in Figure 9. In the and bands the stellar photosphere makes a significant contribution to the flux even at the peak of the flare, while in the band the flux during the brightest flare increased by mag. In the UV bands the increase is mag. The brightest magnitude of 17.84 in the filter on 2020 May 10 corresponds to an extinction-corrected luminosity of erg s-1. See Section 7.4 for extinction corrections and the spectral energy distribution of the flare of 2020 January 27.
| ObsID | Date | Day (MJD)aaTime of mid-exposure. | Filter | Magnitude | Phase () |
|---|---|---|---|---|---|
| 00013184002 | 2020 Jan 27 | 58875.4953 | 18.891(80) | 0.723 | |
| 58875.5624 | 20.79(23) | 0.820 | |||
| 58875.5815 | 21.37(34) | 0.848 | |||
| 58875.4987 | 18.48(16) | 0.728 | |||
| 58875.5669 | 20.71(27) | 0.827 | |||
| 58875.4905 | 18.63(11) | 0.716 | |||
| 58875.5576 | 18.96(13) | 0.813 | |||
| 58875.5768 | 19.70(18) | 0.841 | |||
| 58875.4919 | 18.016(84) | 0.718 | |||
| 58875.5590 | 18.91(14) | 0.816 | |||
| 58875.5782 | 19.29(17) | 0.843 | |||
| 58875.4929 | 17.165(70) | 0.719 | |||
| 58875.5600 | 17.700(93) | 0.817 | |||
| 58875.5792 | 17.527(84) | 0.845 | |||
| 58875.4977 | 16.550(86) | 0.726 | |||
| 58875.5648 | 16.89(10) | 0.824 | |||
| 58875.5839 | 16.714(94) | 0.852 | |||
| 00095619001 | 2020 May 10 | 58979.1549 | 17.842(36) | 0.362 | |
| 58979.2779 | 20.22(11) | 0.539 | |||
| 00095619002 | 2020 Aug 2 | 59063.0553 | 18.302(44) | 0.286 |
7 Discussion
7.1 Nature of the Companion Star
Strader et al. (2014) classified the companion as late G or early K based on its optical spectrum. We use the multicolor photometry from ZTF and Swift, correcting for the modest total Galactic extinction of in this high-latitude direction (Schlafly & Finkbeiner, 2011), to derive intrinsic apparent magnitudes in the Vega system. Averaged over the ellipsoidal light curve, mean intrinsic values are . The colors correspond most closely to a K2 main sequence star, but a K2 star has absolute magnitude which at a distance of 2.24 kpc would be seen as . Therefore, the star is larger that a K2 star by a factor of 2.1 in radius. The orbital parameters derived by (Strader et al., 2019) imply a semi-major axis of cm and a Roche lobe radius of cm, which is 1.8 times the radius of a K2 star, in close agreement with the photometry. It is common for redback companions to be less dense than a main sequence star of the same mass.
While the optical modulation is mostly ellipsoidal, considerable variation of its shape makes it difficult to use it to diagnose fundamental properties of a binary, such as the Roche lobe filling factor and orbital inclination. To illustrate this, we overlaid an approximate ellipsoidal model on the 2020 November data (Figure 3), which is devoid of flares. The equations of Morris & Naftilan (1993) were used, together with the correction factors derived by Gomel et al. (2021) that are needed because Morris & Naftilan (1993) is only valid for Roche-lobe filling factors . The illustrated model is not a fit to the data; rather, the spectroscopically determined orbital parameters from Strader et al. (2014) are used together with limb-darkening and gravity-darkening coefficients appropriate for the spectral class (Claret & Bloemen, 2011).
The basic symmetries of the model that are violated by the data are the unequal maxima at the quadrature points (higher) and (lower), and the separation in phase of the minima, which are not exactly 0.5 apart. The minimum at inferior conjunction of the secondary, , lags by about 0.05, appearing instead at (if the orbital ephemeris is still valid). Both of these effects point to an axial asymmetry in which one quadrant of the star away from the L1 point is either dimmer or brighter due to a large starspot, or asymmetric heating, respectively. For example, a dark spot on the trailing, outer quadrant of the star reduces its brightness during . However, detailed analysis of these effects awaits an update to the radial-velocity ephemeris, so as to be able to assign reliable absolute phases to photometric features, not just relative ones.
The observed asymmetries are evidently transient effects, as the light curves during other epochs show different deviations from pure ellipsoidal modulation. In particular, the 2014 December and 2021 November data (Figures 1a and 1h) have more equal maxima, but show evidence of heating at the L1 point, the minimum at being higher than the one at . This is the opposite of what is expected in the absence of heating, when limb darkening and gravity darkening dim the “nose” of the companion. There is some evidence in Figure 1 that the observations of higher flux at coincide with the flaring episodes, in which case enhanced heating during those epochs might be expected. However, it is also possible that all of the light curve variations are due to migration of spots.
Such variations appear to be common in those redbacks whose light curves are mainly ellipsoidal, e.g., in PSR J17232737, which has been interpreted in terms of differentially rotating starspots (van Staden & Antoniadis, 2016). Very similar behavior is seen in PSR J16283205 (Li et al., 2014; Cho et al., 2018). It has unequal maxima, phase lags, and episodic enhanced flux at , although with a sense of asymmetry different from 1FGL J0523.52529. Its peak at is the higher one, and it is the minimum at that lags by . Unlike for 1FGL J0523.52529, the absolute phases of PSR J16283205 are reliable because it has a radio pulsar ephemeris. Another example of a double-peaked but highly asymmetric and variable light curve is that of 3FGL J2039.65618 (PSR J20395617) (Romani, 2015; Salvetti et al., 2015; Strader et al., 2019; Clark et al., 2021; Corongiu et al., 2021). It can be fitted with one or two spots in addition to pulsar heating.
7.2 Orbital Eccentricity?
In view of the variable photometric properties of 1FGL J0523.52529, we revisit the idea that the orbital eccentricity detected by Strader et al. (2014) in their radial velocity study of 1FGL J0523.52529 is instead an artifact of large star spots or localized pulsar heating, which could bias the velocity toward the center of light and away from center of mass of the star. This possibility was considered and dismissed by Strader et al. (2014) because, at the time, they had no evidence of pulsar heating or star spots in the light curve as we do now. On the other hand, even this small eccentricity is unexpected for an old system that should have been circularized by tidal forces.
Consider that when the eccentricity is small, the apparent velocity changes by of order around the orbit. If instead the apparent center of light is biased in certain viewing directions by a fraction times the orbital separation , a similar effect on the radial velocity will result without the need for any eccentricity. Because 1FGL J0523.52529 has the heaviest of the redback companions, its Roche lobe radius is a large fraction of the the orbital separation, , which comfortably exceeds . If the observed light-curve asymmetries of order 10% in flux are due to one quadrant of the star being 20% dimmer than the rest, it would imply that the center of light can be shifted by as much as 10% of the stellar radius, or , which is comparable to that needed to explain the range in velocity without using eccentricity. A new radial velocity study should be able to test for the persistence of , or instead find that it has changed because it is actually a photometric effect of varying temperature structure on the star.
As an aside, we note that would make it essentially impossible to discover pulsations in -rays, a point made by Nieder et al. (2020a) in their analysis of the requirements for such a search of 1FGL J0523.52529 given the optical constraints on its orbit. Discovery of an MSP would be impossible, and even a young pulsar would be difficult. But if the orbit is circular it should be possible to find the pulsations.
7.3 Absence of Accretion Disk
Despite its intense flaring activity, there is no evidence that 1FGL J0523.52529 has entered a tMSP state defined by its sub-luminous accretion disk. The optical emission lines are transient, and the average quiescent X-ray luminosity of erg s-1, although on the high end for redbacks, is well below the erg s-1 range of the tMSPs in their disk-passive state, or erg s-1 in the disk-active state (Linares, 2014).
The UVB colors and orbital variation leave no room for an excess blue continuum from an accretion disk. The Swift UV filter measurements and upper limits in quiescence are especially restrictive, and can be used to derive an upper limit on the mass transfer rate through a standard sum-of-blackbodies accretion disk (Frank et al., 2002). We use the faintest detections and upper limits of mag in the as an upper limit on the flux contributed by a disk. We assume that the disk is truncated at the corotation radius of a and 2 ms pulsar, cm, and is viewed at an inclination angle of . The resulting limit on the accretion rate is g s-1. This is well below the g s-1 rate estimated by Papitto & Torres (2015) for the original tMSPs PSR J1023+0038 and XSS J122704859 using similar assumptions.
7.4 Characteristics and Origin of Flares
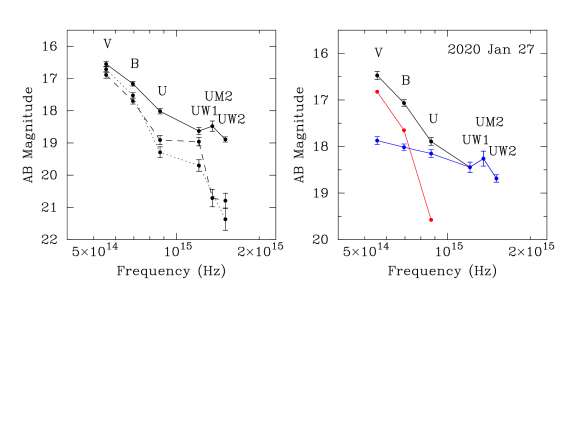
One of the flares caught by Swift has sufficient coverage in the UVOT filters to quantify its spectral energy distribution. The data on 2020 January 27 (Figure 7) has observations in all six filters near the maximum of the X-ray flux, as well as during the decay. In Figure 10 (left) we graph the magnitudes during each of the three GTIs, even though they are not strictly simultaneous.
In order to isolate the spectral energy distribution (SED) of the flare from that of the star, we have to subtract the contribution of the photosphere to each filter, which can be done by using magnitudes from the ellipsoidal light curves in at the appropriate orbital phases. The stellar contribution in the UV bands is negligible, as the quiescent state is not detected in these filters. We corrected all magnitudes for interstellar extinction assuming , and used extinction coefficients for the UVOT filters appropriate for low extinction and hot stars (given the blue colors of the flare) from Siegel et al. (2014). These are , and 8.71 for , and , respectively.
Figure 10 (right) shows, for the peak of the flare, the stellar contribution in red, and the net flare spectrum in blue. The flare spectrum is fitted well by a power law of energy index , where . Although decaying flux is still detected in the UV during the subsequent GTIs, it is not possible to reliably characterize the SED in this phase of the flare, as the contribution reverts to being dominated by the star.
The UV and X-ray spectra at the peak of the flare are each fitted by a power law of energy index 0.7, although they do not connect precisely. The UV flare spectrum lies a factor of above an extrapolation of the X-ray spectrum. Alternatively, to connect the UV and X-ray fluxes at Hz and 1 keV, respectively, a spectral index would be required. This value is marginally consistent with the fitted X-ray index of the flare state in Table 4. If such an interpolation is valid, then the integral of the optical through X-ray flux at the peak of the flare of 2020 January 27 is erg cm-2 s-1, corresponding to a luminosity of erg s-1.
This flare is of different character from flare seen in an optical spectrum of the black widow PSR J13113430 (Romani et al., 2015), which shows a transient spectrum of a He-rich, K stellar atmosphere, as well as He I emission lines. The authors attributed this spectrum to a heating source well below the photosphere, e.g., magnetic reconnection, but triggered externally by interaction with the pulsar wind. In contrast, the optical spectrum of 1FGL J0523.52529 taken during the peculiar, rapidly flaring episode on 2020 February 7 (Figure 2), while having enhanced emission lines, does not show significant change in its continuum shape (apart from having weaker absorption lines). This supports the evidence from the UVOT spectral energy distribution that the optical flaring in 1FGL J0523.52529 is nonthermal, coming from above the photosphere, or at least not affecting a significant fraction of the stellar surface as it does in PSR J13113430, a much smaller star, with (Romani et al., 2015). However, the companion star in 1FGL J0523.52529 is much more luminous; its quiescent magnitudes given in Section 7.1 correspond to almost exactly , while the peak UV and X-ray luminosity of a flare is . So we cannot rule out that localized photospheric heating makes some contribution to the UV spectrum of the 2020 January 27 flare in 1FGL J0523.52529, which exceeds somewhat the extrapolation of its best-fit X-ray spectrum.
We can ask how the flares observed only in MDM -band photometry compare with those observed only by Swift at shorter optical and UV wavelengths. A illuminating example is the end of the brightest flare on 2020 January 24 (Figure 1b), which occurred just 3 days before the bright January 27 flare seen in Swift (Figure 7). The light curves of these are similar, having rise and fall times of minutes in the optical or X-ray. The amplitude of the strongest -band flare is 0.35 mag above the quiescent state (this event was also seen by ZTF), while the Swift flare rose by almost exactly that amount in the band (Figure 10). So it is likely that these are of similar broad-band luminosity, and representative of other flares observed only from the ground.
Of principal interest is whether the flares are ultimately powered by the rotational energy of the pulsar, and if they require the release of magnetic energy, e.g., via reconnection of striped magnetic field compressed in the shocked pulsar wind (Sironi & Spitkovsky, 2011; Córtes & Sironi, 2022). Alternatively, the reservoir of magnetic energy in the companion may be greater, renewable, and capable of channeling the pulsar wind (Sanchez & Romani, 2017). There is some evidence for magnetic reconnection in the X-ray spectra. The flares in redbacks XMMU J083850.38282756.8 and PSR J10482339 (Halpern et al., 2017a; Cho et al., 2018) and the black widow PSR J13113430 (An et al., 2017) have flatter spectra than their quiescent emission, with flare photon index . While the particle energy distribution needed to emit synchrotron with is difficult to achieve by diffusive shock acceleration, it has been produced in simulations of magnetic reconnection cited above. It is surprising therefore that the flare states in 1FGL J0523.52529 have , steeper than that of its intermediate and quiescent states, which have , more typical of other spiders. Considering the extreme properties of this system, it may be an indication that there is an additional emission process contributing to the flare spectrum.
A peak flare luminosity of erg s-1 is comparable to the spin-down power of redbacks, which fall in the range erg s-1 (Strader et al., 2019), while only a fraction of the pulsar wind is intercepted by the companion or its stellar wind. In the rotation-powered scenario, this already implies either a very energetic pulsar, or a large cross section for the target. Even the large estimated Roche-lobe radius, for the relatively massive companion star, which implies that it subtends a fraction of the solid angle seen by the pulsar, would require 1FGL J0523.52529 to be the most energetic redback pulsar unless the spin-down energy is highly beamed in the orbital plane.
Alternatively, if the companion wind is very extensive, being wrapped around the pulsar or even completely enclosing it, then this requirement is relaxed. Such “hidden MSPs” that could be detectable as high-energy sources but invisible in radio were predicted by Tavani (1991) and Tavani & Brookshaw (1993). Interestingly, the same considerations apply to the “huntsman” system 3FGL J1417.54402 (PSR J14174402), a 2.66 ms pulsar with a giant companion (Strader et al., 2016a; Camilo et al., 2016; Swihart et al., 2018). To power its large -ray luminosity, the pulsar spin-down power (which has not yet been measured) must be one of the highest among MSPs, or else the -rays are mostly produced in an extensive wind shock rather than being pulsed emission from the magnetosphere. In any case, an extensive wind is actually inferred from the fact that radio pulsations are infrequently detected from PSR J14174402.
If there are any short- or long-term trends in the rate of occurrence of flares in 1FGL J0523.52529, it is not clear due to its spotty history of observation. First, there does not seem to be a preference for certain orbital phases. Either the location of flaring sites is not restricted, or the emission is not highly beamed. In other redbacks, PSR J10482339 and 3FGL J0838.82829, it does appear that states of quiescence and flaring cycle on timescales of weeks or months (Cho et al., 2018). There may be some indication of such a distribution in the MDM light curves of 1FGL J0523.52529, but we do not yet have enough dense coverage to establish it. Similarly, the occurrence of two of the four flares in the ASAS-SN data within 17 days of each other is suggestive, but not highly significant.
On a time scale years, it is hard to judge because the CRTS (2006–2013), ASAS-SN (2014–2018), and ZTF (2018–2021) have different sampling patterns from our dense MDM time series, which began only in 2020. Only continued monitoring of 1FGL J0523.52529 can determine if its flaring rate or intensity is growing in the long term, which is of interest in case flaring is related to the stage of evolution of a redback relative to the sub-luminous disk state of the tMPSs. So far, there is no evidence from tMSPs that flaring preferentially precedes or follows a transition.
8 Conclusions
We discovered luminous flaring from the putative redback 1FGL J0523.52529 during ground-based time-series monitoring in 2020 January, but it can also be seen occasionally in sky-survey data going back to 2007. The duty cycle of the flares is high enough that triggered Swift monitoring was able was able to detect several similar flares and intermediate level activity over a period of 100 days. After that, sparser optical and X-ray monitoring continued to show intermittent activity through the end of 2021, suggesting that this is regular behavior which is accessible for more detailed study.
An early result of this program was the discovery of intermittent optical emission lines and their correlation with the flaring state, an association that had only been suspected previously for redbacks based on non-contemporaneous observations of optical or X-ray flares and optical spectroscopy. Flares detected simultaneously in the X-ray and optical/UV with Swift appear to have power-law spectra and peak broad-band luminosities of erg s-1, the largest among redbacks. Although such luminosity overlaps with the subluminous disk states of the tMSPs, there is no evidence of a disk in the quiescent optical, UV or X-ray emission.
The X-ray spectra in the quiescent and intermediate states of 1FGL J0523.52529 are typical of spiders, and flat enough () to suggest that magnetic reconnection is occurring. However, the flare spectrum with is steeper than those of flares in other spiders, which suggests it might have a contribution from an additional emission mechanism. 1FGL J0523.52529 has the most massive companion star of the known and candidate redback systems, which may provide ingredients needed to trigger luminous flares. These could include a well-developed stellar wind as a target for shocks, and perhaps significant magnetic field energy of its own.
Apart from the flaring states, the optical light curve shapes, which deviate from pure ellipsoidal modulation, are suggestive of large starspots or variable heating by the pulsar. These effects are common in redbacks. Because of the large size of the companion in 1FGL J0523.52529 relative to the diameter of the orbit, such asymmetries should be considered as a possible distorting effect on the radial velocity curve. The spin-down power of the pulsar is an important unknown factor in the energy budget of the flares and any persistent heating of the companion’s photosphere. Detection of radio or -ray pulsations would add this missing piece. In addition, radio pulsations could be used to diagnose the angular extent, density, and variability of the stellar wind, unless the wind is too perfect a shroud and absorbs the radio pulses completely.
References
- Ablimit (2019) Ablimit, I. 2019, ApJ, 881, 72
- Al Noori et al. (2018) Al Noori, H., Roberts, M. S. E., Torres, R. A., et al. 2018, ApJ, 861, 89
- Alpar et al. (1982) Alpar, M. A., Cheng, A. F., Ruderman, M. A., & Shaham, J. 1982, Nature, 300, 728
- An et al. (2017) An, H., Romani, R. W., Johnson, T., Kerr, M., & Clark, C. J. 2017, ApJ, 850, 100
- Archibald et al. (2009) Archibald, A. M., Stairs, I. H., Ransom, S. M., et al. 2009, Sci, 324, 1411
- Bassa et al. (2014) Bassa, C. G., Patruno, A., Hessels, J. W. T., et al. 2014, MNRAS, 441, 1825
- Bellm et al. (2016) Bellm, E. C., Kaplan, D. L., Bretton, R. P., et al. 2016, ApJ, 816, 74
- Bellm et al. (2019) Bellm, E. C., Kulkarni, S. R., Graham, M. J., et al. 2019, PASP, 131, 018002
- Benvenuto et al. (2012) Benvenuto, O. G., De Vito M. A., & Horvath J. E. 2012, ApJ, 753, L33
- Benvenuto et al. (2014) Benvenuto, O. G., De Vito M. A., & Horvath, J. E. 2014, ApJ, 786, L7
- Benvenuto et al. (2015) Benvenuto, O. G., De Vito M. A., & Horvath, J. E. 2015, ApJ, 798, 44
- Bhattacharyya et al. (2021) Bhattacharyya, B., Roy, J., Johnson, T. J., et al. 2021, ApJ, 910, 160
- Bogdanov et al. (2005) Bogdanov, S., Grindlay, J. E., & van den Berg, M. 2005, ApJ, 630, 1029
- Bogdanov et al. (2011) Bogdanov, S., Archibald, A. M., Hessels, J. W. T., et al. 2011, ApJ, 742, 97
- Bogdanov et al. (2014) Bogdanov, S., Patruno, A. Archibald, A. M., et al. 2014, ApJ, 742, 97
- Bogdanov et al. (2015) Bogdanov, S., Archibald, A. M., Bassa, C., et al. 2015, ApJ, 806, 148
- Bogdanov & Halpern (2015) Bogdanov, S., & Halpern, J. P. 2015, ApJ, 803, L27
- Breeveld (2011) Breeveld, A. A., Landsman, W., Holland, S. T., et al. 2011, in AIP Conf. Proc. 1358, Gamma Ray Bursts 2010, ed. J. E. McEnery, J. L. Racusin, & N. Gehrels (Melville, NY: AIP), 373
- Breton et al. (2013) Breton, R. P., van Kerkwijk, M. H., Roberts, M. S. E., et al. 2013, ApJ, 769, 108
- Brown et al. (2021) Brown, A. G. A., Vallenari, A., Prusti, T., et al. 2021, A&A, 649, A1
- Camilo et al. (2015) Camilo, F., Ray, P. S., Ransom, S. M., et al. 2015, ApJ, 810, 85
- Camilo et al. (2016) Camilo, F., Reynolds, J. E., Ransom, S. M., et al. 2016, ApJ, 820, 6
- Chen et al. (2013) Chen H.-L., Chen X., Tauris T. M., & Han Z., 2013, ApJ, 775, 27
- Claret & Bloemen (2011) Claret, A., & Bloemen, S. 2011, A&A, 529, A75
- Clark et al. (2018) Clark, C. J., Pletsch, H. J., Wu, J., et al. 2018, SciA, 4, eaao7228
- Clark et al. (2021) Clark, C. J., Nieder, L., Voisin, G., et al. 2021, MNRAS, 502, 915
- Cho et al. (2018) Cho, P. B., Halpern, J. P., & Bogdanov, S. 2018, ApJ, 866, 71
- Corbet et al. (2022) Corbet, R., Chomiuk, L., Coley, J. B., et al. 2022, ApJ, submitted, arXiv:2203.05652
- Corongiu et al. (2021) Corongiu, A., Mignani, R. P., Seyffert, A. S., et al. 2021, MNRAS, 502, 935
- Córtes & Sironi (2022) Cortés, J., & Sironi, L. 2022, ApJ, 933, 140
- Coti Zelati et al. (2021) Coti Zelati, F., Papitto, A., de Martino, D., et al. 2021, A&A, 622, A211
- de Martino et al. (2015) de Martino, D., Belloni, T., Falanga, M., et al., 2015, A&A, 550, A89
- Deneva et al. (2016) Deneva, J. S., Ray, P. S., Camilo. F., et al. 2016, ApJ, 823, 105
- De Vito et al. (2020) De Vito, M. A., Benvenuto, O. G. & Horvath, J. E. 2020, MNRAS, 493, 2171
- Draghis et al. (2019) Draghis P., Romani R. W., Filippenko A. V., et al. 2019, ApJ, 883, 108
- Drake et al. (2009) Drake, A. J., Djorgovski S. G., Mahabal A.. et al. 2009, ApJ, 696 870
- Duffy et al. (2022) Duffy, C., Ramsay, G., Steeghs, D., et al. 2022, MNRAS, 510, 1002
- Ferrario & Wickramasinghe (2007) Ferrario, L., & Wickramasinghe, D. 2007, MNRAS, 375, 1009
- Frank et al. (2002) Frank, J., King, A., & Raine, D. J. 2002, Accretion Power in Astrophysics (Cambridge: Cambridge Univ. Press)
- Ginzburg & Quataert (2020) Ginzburg, S., & Quataert, E. 2020, MNRAS, 495, 3656
- Ginzburg & Quataert (2021) Ginzburg, S., & Quataert, E. 2021, MNRAS, 500, 1592
- Gomel et al. (2021) Gomel, R., Faigler, S., & Mazeh, T. 2021, MNRAS, 501, 2822
- Halpern (2022) Halpern, J. P. 2022, ApJ, 932, L8
- Halpern et al. (2017a) Halpern, J. P., Bogdanov, S., & Thorstensen, J. R. 2017a, ApJ, 838, 124
- Halpern et al. (2017b) Halpern, J. P., Strader, J., & Li, M. 2017b, ApJ, 844, 150
- HI4PI Collaboration et al. (2016) HI4PI Collaboration, Ben Bekhti, N., Flöer, L., et al. 2016, A&A, 594, A116
- Hui & Li (2019) Hui, C. Y., & Li, K. L. 2019, Galax, 7, 93
- Jia & Li (2015) Jia, K., & Li, X.-D. 2015, ApJ, 814, 74
- Jia & Li (2016) Jia, K., & Li, X.-D. 2016, ApJ, 830, 153
- Jayasinghe et al. (2019) Jayasinghe, T., Stanek, K. Z., Kochanek, C. S., et al. 2019, MNRAS, 485, 961
- Landolt (1992) Landolt, A. U. 1992, AJ, 104, 340
- Li et al. (2014) Li, M., Halpern, J. P., & Thorstensen, J. R. 2014, ApJ, 795, 115
- Linares (2014) Linares, M. 2014, ApJ, 795, 72
- Littlefield et al. (2022) Littlefield, C., Lasota, J.-P., Hameury, J.-M., et al. 2022, ApJ, 924, L8
- Liu & Li (2017) Liu W.-M., & Li, X.-D. 2017, ApJ, 851, 58
- Manchester (2005) Manchester, R. N., Hobbs, G. B., Teoh, A. & Hobbs, M. 2005, AJ, 129, 1993
- Martini et al. (2011) Martini, P., Stoll, R., Derwent, M. A., et al. 2011, PASP, 123, 187
- Miller et al. (2020) Miller, J. M., Swihart, S. J., Strader, J., et al. 2020, ApJ, 904, 49
- Morris & Naftilan (1993) Morris, S. L., & Naftilan, S. A. 1993, ApJ, 419, 344
- Nieder et al. (2020a) Nieder, L., Allen, B., Clark, C. J., & Pletsch, H. J. 2020a, ApJ, 901, 156
- Nieder et al. (2020b) Nieder, L., Clark, C. J., Kandel, D., et al. 2020b, ApJ, 902, L46
- Pal et al. (2020) Pal, P. S., Tam, P. H. T., Liang, W., et al. 2020, ApJ, 895, L36
- Papitto et al. (2013) Papitto, A., Ferrigno, C., Bozzo, E., et al. 2013, Natur, 501, 517
- Papitto & de Martino (2022) Papitto, A., & de Martino, D. 2022, ASSL, 465, 157
- Papitto & Torres (2015) Papitto, A., & Torres, D. F. 2015, ApJ, 807, 33
- Pletsch et al. (2012) Pletsch, H. J., Guillemot, L., Fehrmann, H., et al. 2012, Sci, 338, 1314
- Radhakrishnan & Srinivasan (1982) Radhakrishnan, V., & Srinivasan, G. 1982, CSci, 51, 1096
- Ricker et al. (2015) Ricker, G. R., Winn, J. N., Vanderspek, R., et al. 2015, JATIS, 1, 014003
- Roberts (2011) Roberts, M. S. E. 2011, in AIP Conf. Proc. 1357, Radio Pulsars: An Astrophysical Key to Unlock the Secrets of the Universe, ed. M. Burgay et al. (Melville, NY: AIP), 127
- Roberts (2013) Roberts, M. S. E. 2013, in IAU Symp. 291, Neutron Stars and Pulsars: Challenges and Opportunities After 80 Years, ed. J. van Leeuwen (Cambridge: Cambridge Univ. Press), 127
- Romani (2015) Romani, R. W. 2015, ApJ, 812, L24
- Romani et al. (2015) Romani, R. W., Filippenko, A. V., & Cenko, B. S. 2015, ApJ, 804, 115
- Romani & Sanchez (2016) Romani, R. W., & Sanchez, N. 2016, ApJ, 828, 7
- Shahbaz et al. (2017) Shahbaz, T., Linares, M., & Breton, R. P. 2017, MNRAS, 472, 4287
- Salvetti et al. (2015) Salvetti, D., Mignani, R. P., De Luca, A., et al. 2015, ApJ, 814, 88
- Sanchez & Romani (2017) Sanchez, N., & Romani, R. W. 2017, ApJ, 845, 42
- Scaringi et al. (2022) Scaringi, S., de Martino, D., Buckley, D. A. H., et al. 2022, NatAs, 6, 98
- Scaringi et al. (2017) Scaringi, S., Maccarone, T. J., D’Angelo, C., et al. 2017, Natur, 552, 210
- Schlafly & Finkbeiner (2011) Schlafly, E. F. & Finbeiner, D. P. 2011, ApJ, 737, 103
- Schroeder & Halpern (2014) Schroeder, J., & Halpern, J. 2014, ApJ, 793, 78
- Sironi & Spitkovsky (2011) Sironi, L. S., & Spitkovsky, A. 2011, ApJ, 741, 39
- Siegel et al. (2014) Siegel, M. H., Porterfield, B. L., Linevsky, J. S., et al. 2014, ApJ, 148, 131
- Smedley et al. (2015) Smedley, S. L., Tout, C. A., Ferrario, L., & Wickramasinghe, D. T. 2015, MNRAS, 446, 2540
- Stappers et al. (2014) Stappers, B. W., Archibald, A. M., Hessels, J. W. T., et al. 2014, ApJ, 790, 39
- Strader et al. (2014) Strader, J., Chomiuk, L., Sonbas, E., et al. 2014, ApJ, 788, L27
- Strader et al. (2016b) Strader, J., Chomiuk, L., Cheung, C. C., et al. 2016a, ApJ, 804, L12
- Strader et al. (2016a) Strader, J., Li, K.-L., Chomiuk, L., et al. 2016a, ApJ, 831, 89
- Strader et al. (2019) Strader, J., Swihart, S., Chomiuk, L., et al. 2019, ApJ, 872, 42
- Strader et al. (2021) Strader, J., Swihart, S. J., Urquhart, R., et al. 2021, ApJ, 917, 69
- Swihart et al. (2021) Swihart, S. J., Strader, J., Aydi, E., et al. 2021, ApJ, 909, 185
- Swihart et al. (2018) Swihart, S. J., Strader, J., Shishkovsky, L., et al. 2018, ApJ, 866, 83
- Swihart et al. (2020) Swihart, S. J., Strader, J., Urquhart, R., et al. 2020, ApJ, 892, 21
- Tauris et al. (2013) Tauris, T. M., Sanyal, D., Yoon, S.-C., & Langer, N. 2013 A&A, 558, A39
- Tavani (1991) Tavani, M. 1991, ApJ, 379, L73
- Tavani & Brookshaw (1993) Tavani, M., & Brookshaw, L. 1993, A&A, 257, L1
- Torres (2021) Torres, G. 2021, RNAAS, 5, 256
- Torres et al. (2017) Torres, D. F., Ji, L., Papitto, L., et al. 2017, ApJ, 836, 68
- Thorstensen & Armstrong (2005) Thorstensen, J. R., & Armstrong, E. 2005, ApJ, 130, 759
- van Staden & Antoniadis (2016) van Staden, A. D., & Antoniadis, J. 2016, ApJ, 833, L12
- Wadiasingh et al. (2017) Wadiasingh, Z., Harding, A. K., Venter, C., Böttcher, M., & Baring, M. G. 2017, ApJ, 839, 80
- Wang et al. (2020) Wang, Z., Xing, Y., Zhang, J., et al. 2020, MNRAS, 493, 4845
- Xing et al. (2014) Xing, Y., Wang, Z., & Ng, C.-Y. 2014, ApJ, 795, 88
- Zheng et al. (2022) Zheng, D., Wang, Z.-X., Xing, Y., & Vadakkumthani, J. 2022, RAA, 22, 025012