United States Politicians’ Tone Became More Negative
with 2016 Primary Campaigns
Abstract
There is a widespread belief that the tone of US political language has become more negative recently, in particular when Donald Trump entered politics. At the same time, there is disagreement as to whether Trump changed or merely continued previous trends. To date, data-driven evidence regarding these questions is scarce, partly due to the difficulty of obtaining a comprehensive, longitudinal record of politicians’ utterances. Here we apply psycholinguistic tools to a novel, comprehensive corpus of 24 million quotes from online news attributed to 18,627 US politicians in order to analyze how the tone of US politicians’ language evolved between 2008 and 2020. We show that, whereas the frequency of negative emotion words had decreased continuously during Obama’s tenure, it suddenly and lastingly increased with the 2016 primary campaigns, by 1.6 pre-campaign standard deviations, or 8% of the pre-campaign mean, in a pattern that emerges across parties. The effect size drops by 40% when omitting Trump’s quotes, and by 50% when averaging over speakers rather than quotes, implying that prominent speakers, and Trump in particular, have disproportionately, though not exclusively, contributed to the rise in negative language. This work provides the first large-scale data-driven evidence of a drastic shift toward a more negative political tone following Trump’s campaign start as a catalyst, with important implications for the debate about the state of US politics.
A vast majority of Americans—85% in a representative survey by the [46]—have the impression that “the tone and nature of political debate in the United States has become more negative in recent years”. Many see a cause in Donald Trump, who a majority (55%) think “has changed the tone and nature of political debate […] for the worse”, whereas only 24% think he “has changed it for the better” [46]. The purpose of the present article is to investigate whether these subjective impressions reflect the true state of US political discourse. The answer to this question comes with tangible societal implications: as politics impacts nearly every aspect of our personal lives [51], changes in political climate can directly affect not only politics itself, but also the well-being of all citizens.
Although longitudinally conducted voter surveys, notably the American National Election Studies, have shown that negative affect towards members of the other party [2, 31, 30], polarization [1], and partisan voting [7] have steadily increased over the last decades, such survey-based studies do not directly measure the tone of political debate—a linguistic phenomenon—and thus cannot answer whether Americans’ impression of increased negativity is accurate. In contrast, we analyze US politicians’ language directly, in an objective, data-driven manner, asking: First, is it true that US politicians’ tone has become more negative in recent years? Second, if so, did Donald Trump’s entering the political arena bring about an abrupt shift [10, 11], or did it merely continue a previously existing trend [23, 32]?
Our methodology draws on a long history of research on the language of politics and its function in democracies [16, 17, 29, 63]. For instance, prior work has used records of spoken and written political language to establish the prevalence of negative language among political extremists [22]; to quantify growing partisanship and polarization [25], as well as displayed happiness [62], among US Congress members; to analyze political leaders’ psychological attributes such as certainty and analytical thinking [33]; to quantify the turbulence of Trump’s presidency [14]; or to measure the effect of linguistic features on the success of US presidential candidates [53] and on public approval of US Congress [20]. A combination of political discourse analysis and psychological measurement tools has further been applied to obtain insights into the personality traits and sentiments of politicians in general [35, 55], as well Donald Trump in particular [36, 3, 47, 38].
One limiting factor in the above-cited works is the representativeness and completeness of the underlying data, since subtle social or political behavior may only reveal itself in sufficiently big and rigorously processed data [39, 37]. On the one hand, Congressional records [25, 62, 20] and transcripts of public speeches [53, 33] record scarce events and do not mirror political discourse as perceived by the average American, whose subjective impression of growing negativity we aim to compare with objective measurements of politicians’ language. On the other hand, news text, despite being a better proxy for the average American’s exposure to political discourse, for the most part does not capture politicians’ utterances directly, but largely reports events (laced with occasional direct quotes) and frequently focuses on a commentator’s perspective. Additionally, most of the above-cited linguistic analyses are not longitudinal in nature, but focus on specific points in time.
Transcending these shortcomings, we take a novel approach leveraging Quotebank [56], a recently released corpus of nearly a quarter-billion (235 million) unique quotes extracted from 127 million online news articles published by a comprehensive set of online news sources over the course of nearly 12 years (September 2008 to April 2020) and automatically attributed to the speakers who likely uttered them by a machine learning algorithm. By focusing on US politicians, we derived a subset of 24 million quotes by 18,627 speakers, enriched with biographic information from the Wikidata knowledge base [58]. (Details about data in Materials and Methods.) As no comparable dataset of speaker-attributed quotes was available before, Quotebank enables us to analyze the tone of US politicians’ public language (as seen through the lens of online news media) at a level of representativeness and completeness that was previously impossible, without confounding politicians’ direct utterances with the surrounding news text.
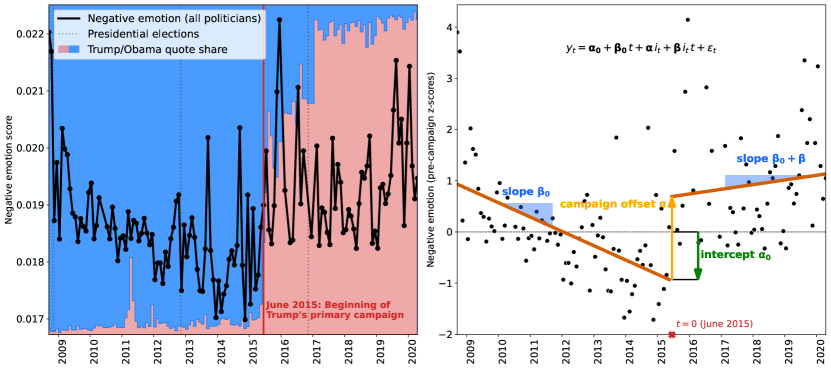
In order to quantify the prevalence of negative language over time, we use established psycholinguistic tools [44] to score each quote with respect to its emotional content, aggregate quotes by month, and work with the resulting time series. Anchored in the average American’s subjective perception that Donald Trump has changed the tone and nature of political debate (see above), we hypothesized the start of his primary campaign in June 2015 as an incision point and fitted linear regression models [28] with a discontinuity in June 2015 to the time series, as illustrated in Fig. 1.
The results (cf. Fig. 1) provide clear evidence of a sudden shift coinciding with the hypothesized discontinuity at the start of Trump’s primary campaign in June 2015, when the overall political tone became abruptly more negative. The effect was large and highly significant: the frequency of negative emotion words soared by 1.6 pre-campaign standard deviations, or by 8% of the pre-campaign mean. Moreover, whereas negative language had decreased continuously during (at least) the first 6.5 years of Obama’s tenure, this trend came to a halt with the June 2015 discontinuity, and the level of negative language remained high afterwards. Similar effects were observed for specific subtypes of negative language (anger, anxiety, and sadness), as well as for swearing terms. Qualitatively, the patterns are universal, emerging within each party and within strata of speaker prominence. Quantitatively, the language of Democrats, more prominent speakers, Congress members, and members of the opposition party is, ceteris paribus, overall more negative, but the shift at the discontinuity remains (and more strongly so for Republicans) when adjusting for these biographic attributes.
These population-level effects are not the results of systematic shifts in the distribution of quoted politicians, but are mirrored at the individual level for a majority of the most-quoted politicians. Moreover, the effect size drops by 40% when omitting Donald Trump’s quotes from the analysis, and by 50% when weighing each speaker equally, rather than by the number of their quoted utterances (but the effect remains highly significant in both cases). Both findings imply that prominent speakers—and particularly Donald Trump—have disproportionately, though not exclusively, contributed to the rise in negative language.
Taken together, these results objectively confirm the subjective impression held by most Americans [46]: recent years have indeed seen a profound and lasting change toward a more negative tone in US politicians’ language as reflected in online news, with the 2016 primary campaigns acting as a turning point. Moreover, contrary to some commentators’ assessment [23, 32], Donald Trump’s appearance in the political arena was linked to a directional change, rather than a continuation of previously existing trends in political tone. Whether these effects are fully driven by changes in politicians’ behavior or whether they are exacerbated by a shifting selection bias on behalf of the media remains an important open question (see Discussion). Either way, the results presented here have implications for how we see both the past and the future of US politics. Regarding the past, they emphasize the symptoms of growing toxicity in US politics from a new angle. Regarding the future, they highlight the danger of a positive feedback loop of negativity.
(a) (b)
Results
To quantify negative language in quotes, we used Linguistic Inquiry and Word Count (LIWC) [44], which provides a dictionary of words belonging to various linguistic, psychological, and topical categories, and whose validity has been established by numerous studies in different contexts and domains [4, 34, 50]. We computed a negative-emotion score for each of the 24 million quotes via the percentage of the quote’s constituent words that belong to LIWC’s negative emotion category. Analogously, we computed scores for LIWC’s three subcategories of the negative emotion category—anger, anxiety, and sadness—as well as for the swear words category. We collectively refer to these five categories as “negative language”.222As a robustness check, we replicated the analysis using the dictionary provided by Empath [18] instead of LIWC. In contrast to LIWC, the categories in Empath’s dictionary were not hand-crafted but generated by a deep-learning model based on a small set of seed words. The results, which are consistent with those from the LIWC-based analysis, are provided in Supplementary Fig. S1, S2, S3, and S4, and in Supplementary Table S1.
In order to obtain a time series for each word category, we averaged individual quote scores by month. By giving each quote the same weight when averaging, we obtain quote-level aggregates; by giving each speaker the same weight, speaker-level aggregates. (Formal definitions in Materials and Methods.) Quote-level aggregates give more weight to more frequently quoted politicians, and thus better capture the overall tone of political language as reflected in the news. Whenever, on the contrary, we reason about politicians, rather than about the overall media climate created by all politicians’ joint output, we use speaker-level aggregates as the more appropriate aggregation.
Table 1 summarizes the prevalence of the above five word categories via the means and standard deviations of the respective quote-level aggregates during the pre-campaign period (September 2008 through May 2015). We observe that one in 54 words expresses a negative emotion; one in 155, anger; one in 339, anxiety; and one in 285, sadness. Swear words, at a rate of one in 2,329, are least common. Given this wide range of frequencies, and in order to make effect sizes comparable across word categories, we standardize all monthly scores category-wise by subtracting the respective pre-campaign mean and dividing by the respective pre-campaign standard deviation.333In order to facilitate the comparability and interpretability of results, standardization always uses the means and standard deviations computed on quote-level aggregates involving all speakers, even in analyses of speaker-level aggregates or of quote-level aggregates when omitting individual speakers. The resulting effect sizes, in units of pre-campaign standard deviations, become more palpable when expressed as multiples of the corresponding pre-campaign means. For this purpose, the rightmost column of Table 1 lists coefficients of variation, i.e., ratios of standard deviations and means.
| Word category | Mean | Std. dev. | ||
| Negative emotion | 0.01853 | 0.00090 | 54 | 4.8% |
| Anger | 0.00647 | 0.00055 | 155 | 8.4% |
| Anxiety | 0.00295 | 0.00022 | 339 | 7.3% |
| Sadness | 0.00351 | 0.00014 | 285 | 4.1% |
| Swear words | 0.00043 | 0.00015 | 2,329 | 33.9% |
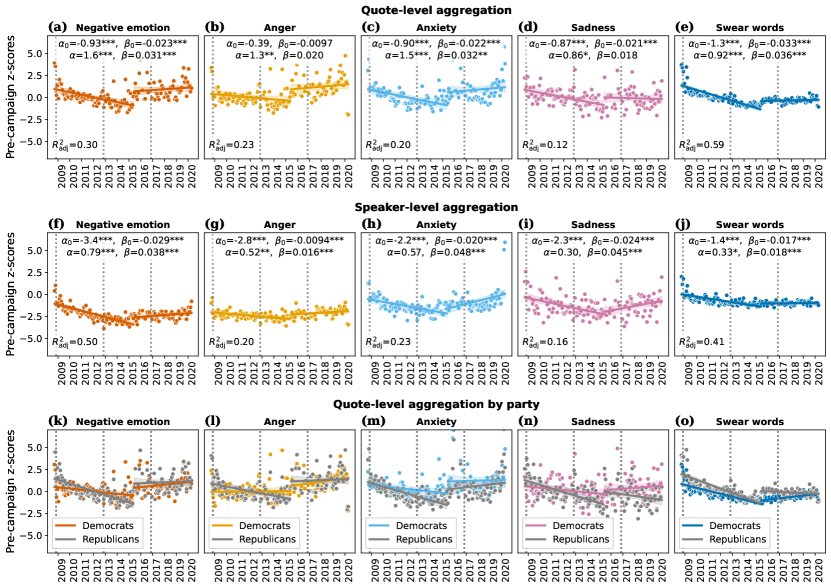
Temporal evolution of negative language. Fig. 2 visualizes the evolution of negative language between September 2008 and April 2020, with one row per aggregation method, one column per word category, and one point per monthly aggregate score. In order to quantify the shape of the curves, we fitted ordinary least squares linear regression models with a discontinuity in June 2015, the starting month of Donald Trump’s primary campaign. For a given word category, we model the aggregate score for month as
| (1) |
where , with corresponding to June 2015; indicates whether is located before vs. after the campaign start (i.e., for , and for ); and is the residual error. As illustrated in Fig. 1(b), the coefficient captures the immediate jump coinciding with the campaign start, and , the change in slope, such that and describe the slopes of the regression lines before and after the campaign start, respectively. Fig. 2 plots the fitted regression lines, alongside 95% confidence intervals.
We first focus on the time series of quote-level aggregates (Fig. 2(a–e)). The regression coefficients indicate a significant, sudden increase in the relative frequency of negative emotion words (Fig. 2(a)) in June 2015, by () pre-campaign standard deviations (SD), translating to a relative increase of 8% over the pre-campaign mean (cf. Table 1). All three subcategories of negative emotion words, as well as swear words, also saw significant jumps in June 2015: anger, by 1.3 SD ( of the pre-campaign mean, , Fig. 2(b)); anxiety, by 1.5 SD (, , Fig. 2(c)); sadness, by 0.86 SD (, , Fig. 2(d)); and swear words, by 0.92 SD (, , Fig. 2(e)).444Note that the pre-campaign regression line for swear words (Fig. 2(e)) underestimates the values just before the discontinuity, mostly due to outliers at the left boundary (2008/09). For swear words, the actual June 2015 jump should thus be considered to be smaller than the estimate . The June 2015 discontinuity was not only associated with a sudden increase in negative language, but also with a change in slope: whereas the frequency of negative emotion words (Fig. 2(a)) had steadily and significantly decreased over the first 6.5 years of Obama’s tenure by SD per month (), i.e., by about a quarter SD per year, this trend came to a halt in June 2015, with a (non-significantly) positive slope of (compound ) from June 2015 onward.555These results hold when removing outlier months whose quote-level aggregate score lies more than three standard deviations from the mean (Supplementary Fig. S1, and Supplementary Tables S5 and S7).
We emphasize that the June 2015 discontinuity was chosen ex ante based on incoming hypotheses grounded in the general public’s subjective impression that Donald Trump’s entering the political scene had changed the tone of US politics [46]. A data-driven analysis, conducted ex post, revealed that June 2015 is in fact the optimal discontinuity for modeling the data: out of 140 regression models analogous to Eq. 1, but each using another one of the 140 months of our analysis period as the discontinuity, the model with the June 2015 discontinuity yielded the best fit for negative emotion words and anger (Supplementary Fig. S5). (For anxiety and sadness, slightly better fits were obtained when using different discontinuities; for swear words, a 2009 discontinuity led to a better fit due to outliers around that time; see Supplementary Fig. S5.)
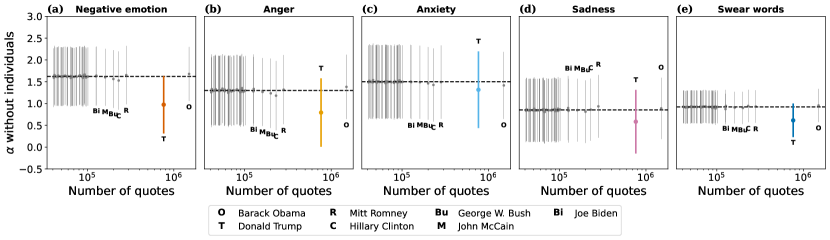
Role of speaker prominence. When repeating the analysis using speaker-level, rather than quote-level, aggregates, i.e., weighing all speakers equally when averaging, all of the above effects persisted qualitatively, but were reduced quantitatively (Fig. 2(f–j)): in each of the five word categories, the immediate increase at the June 2015 discontinuity dropped by between one-third and one-half, remaining significant for negative emotions, anger, and swear words ( 0.0025, and 0.030, respectively), but becoming non-significant for anxiety and sadness ( and , respectively). The change of slope observed in the quote-level analysis also persisted in the speaker-level analysis.
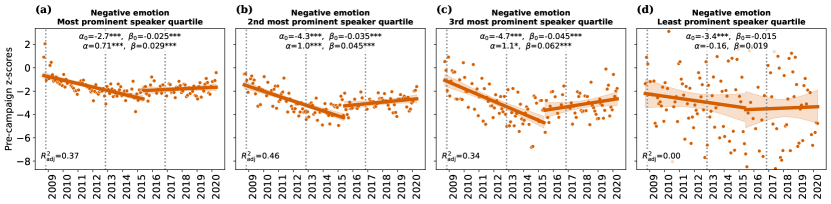
The fact that speaker-level effects are weaker than quote-level effects indicates that prominent, highly quoted speakers contribute disproportionally to the increase in negative language. To confirm this conclusion more directly, we divided the speakers into four quartiles with respect to the number of quotes attributed to them, and repeated the speaker-level analysis for each quartile individually. Fig. 3 shows (1) that the abrupt increase in negative emotion words emerges in all strata of speaker prominence except the least prominent stratum, and (2) that quotes by more prominent speakers generally contain more negative emotion words. (Results for other word categories in Supplementary Fig. S3.)
Biographic correlates of negative language. The patterns identified above—a sudden increase in negative language in June 2015 followed by a change in slope—hold across party lines,666All coefficients of Fig. 2(k–o) are positive. For Republicans, all are significant (); for Democrats, the coefficients for anger () and sadness () are non-significant (). but are more pronounced for Republicans, as seen in Fig. 2(k–o), which tracks the (quote-level) evolution of negative language over time, analogously to Fig. 2(a–e), but separately for quotes by Democrats vs. Republicans. For instance, the party-wise estimates of the June 2015 increase in negative emotion words is pre-campaign SD for Democrats () and SD for Republicans ().
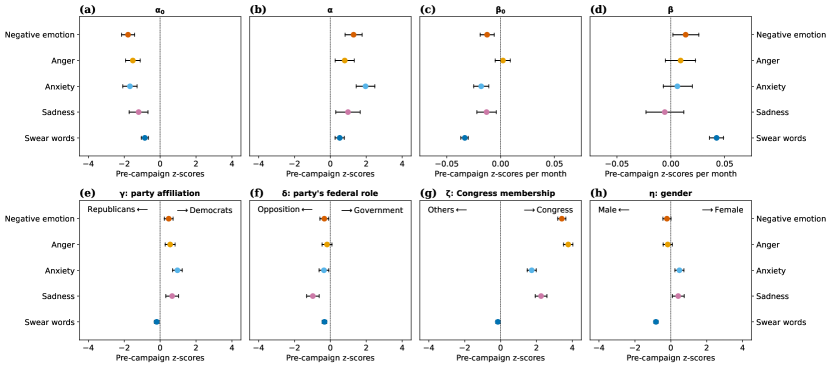
We further considered the possibility that the distribution of speaker characteristics may have changed over time; e.g., members of one party or gender may have become more frequently quoted over time. To account for potential confounding due to such factors, we repeated the regression analysis with added control terms for four biographic attributes: party affiliation (Republican, Democrat), the party’s federal role (Opposition, Government), Congress membership (Non-Congress, Congress), and gender (Male, Female).777Due to small sample size, we discarded speakers of a non-binary gender according to Wikidata. For a given month, party affiliation fully determines the party’s federal role, so for each month, the set of speakers can be partitioned into speaker groups, one per valid attribute combination. We computed monthly aggregate scores separately for each speaker group , obtaining eight aggregate data points per month, and modeled them jointly using the following extended version of Eq. 1:
| (2) |
where (or 0) if group contains Democrat (or Republican) speakers, and analogously for , , and .
Inspecting the fitted coefficients (shown in Fig. 4 for quote-level aggregation; for speaker-level aggregation, see Supplementary Fig. S6), we make two observations: First, the sudden June 2015 jump in negative language (Fig. 4(b)) appears even after adjusting for the four biographic attributes. Second, we observe systematic correlations of negative language with biographic attributes, whereby quotes by members of the opposition party, Congress members, and Democrats contain, ceteris paribus, significantly more negative language. Moreover, quotes by females contained more anxiety and sadness, and quotes by males, more negative emotion, anger, and swear words. The fact that quotes by members of the opposition party contain more negative language may reflect their role as corrective agents in the democratic process. The fact that quotes by Congress members contain more negative language echoes previous work that has highlighted high-ranked politicians’ role not only as deputies of their own party, but also as antagonists of the opposing party, epitomized in the finding that “ideological moderates won’t run” [54] for Congress.
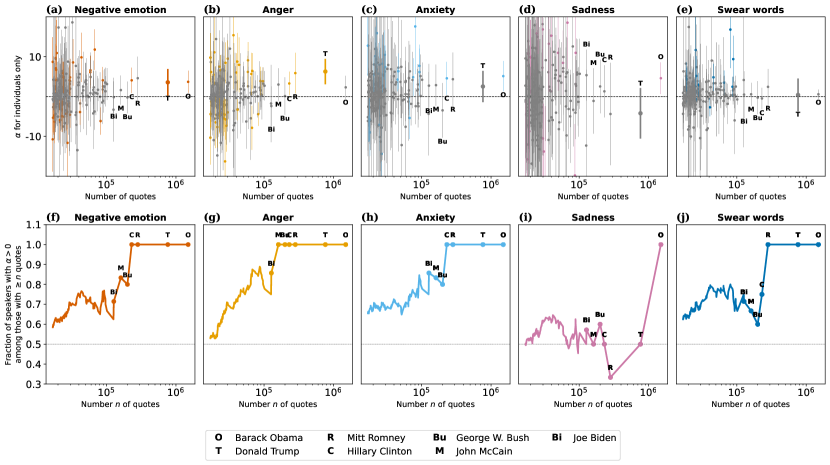
Role of individual politicians. In order to determine to what extent the above population-level effects mirror individual-level effects, we fitted regression models (cf. Eq. 1) to individual speakers’ time series and analyzed the corresponding coefficients (i.e., the size of the June 2015 jump; for completeness, in Supplementary Fig. S7). In order to avoid data sparsity issues, this analysis focuses on the 200 most-quoted speakers, with plotted in Fig. 5(a–e). Additionally, Fig. 5(f–j) plots the fraction of speakers with positive among the speakers with at least quotes, as a function of . We observe that, although many individual coefficients are non-significant (, gray confidence intervals in Fig. 5(a–e)), the majority of coefficients are positive, particularly among the top most-quoted speakers (as manifested in the increasing curves of Fig. 5(f–j)). For instance, for negative emotion words (Fig. 5(f)), all of the top four most-quoted politicians have positive . Among the top 50, 74% have positive ; among the top 100, 63%; and among the top 200, 59%. In other words, the June 2015 discontinuity emerges not only by aggregating at the population level, but mirrors a disruption that can also be perceived in the most-quoted politicians’ individual language. We further illustrate (Supplementary Fig. S8) using as examples the two presidents (Barack Obama, Donald Trump), vice presidents (Joe Biden, Mike Pence), and runners-up (Mitt Romney, Hillary Clinton) from the study period. Four of these six speakers were associated with a significant () positive for negative emotion words, and none with a significant negative .888Interestingly, although both Donald Trump (, ) and Barack Obama (, ) followed the population-wide pattern by increasing their frequency of negative emotion words in June 2015, their pre- and post-discontinuity slopes were opposite to the population-wide pattern: their language first became more negative, then less negative.
Next, we sought evidence whether individual politicians contributed particularly strongly to the overall increase in negative language. We proceeded in an ablation study: for each of the 50 most quoted speakers, we repeated the quote-level regression (Fig. 2(a–e)) on a dataset consisting of all quotes except those from the respective speaker. If is particularly low when removing a given speaker, that speaker contributed particularly strongly to the overall June 2015 increase in negative language. Fig. 6(a) shows that no single speaker’s removal leads to an important change in for negative emotion words, with one exception: Donald Trump. By removing Donald Trump’s quotes, the June 2015 increase in negative emotion words drops by 40%, from to pre-campaign SD.999 More precisely, . When considering quotes by Republicans only (cf. Fig. 2(k–o)), drops by 43% when removing Trump’s quotes, from 2.3 to 1.3 pre-campaign SD (Supplementary Tables S9 and S10). Put differently, by adding Donald Trump’s quotes, the June 2015 increase in negative emotion words is boosted by 63%. Note that this is not merely an artifact of Trump’s being quoted especially frequently: Obama was quoted about twice as frequently as Trump over the course of the 12-year period, yet removing his quotes does not notably affect the June 2015 increase in negative emotion words. Qualitatively similar results hold for the other word categories, in particular for swear words (Fig. 6(e); in Supplementary Fig. S9 for completeness). Although the size of the June 2015 jump in negative emotion words decreased drastically when removing Trump’s quotes, note that it remained highly significant (). That is, Trump was the main, but not the sole, driver of the effect.
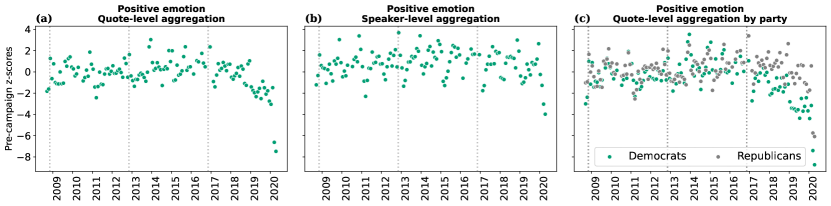
Positive emotion words. Complementary to the five word categories related to negative language analyzed above, we also conducted an exploratory analysis of positive language, as captured by LIWC’s positive emotion category. As seen in Fig. 7(a), the time series of positive emotion words does not simply mirror that of negative emotion words. In particular, no particular changes are observed in June 2015. Rather, positive emotion words appear stable well into Trump’s term, and then decline. (The best regression fit is achieved when using July 2018 as the discontinuity, with a sharp drop in quality of fit after February 2019; Supplementary Fig. S10.) As in the case of negative emotion words, the same pattern emerges within each party (Fig. 7(c)), with a more pronounced drop in positive emotion words for Democrats than for Republicans.
Discussion
The goal of this work has been to determine the accuracy of the average American’s subjective impression (as of mid 2019) that “the tone and nature of political debate in the United States has become more negative in recent years”, and that Donald Trump “has changed the tone and nature of political debate […] for the worse” [46]. Based on an analysis of 24 million quotes uttered by 18,627 US politicians between 2008 and 2020, we conclude that both of the above impressions are largely correct.
US politicians’ tone indeed became suddenly and significantly more negative with the start of the 2016 primary campaigns in June 2015, and the frequency of negative language has remained elevated ever since. Intriguingly, the shift at this incision point coincides with a similar abrupt shift in political polarization on online platforms [59, 21]. The sudden increase in negative language reported here was not only significant, but also strong; e.g., the frequency of negative emotion words jumped up by 1.6 pre-campaign standard deviations, or by 8% of the pre-campaign mean. The disruption becomes particularly stark when contrasted with the first 6.5 years of Obama’s tenure, during which negative language had decreased steadily—at odds with a commonly held belief that Trump merely continued an older trend [23, 32]. The potential of negativity, incivility, and fear as tools to support political campaigns has been long known [9, 26] and might explain the increase of negative language during the campaigns. It cannot, however, explain the fact that the boost in negative language has continued for years after the campaigns had ended.
Rather, our results show that political debate during Donald Trump’s entire term was characterized by a negative tone, and they specifically point to Trump as a key driver of this development: when removing Trump’s quotes from the corpus, the magnitude of the June 2015 jump in the frequency of negative emotion words drops by 40%. Interestingly, Trump’s own negative tone (Supplementary Fig. S8(z)) followed long-term trends opposite to the population-wide trends, with an initial increase and a subsequent decrease (and with a sudden June 2015 increase akin to that of the population). But as his language was overall far more negative than the average (Trump’s mean monthly average was 8.0 pre-campaign standard deviations larger than the overall mean monthly average), he strongly skewed the overall tone toward the negative end when he moved to the center of the media’s attention [43].
Despite Trump’s disproportionate impact, the increase in negative language was, however, not due to Trump alone. It remained significant in various complementary analyses: when removing Trump’s quotes from the analysis, when giving equal weight to all speakers, when analyzing each party separately, and when analyzing the most-quoted speakers individually. The negative tone of others might be partly provoked by Trump’s statements and actions, but as we do not have access to a counterfactual world without Trump, our analysis cannot speak to this possibility.
Our analysis also cannot disambiguate to what extent the observed shift in negative language is caused by a real shift in what politicians say vs. a shift in what the media choose to report. It is well known that media outlets are biased in what they report [24, 48, 49], typically towards negative news that tend to increase engagement on readers’ behalf [27], and this bias may have drifted during the 12 years analyzed here. Future work may investigate this possibility by comparing quotes reported in the media to complete records of certain politicians’ utterances in certain contexts, e.g., via Congressional records or public speeches [41]. (But whether the shift was caused by politicians or by the media, the effect would be identical: a more negative tone as perceived by news-reading citizens.)
Moreover, although word-counting is a powerful tool for detecting broad trends in large textual data [45, 34], and although our results are robust to the specific choice of dictionary (Empath [18] yields qualitatively identical results to LIWC [44]; Supplementary Fig. S1, S2, S3, S4, and S11, and Supplementary Table S1), word-counting is crude and insensitive to nuances in context [8]. Our findings should thus be considered a starting point and hypothesis generator for more detailed analyses based on a closer inspection of the text and context of quotes, e.g., using a combination of advanced natural language processing tools and human annotation in order to shed light on the relation between negative language and polarization and partisanship: Has politicians’ tone become more negative specifically when they talk about opponents?
The present study is also limited with respect to its time frame. Although Quotebank [56] is the largest existing corpus of speaker-attributed quotes in terms of size and temporal extent, the 12 years it spans are but a short sliver of the United States’ long political history. It is thus unclear when the decrease in negative language at the beginning of the corpus (during the initial 6.5 years of Obama’s tenure) started. Gentzkow et al. [25] observed a concurrent decrease in partisan language in Congressional speeches during Obama’s tenure (2009–2016), which might be yet another manifestation of the processes that underlie the initial decrease in negative language observed here. Gentzkow et al.’s corpus of Congressional speeches, however, spans a much longer time (144 years, 1873–2016), during which overall partisanship increased much more—especially from the 1980s onward—than it eventually decreased during Obama’s tenure. We must therefore consider the possibility that, analogously, the 2009–2015 decrease in negative language may have been merely a short anomaly in a longer increasing trend in negative language. (Unfortunately, Gentzkow et al.’s corpus ends with Obama’s tenure, so we cannot compare trends in negative language to trends in partisan language during Trump’s tenure.)
We saw that the June 2015 rise in negative language was not accompanied by a simultaneous drop in positive language. Rather, maybe in line with a general positivity bias in human language [13], positive language remained stable until it eventually dropped during Trump’s term. What happened at this point is an open question that lies beyond the scope of this work. The phenomenon highlights, however, that positive and negative emotion words are not necessarily complementary. From the start of the 2016 primary campaigns through the first half of Donald Trump’s term, political tone was both highly positive and highly negative—akin to Trump’s own style, characterized by typical features of affective polarization such as positive self-representation and negative other-presentation [3, 36, 38]: “Sorry losers and haters, but my I.Q. is one of the highest -and you all know it! Please don’t feel so stupid or insecure,it’s not your fault”.101010https://web.archive.org/web/20151013150633/https://twitter.com/realDonaldTrump/status/332308211321425920
This said, a key contribution of this work is the conclusion that, despite Donald Trump’s key role in setting the tone of political debate, the shift towards a more negative tone permeates all of US politics. The consequences are tangible, as shown by research that highlights the detrimental effects of affective polarization on altruism [61], trust [40], and opinion formation [15, 19], and by polls showing that politics has become a stressful experience for Americans [46, 5], exacting an ever increasing toll on their physical, emotional, and social well-being [51, 6]. Finding ways to break out of this cycle of negativity is one of the big challenges faced by the United States today.
Materials and Methods
US politicians. We considered as politicians all people for whom the Wikidata knowledge base [58] (version of 27 October 2021) lists “politician” (Wikidata item Q82955) or a subclass thereof as an occupation (P106). Given our focus on the United States, we included only those politicians whose party affiliation (P102) was listed as Democrat (Q29552) or Republican (Q29468). We considered as members of Congress those for whom Wikidata listed a US Congress Bio ID111111For instance, https://bioguide.congress.gov/search/bio/S000148 (P1157), making no distinction between former and active members of Congress. Due to the small number of speakers of a non-binary gender, we included only speakers whose gender (P21) was listed in Wikidata as male (Q6581097) or female (Q6581072).
Quotebank. The analyzed quotes were obtained from Quotebank [56], a publicly available [57] corpus of 235 million unique speaker-attributed quotes extracted from 127 million English news articles published between September 2008 and April 2020, provided by the large-scale online media aggregation service Spinn3r.com. While Spinn3r.com collects and supplies content from a comprehensive set of news domains [60], it also includes much content beyond news alone, including “social media, weblogs, news, video, and live web content” [52]. Therefore, Quotebank was extracted from a filtered data set consisting only of content from a set of about 17,000 online news domains, defined as the set of domains appearing at least once in the large News on the Web corpus [42], which has been collecting large numbers of news articles from Google News and Bing News since 2010 and may thus be considered to provide a comprehensive list of English-language media outlets. We emphasize that the News on the Web corpus was only used for defining the set of news domains. It was not used for obtaining the news articles themselves, which originated from Spinn3r.com only.
We use the quote-centric (as opposed to the article-centric) version of Quotebank, which contains one entry per unique quote and aggregates information from all news articles in which the quote occurs. In constructing Quotebank, a machine learning algorithm (based on the large pre-trained BERT language model [12]) was used to infer, for each quote, a probability distribution over all speaker names mentioned in the text surrounding the quote (and an additional “no speaker” option), specifying each speaker’s estimated probability of having uttered the quote. For a given quote, we maintained only the name with the highest probability and consider it to indicate the speaker of the quote (a heuristic that was shown to have an accuracy of around 87% [56]). A speaker name may be ambiguous. In such cases, Quotebank does not attempt to disambiguate the name, but rather provides a list of all speakers to whom the name may refer, where speakers are identified by their unique ID from the Wikidata knowledge base [58]. In our analysis, we attributed quotes that were linked to ambiguous speaker names (less than 6% of all quotes, see below) to each speaker to whom the respective name may refer.
To further clean the data set, we discarded quotes that were clearly non-verbal (e.g., consisting of URLs, HTML tags, or dates only). Moreover, on some days, Spinn3r.com, which provided the news articles for Quotebank, failed to deliver content due to technical problems [56]. We therefore identified missing days as those having less than 10% of the median number of unique quotes and dropped eight (out of 140) months with 20 or more missing days: May 2010, June 2010, January 2016, March 2016, June 2016, October 2016, November 2016, January 2017.
Quotes by US politicians. Keeping only quotes attributed to US politicians (see above), we obtained 24 million quotes attributed to 18,627 unique US politicians. Out of these, 4,487 were female, 14,140 male; 9,390 were Democrats, 9,237 Republicans;121212 Out of an original set of 18,954 US politicians appearing in Quotebank, Wikidata listed 327 as (former) members of both parties, usually because they switched membership during their careers. Out of these 327, we manually checked the 21 politicians with over 10,000 quotes, of whom 16 could be unambiguously assigned to one party for the study period. The remaining 311 politicians were dropped from the analysis. and 1,790 were labeled as members of Congress. The most prolific speakers were Barack Obama (1.5m quotes),131313It seems unreasonable that any single person could utter over 300 different quote-worthy statements a day. Instead, the large number can be explained by news outlets attending to different parts of a politician’s spoken output. For instance, a long sentence can be quoted in various ways. Donald Trump (763k quotes), Mitt Romney (281k quotes), Hillary Clinton (230k quotes), George W. Bush (200k quotes), John McCain (161k quotes), and Joe Biden (127k quotes). For a list of the 30 most frequently quoted politicians, see Supplementary Table S17. Although, as mentioned, ambiguous names led to some quotes being attributed to multiple speakers, this happened rarely: the vast majority (94.3%) of quotes were attributed to a single politician, 4.3% to two politicians, 1.2% to three politicians, and 0.13% to four politicians. Supplementary Fig. S12 shows the number of quotes and the number of unique speakers per month.
Aggregation methods. Consider a fixed LIWC word category and a fixed month . Let be the set of speakers with at least one quote during month . Let be the set of quotes attributed to speaker during month , and let be the set of all quotes from month .141414The (few) quotes attributed to multiple speakers are included in once per speaker. Let be quote ’s score for word category .
Then, the quote-level aggregate score for word category in month is defined as
and the speaker-level aggregate score, as
That is, in quote-level aggregation, every speaker contributes with weight proportional to their number of quotes, whereas in speaker-level aggregation, all speakers contribute with equal weight.
Data availability. The Quotebank corpus is publicly available on Zenodo at https://doi.org/10.5281/zenodo.4277311. Aggregated data derived from Quotebank are available on GitHub at https://github.com/epfl-dlab/Negativity_in_2016_campaign.
Code availability. All analysis code is available on GitHub at https://github.com/epfl-dlab/Negativity_in_2016_campaign.
References
- [1] Alan I. Abramowitz and Kyle L. Saunders “Is Polarization a Myth?” In The Journal of Politics 70.2 The University of Chicago Press, Southern Political Science Association, 2008, pp. 542–555 DOI: 10.1017/S0022381608080493
- [2] Alan I. Abramowitz and Steven Webster “The Rise of Negative Partisanship and the Nationalization of U.S. Elections in the 21st Century” In Electoral Studies 41, 2016, pp. 12–22 DOI: 10.1016/j.electstud.2015.11.001
- [3] Sara Ahmadian, Sara Azarshahi and Delroy L. Paulhus “Explaining Donald Trump via Communication Style: Grandiosity, Informality, and Dynamism” In Personality and Individual Differences 107, 2017, pp. 49–53 DOI: 10.1016/j.paid.2016.11.018
- [4] Georg W. Alpers et al. “Evaluation of Computerized Text Analysis in an Internet Breast Cancer Support Group” In Computers in Human Behavior 21.2, 2005, pp. 361–376 DOI: 10.1016/j.chb.2004.02.008
- [5] American Psychological Association “Stress in America: Coping with Change” In Stress in America Survey, 2017 URL: https://www.apa.org/news/press/releases/stress/2016/coping-with-change.pdf
- [6] American Psychological Association “Stress in America: Generation Z” In Stress in America Survey, 2018 URL: https://www.apa.org/news/press/releases/stress/2018/stress-gen-z.pdf
- [7] Joseph Bafumi and Robert Y. Shapiro “A New Partisan Voter” In The Journal of Politics 71.1, 2009, pp. 1–24 DOI: 10.1017/S0022381608090014
- [8] Asaf Beasley and Winter Mason “Emotional States vs. Emotional Words in Social Media” In Proceedings of the ACM Web Science Conference, WebSci’15 Association for Computing Machinery, 2015 DOI: 10.1145/2786451.2786473
- [9] Deborah J. Brooks and John G. Geer “Beyond Negativity: The Effects of Incivility on the Electorate” In American Journal of Political Science 51.1 Midwest Political Science Association, Wiley, 2007, pp. 1–16 URL: http://www.jstor.org/stable/4122902
- [10] Maureen B. Costello “The Trump Effect: The Impact of the Presidential Campaign on Our Nation’s Schools” In Southern Poverty Law Center Report 17, 2016 URL: https://www.splcenter.org/sites/default/files/splc_the_trump_effect.pdf
- [11] Christian S. Crandall, Jason M. Miller and Mark H. White “Changing norms following the 2016 US presidential election: The Trump effect on prejudice” In Social Psychological and Personality Science 9.2, 2018, pp. 186–192 DOI: 10.1177/1948550617750735
- [12] Jacob Devlin, Ming-Wei Chang, Kenton Lee and Kristina Toutanova “BERT: Pre-training of Deep Bidirectional Transformers for Language Understanding” In Proceedings of the 2019 Conference of the North American Chapter of the Association for Computational Linguistics: Human Language Technologies, NAACL-HLT’19, 2019, pp. 4171–4186 DOI: 10.18653/v1/n19-1423
- [13] Peter S. Dodds et al. “Human Language Reveals a Universal Positivity Bias” In Proceedings of the National Academy of Sciences 112.8, 2015, pp. 2389–2394 DOI: 10.1073/pnas.1411678112
- [14] Peter S. Dodds et al. “Computational Timeline Reconstruction of the Stories Surrounding Trump: Story Turbulence, Narrative Control, and Collective Chronopathy” In PLOS ONE 16.12, 2021, pp. 1–17 DOI: 10.1371/journal.pone.0260592
- [15] James N. Druckman et al. “Affective Polarization, Local Contexts and Public Opinion in America” In Nature Human Behaviour 5, pp. 28–38 DOI: 10.1038/s41562-020-01012-5
- [16] Patricia L. Dunmire “Political Discourse Analysis: Exploring the Language of Politics and the Politics of Language” In Language and Linguistics Compass 6.11, 2012, pp. 735–751 DOI: 10.1002/lnc3.365
- [17] Michael Farrelly “Critical Discourse Analysis in Political Studies: An Illustrative Analysis of the ‘Empowerment’ Agenda” In Politics 30.2, 2010, pp. 98–104 DOI: 10.1111/j.1467-9256.2010.01372.x
- [18] Ethan Fast, Binbin Chen and Michael S. Bernstein “Empath: Understanding Topic Signals in Large-Scale Text” In Proceedings of the 2016 CHI Conference on Human Factors in Computing Systems, CHI’16, 2016, pp. 4647–4657 DOI: 10.1145/2858036.2858535
- [19] Richard Forgette and Jonathan S. Morris “High-Conflict Television News and Public Opinion” In Political Research Quarterly 59.3 University of Utah, Sage Publications, Inc., 2006, pp. 447–456 URL: http://www.jstor.org/stable/4148045
- [20] Jeremy A. Frimer et al. “A Decline in Prosocial Language Helps Explain Public Disapproval of the US Congress” In Proceedings of the National Academy of Sciences 112.21 National Academy of Sciences, 2015, pp. 6591–6594 DOI: 10.1073/pnas.1500355112
- [21] Jeremy A. Frimer et al. “Incivility is rising among American politicians on Twitter” In Social Psychological and Personality Science SAGE Publications Sage CA: Los Angeles, CA, 2022 DOI: 10.1177/19485506221083811
- [22] Jeremy A. Frimer, Mark J. Brandt, Zachary Melton and Matt Motyl “Extremists on the Left and Right Use Angry, Negative Language” In Personality and Social Psychology Bulletin 45.8, 2019, pp. 1216–1231 DOI: 10.1177/0146167218809705
- [23] John Fritze and David Jackson “From the Border to the Federal Bench to Raging Political Divisions: How Donald Trump’s Tenure Has Changed America” In USA Today, 2021 URL: https://eu.usatoday.com/story/news/politics/2021/01/18/heres-how-trumps-tumultuous-four-years-president-changed-america/4165708001/
- [24] Matthew Gentzkow and Jesse M. Shapiro “What Drives Media Slant? Evidence from US Daily Newspapers” In Econometrica 78.1 Wiley Online Library, 2010, pp. 35–71 DOI: 10.3982/ECTA7195
- [25] Matthew Gentzkow, Jesse M. Shapiro and Matt Taddy “Measuring Group Differences in High-Dimensional Choices: Method and Application to Congressional Speech” In Econometrica 87.4, 2019, pp. 1307–1340 DOI: 10.3982/ECTA16566
- [26] Jacques Gerstlé and Alessandro Nai “Negativity, Emotionality and Populist Rhetoric in Election Campaigns Worldwide, and Their Effects on Media Attention and Electoral Success” In European Journal of Communication 34.4, 2019, pp. 410–444 DOI: 10.1177/0267323119861875
- [27] Maria E. Grabe and Rasha Kamhawi “Hard Wired for Negative News? Gender Differences in Processing Broadcast News” In Communication Research 33.5, 2006, pp. 346–369 DOI: 10.1177/0093650206291479
- [28] Catherine Hausman and David S. Rapson “Regression Discontinuity in Time: Considerations for Empirical Applications” In Annual Review of Resource Economics 10.1, 2018, pp. 533–552 DOI: 10.1146/annurev-resource-121517-033306
- [29] Encarnación Hidalgo Tenorio “‘I Want to Be a Prime Minister’, or What Linguistic Choice Can Do for Campaigning Politicians” In Language and Literature 11.3, 2002, pp. 243–261 DOI: 10.1177/096394700201100304
- [30] Shanto Iyengar et al. “The Origins and Consequences of Affective Polarization in the United States” In Annual Review of Political Science 22.1, 2019, pp. 129–146 DOI: 10.1146/annurev-polisci-051117-073034
- [31] Shanto Iyengar, Gaurav Sood and Yphtach Lelkes “Affect, Not Ideology: A Social Identity Perspective on Polarization” In Public Opinion Quarterly 76.3, 2012, pp. 405–431 DOI: 10.1093/poq/nfs038
- [32] Toby S. James “The Effects of Donald Trump” In Policy Studies 42.5-6 Taylor & Francis, 2021, pp. 755–769 DOI: 10.1080/01442872.2021.1980114
- [33] Kayla N. Jordan, Joanna Sterling, James W. Pennebaker and Ryan L. Boyd “Examining Long-Term Trends in Politics and Culture Through Language of Political Leaders and Cultural Institutions” In Proceedings of the National Academy of Sciences 116.9 National Academy of Sciences, 2019, pp. 3476–3481 DOI: 10.1073/pnas.1811987116
- [34] Jeffrey H. Kahn, Renée M. Tobin, Audra E. Massey and Jennifer A. Anderson “Measuring Emotional Expression with the Linguistic Inquiry and Word Count” In The American Journal of Psychology 120.2, 2007, pp. 263–286 DOI: doi.org/10.2307/20445398
- [35] Sara E.. Kangas “What Can Software Tell Us About Political Candidates?: A Critical Analysis of a Computerized Method for Political Discourse” In Journal of Language and Politics 13.1, 2014, pp. 77–97 DOI: https://doi.org/10.1075/jlp.13.1.04kan
- [36] Ramona Kreis “The “Tweet Politics” of President Trump” In Journal of Language and Politics 16.4, 2017, pp. 607–618 DOI: 10.1075/jlp.17032.kre
- [37] David Lazer et al. “Meaningful Measures of Human Society in the Twenty-first Century” In Nature 595.7866, 2021, pp. 189–196 DOI: 10.1038/s41586-021-03660-7
- [38] Stephan Lewandowsky, Michael Jetter and Ullrich K.. Ecker “Using the President’s Tweets to Understand Political Diversion in the Age of Social Media” In Nature Communications 11.1 Nature Publishing Group, 2020, pp. 1–12 DOI: 10.1038/s41467-020-19644-6
- [39] Burt L. Monroe et al. “No! Formal Theory, Causal Inference, and Big Data Are Not Contradictory Trends in Political Science” In PS: Political Science & Politics 48.1 Cambridge University Press, 2015, pp. 71–74 DOI: 10.1017/S1049096514001760
- [40] Diana C. Mutz and Byron Reeves “The New Videomalaise: Effects of Televised Incivility on Political Trust” In American Political Science Review 99.1, 2005, pp. 1–15 DOI: 10.1017/S0003055405051452
- [41] Vlad Niculae et al. “Quotus: The structure of political media coverage as revealed by quoting patterns” In Proceedings of the 24th International Conference on World Wide Web, WWW’15, 2015, pp. 798–808 DOI: 10.1145/2736277.2741688
- [42] “NOW: News on the Web Corpus [Data set]” URL: https://www.english-corpora.org/now/
- [43] Thomas E. Patterson “News Coverage of Donald Trump’s First 100 Days” In HKS Working Papers, 2017 DOI: 10.2139/ssrn.3040911
- [44] James W. Pennebaker, Roger J. Booth and Martha E. Francis “Operator’s Manual Linguistic Inquiry and Word Count: LIWC2007”, 2007 The University of Texas at AustinThe University of Auckland, New Zealand
- [45] James W. Pennebaker and Anna Graybeal “Patterns of Natural Language Use: Disclosure, Personality, and Social Integration” In Current Directions in Psychological Science 10.3 Association for Psychological Science, Sage Publications, Inc., 2001, pp. 90–93 URL: http://www.jstor.org/stable/20182707
- [46] Pew Research Center “Public Highly Critical of State of Political Discourse in the U.S.”, 2019 URL: https://www.pewresearch.org/politics/wp-content/uploads/sites/4/2019/06/PP_2019.06.19_Political-Discourse_FINAL.pdf
- [47] Kari De Pryck and François Gemenne “The Denier-in-Chief: Climate Change, Science and the Election of Donald J. Trump” In Law and Critique 28, 2017, pp. 119–126 DOI: 10.1007/s10978-017-9207-6
- [48] Riccardo Puglisi and James M. Jr. “Newspaper Coverage of Political Scandals” In The Journal of Politics 73.3 Cambridge University Press New York, USA, 2011, pp. 931–950 DOI: 10.1017/s0022381611000569
- [49] Adam J. Schiffer “Assessing Partisan Bias in Political News: The Case(s) of Local Senate Election Coverage” In Political Communication 23.1 Taylor & Francis, 2006, pp. 23–39 DOI: 10.1080/10584600500476981
- [50] Michele Settanni and Davide Marengo “Sharing Feelings Online: Studying Emotional Well-Being via Automated Text Analysis of Facebook Posts” In Frontiers in Psychology 6, 2015, pp. 1045 DOI: 10.3389/fpsyg.2015.01045
- [51] Kevin B. Smith, Matthew V. Hibbing and John R. Hibbing “Friends, relatives, sanity, and health: The costs of politics” In PLOS ONE 14.9, 2019, pp. 1–13 DOI: 10.1371/journal.pone.0221870
- [52] Spinn3r “Documentation” https://web.archive.org/web/20170105130816/https:/www.spinn3r.com/documentation/, Website, 2017
- [53] Felix J. Thoemmes and Lucian G. Conway III “Integrative Complexity of 41 U.S. Presidents” In Political Psychology 28.2, 2007, pp. 193–226 DOI: 10.1111/j.1467-9221.2007.00562.x
- [54] Danielle M. Thomsen “Ideological Moderates Won’t Run: How Party Fit Matters for Partisan Polarization in Congress” In The Journal of Politics 76.3, 2014, pp. 786–797 DOI: 10.1017/s0022381614000243
- [55] Andranik Tumasjan, Timm O. Sprenger, Philipp G. Sandner and Isabell M. Welpe “Predicting Elections with Twitter: What 140 Characters Reveal About Political Sentiment” In Proceedings of the International AAAI Conference on Web and Social Media, ICWSM’10, 2010, pp. 178–185 URL: https://ojs.aaai.org/index.php/ICWSM/article/view/14009
- [56] Timoté Vaucher, Andreas Spitz, Michele Catasta and Robert West “Quotebank: A Corpus of Quotations from a Decade of News” In Proceedings of the 14th ACM International Conference on Web Search and Data Mining, WSDM’21, 2021, pp. 328–336 DOI: 10.1145/3437963.3441760
- [57] Timoté Vaucher, Andreas Spitz, Michele Catasta and Robert West “Quotebank: A Corpus of Quotations from a Decade of News [Data set]. Zenodo” Zenodo, 2021 DOI: 10.5281/zenodo.4277311
- [58] Denny Vrandecic and Markus Krötzsch “Wikidata: A Free Collaborative Knowledgebase” In Communications of the ACM 57.10, 2014, pp. 78–85 DOI: 10.1145/2629489
- [59] Isaac Waller and Ashton Anderson “Quantifying Social Organization and Political Polarization in Online Platforms” In Nature 600, 2021, pp. 264–268 DOI: 10.1038/s41586-021-04167-x
- [60] Robert West, Jure Leskovec and Christopher Potts “Postmortem Memory of Public Figures in News and Social Media” In Proceedings of the National Academy of Sciences 118.38 National Acad Sciences, 2021 DOI: 10.1073/pnas.2106152118
- [61] Sam Whitt et al. “Tribalism in America: Behavioral Experiments on Affective Polarization in the Trump Era” In Journal of Experimental Political Science, 2020, pp. 1–13 DOI: 10.1017/XPS.2020.29
- [62] Sean P. Wojcik et al. “Conservatives Report, but Liberals Display, Greater Happiness” In Science 347.6227, 2015, pp. 1243–1246 DOI: 10.1126/science.1260817
- [63] Tongtao Zheng “Characteristics of Australian Political Language Rhetoric: Tactics of Gaining Support and Shirking Responsibility” In Journal of Intercultural Communication 4, 2000, pp. 1–3 URL: http://mail.immi.se/intercultural/nr4/zheng.htm
See pages - of SI.pdf