Conservation of the Particle-Hole Symmetry in the Pseudogap State in Optimally-Doped Superconductor
The pseudogap state is one of the most enigmatic characteristics in the anomalous normal state properties of the high temperature cuprate superconductors. A central issue is to reveal whether there is a symmetry breaking and which symmetries are broken across the pseudogap transition. By performing high resolution laser-based angle-resolved photoemission measurements on the optimally-doped Bi2Sr1.6La0.4CuO6+δ superconductor, we report the observations of the particle-hole symmetry conservation in both the superconducting state and the pseudogap state along the entire Fermi surface. These results provide key insights in understanding the nature of the pseudogap and its relation with high temperature superconductivity.
High temperature cuprate superconductors exhibit a number of anomalous properties in the normal state. One prominent anomaly is the observation of the pseudogap that opens above the superconducting transition temperature but below the characteristic temperature that is usually defined as a pseudogap temperatureBStatt1999TTimusk ; AKapitulnik1996AGLoeser ; JGiapintzakis1996HDing . Revealing the nature of the pseudogap and its relation with superconductivity have been central issues in understanding the mechanism of high temperature superconductivity. It remains under debate whether the pseudogap is associated with the pre-formed pairingSAKivelson1995VJEmery or some competing ordersJRSchrieffer1990AKampf ; CNayak2001SChakravarty ; DHLee2006JXLi ; ZXShen2010MHashimoto ; ZXShen2011RHHe ; PALee2014PALee ; ZXShen2019SDChen . Since the pre-formed pairing usually displays particle-hole symmetry while the competing orders may not, the examination of the particle-hole symmetry is crucial to understanding the nature of the pseudogap. In the underdoped (Bi2212) superconductor, it is reported from the angle-resolved photoemission (ARPES) measurements that, in the pseudogap state, the particle-hole symmetry breaks near the nodal region but is conserved near the antinodal regionGDGu2008HBYang . In the optimally-doped (Bi2201) superconductor, dramatic electronic structure change is observed across and over a wide momentum space, suggesting a phase transition across and the breaking of the particle-hole symmetry and the spatial symmetry in the pseudogap stateZXShen2010MHashimoto ; ZXShen2011RHHe . These unusual phenomena are interpreted in terms of the pair density wave formation in cuprate superconductorsPALee2014PALee . Considering the importance of the particle-hole symmetry in understanding the nature of the pseudogap, it is crucial to establish whether the observed phenomena in Bi2212GDGu2008HBYang and Bi2201ZXShen2010MHashimoto ; ZXShen2011RHHe are intrinsic and universal in the pseudogap state of the cuprate superconductors.
In this paper, we report the observations of the particle-hole symmetry conservation in both the superconducting state and the pseudogap state by performing high resolution laser-based ARPES measurements on the optimally-doped Bi2Sr1.6La0.4CuO6+δ (La-Bi2201) superconductor. The Fermi surface topology and the band structures exhibit little change with temperature across the pseudogap temperature . The particle-hole symmetry is observed along the entire Fermi surface both in the pseudogap state and in the superconducting state. These results provide key insights in understanding the nature of the pseudogap and its relation with high temperature superconductivity.
The ARPES measurements were performed by using our lab-based laser ARPES system equipped with the 10.897 eV vacuum-ultra-violet (VUV) laser and a angle-resolved time-of-flight electron energy analyzer (ARToF) which can simultaneously detect the two-dimensional momentum spaceXJZhou2008GDLiu ; WTZhang2018XJZhou . The energy resolution was set at 1 meV and the angular resolution is 0.1 ∘, corresponding to a momentum resolution of 0.0023 Å-1 at the photon energy of 10.897 eV. High quality single crystals of the optimally-doped La-Bi2201 were grown by the traveling solvent floating zone method. The samples were post annealed in the flowing oxygen to adjust the hole concentration and make the samples uniformXJZhou2009JQMeng2 . For convenience, we use Opt32K to represent the optimally-doped Bi2201 sample with a of 32 K. The pseudogap temperature is 150 K as determined from ARPES and NMR measurementsCTLin2005GQZheng ; VMadhavan2008JHMa . The sample was cleaved at 20 K and measured in vacuum with a base pressure better than 510-11 Torr. The Fermi level is referenced by measuring on a clean polycrystalline gold that is electrically connected to the sample and also by the ARPES data along the nodal direction which are known to have zero superconducting gap.
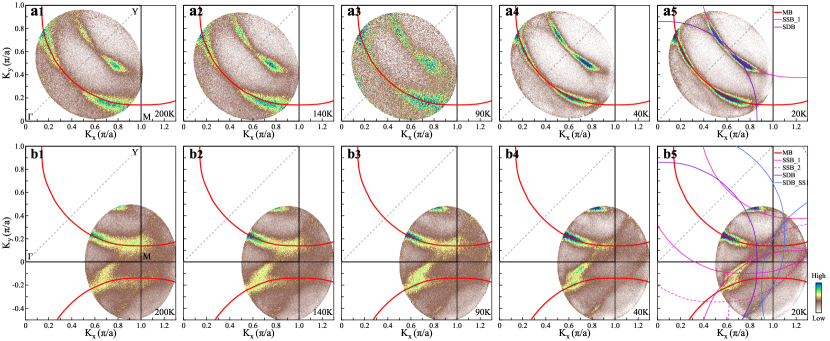
Figure 1 shows the Fermi surface mappings of the Opt32K Bi2201 sample measured at different temperatures across both the superconducting transition temperature of 32 K and the pseudogap temperature of 150 K. It consists of two separate measurements: one is centered around the nodal region (Fig. 1a1-1a5) and the other is centered around the antinodal (,0) region (Fig. 1b1-1b5). Each Fermi surface mapping is obtained by using our ARToF analyzer which can simultaneously cover two-dimensional momentum space with high energy and momentum resolutions. The entire Fermi surface of Bi2201 is measured by combining the nodal and antinodal Fermi surface mappings in Fig. 1a1-1a5 and Fig. 1b1-1b5. It is well-known that, in Bi-based cuprate superconductors, the structural modulations along the - direction give rise to superstructure bands, i.e., extra replica bands that are formed by shifting the original Fermi surface by , where is the vector of the structural modulation and is the order of the superstructure bandsKKadowaki1994PAebi ; GJennings1995HDing ; KKadowaki1995JOsterwalder ; XJZhou2019SJLiu ; XJZhou2020QGao . In addition, there are also shadow bands and the superstructure bands of the shadow bandsKKadowaki1994PAebi ; GJennings1995HDing ; KKadowaki1995JOsterwalder . As depicted in Fig. 1a5 and Fig. 1b5, all the observed Fermi surface sheets can be well assigned to the main Fermi surface (MB, thick red line), the first-order superstructure bands of the main Fermi surface (SSB1, solid pink line), the second-order superstructure bands of the main Fermi surface (SSB2, dashed pink line), the shadow band of the main Fermi surface (SDB, purple line) and the first-order superstructure bands of the SDB shadow band (SDBSS1, blue line). The main Fermi surface stands out clearly in all the measurements (thick red lines in Fig. 1) although it is complicated by other Fermi surface sheets, particularly near the antinodal region. The main Fermi surface exhibits little change with temperature over the whole temperature range of 20200 K, as seen in Fig. 1 where the same thick red lines agree well with the observed main Fermi surface at different temperatures.
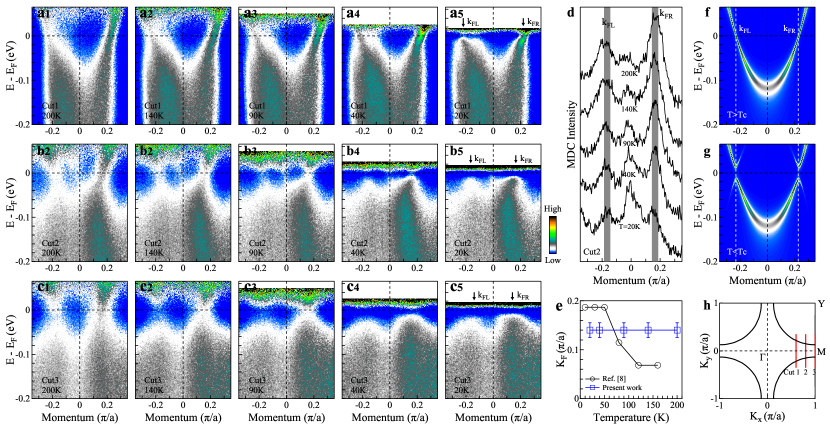
Figure 2 shows the temperature dependence of the band structures in the Opt32K Bi2201 sample measured along three typical momentum cuts near the antinodal region. In order to directly visualize the gap opening and the particle-hole symmetry, the presented band structures in Fig. 2a1-2c5 are obtained by dividing the original data with the corresponding Fermi-Dirac distribution functions to show the electronic states above the Fermi level. The corresponding photoemission spectra (energy distribution curves, EDCs) are presented in Fig. 3. To better understand the data, we simulated the single-particle spectral function of a conventional BCS superconductor in the normal state (Fig. 2f) and in the superconducting state (Fig. 2g). In this case, the particle-hole symmetry is conserved which can be judged from two aspects. The first is that the Fermi momentum keeps fixed in the normal and superconducting state. The second is that the single-particle spectral function satisfies = at the Fermi momentum . The gap opening corresponds to the spectral weight suppression at the Fermi level.
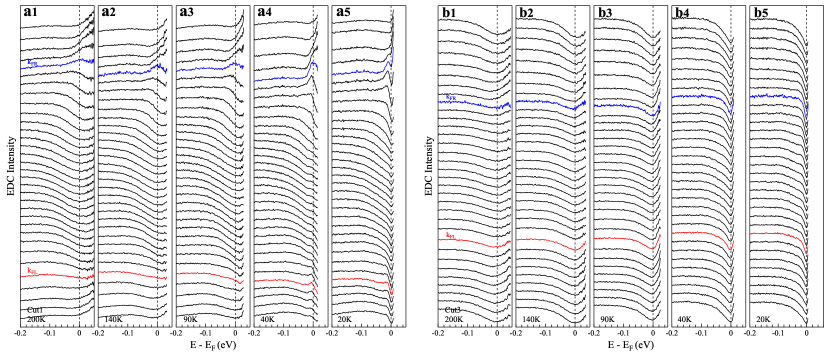
We find that the particle-hole symmetry is conserved in both the pseudogap state and the superconducting state near the antinodal region as seen in Fig. 2 and Fig. 3. First, the Fermi momentum shows little change upon crossing the pseudogap transition and the superconducting transition. Fig. 2d shows the momentum distribution curves (MDCs) at the Fermi level obtained from the band structures measured along the momentum cut 2 at different temperatures (Fig. 2b1-2b5). No obvious change of the two Fermi momenta ( and ) is observed in the measured temperature range of 20200 K. The same is true for the Fermi momentum from the antinodal cut 3 that is plotted in Fig. 2e. These are consistent with the fixed Fermi surface observed at different temperatures in Fig. 1. Second, as the temperature decreases from 200 K, the pseudogap opening between and and the superconducting gap opening below can be directly visualized from the spectral weight suppression at the Fermi level in the measured band structures shown in Fig. 2a1-2c5. One can also see from these band structures that, when either the pseudogap or the superconducting gap opens, the spectral function at the Fermi momentum is nearly symmetric with respect to the Fermi level. These can be directly observed from EDCs at the Fermi momentum shown in Fig. 3 (blue and red curves) which are nearly symmetric with respect to the Fermi level.
Our measured results of the optimally-doped La-Bi2201 near the antinodal region shown in Fig. 1-Fig. 3 are rather different from the previous reports on the optimally-doped ZXShen2010MHashimoto ; ZXShen2011RHHe . In that case, dramatic electronic structure changes are observed both across and across near the antinodal region. The Fermi momentum and the corresponding Fermi surface exhibit an obvious change across the pseudogap transition indicating the breaking of the particle-hole symmetry (also plotted in Fig. 2e for comparison)ZXShen2010MHashimoto ; ZXShen2011RHHe . A complex structure with two energy scales below the Fermi level develops below in the superconducting state which can not be derived by the BCS formula from the band structure in the normal state above . In our case, except for the narrow energy range near the Fermi level which is sensitive to the gap opening, most of the band structures do not show obvious change with temperature in the entire range of 20200 K, as seen in Fig. 2. The Fermi momentum and the corresponding Fermi surface do not change across and the particle-hole symmetry is observed in the pseudogap state. In the superconducting state, we do not observe the complex electronic structures reported beforeZXShen2011RHHe and the electronic structures in the superconducting state can be well connected to the normal state by the BCS picture. The origin of the big difference between our results and the previous measurementsZXShen2010MHashimoto ; ZXShen2011RHHe needs to be further investigated. We note that, in the optimally-doped Bi2212 superconductor, no obvious electronic structure changes are observed across and and the particle-hole symmetry is conserved in the pseudogap state and the superconducting stateXJZhou2018XSun . These observations are consistent with our present results on Bi2201. They indicate that the particle-hole symmetry breaking across reported beforeZXShen2010MHashimoto ; ZXShen2011RHHe is not universal in high temperature cuprate superconductors.
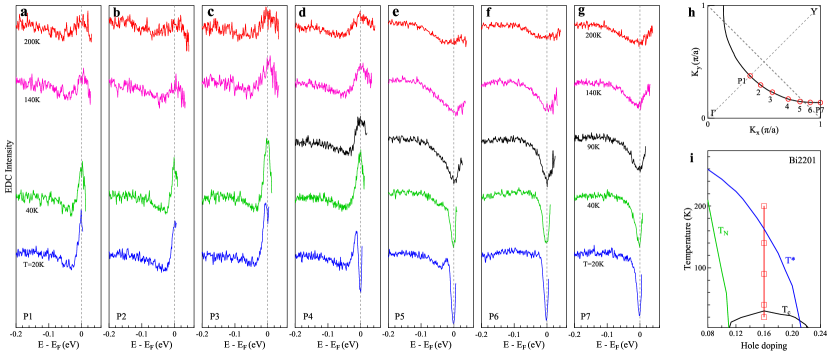
Now we come to examine the momentum dependence of the particle-hole symmetry along the Fermi surface. In the underdoped Bi2212, it is reported that, in the pseudogap state, the particle-hole symmetry is conserved near the antinodal region but breaks near the nodal regionGDGu2008HBYang . To this end, we show EDCs along the whole Fermi surface measured at different temperatures in Fig. 4. We find that, when the pseudogap develops between and , or the superconducting gap opens below , all the EDCs along the Fermi surface are nearly symmetric with respect to the Fermi level. These results indicate that the particle-hole symmetry is conserved along the entire Fermi surface both in the pseudogap state and in the superconducting state.
In summary, by taking high-resolution laser-based ARPES measurements on the optimally-doped Bi2201, we have observed the particle-hole symmetry conservation across the pseudogap transition along the entire Fermi surface. These results provide key information to understand the nature of the pseudogap and its relation with high temperature superconductivity in cuprate superconductors.
References
- (1) Timusk T and Statt B 1999 Rep. Prog. Phys. 61
- (2) Loeser A G, Shen Z X, Dessau D S, Marshall D S, Park C H, Fournier P and Kapitulnik A 1996 Science 325
- (3) Ding H, Yokoya T, Campuzano J C, Takahashi T, Randeria M, Norman M R, Mochiku T, Kadowaki K and Giapintzakis J 1996 Nature 51
- (4) Emery V J and Kivelson S A 1995 Nature 434
- (5) Kampf A and Schrieffer J R 1990 Phys. Rev. B 6399
- (6) Chakravarty S, Laughlin R B, Morr D K and Nayak C 2001 Phys. Rev. B 094503
- (7) Li J X, Wu C Q and Lee D H 2006 Phys. Rev. B 184515
- (8) Hashimoto M, He R H, Tanaka K, Testaud J P, Meevasana W, Moore R G, Lu D H, Yao H, Yoshida Y, Eisaki H, Devereaux T P, Hussain Z and Shen Z X 2010 Nat. Phys. 414
- (9) He R H, Hashimoto M, Karapetyan H, Koralek J D, Hinton J P, Testaud J P, Nathan V, Yoshida Y, Yao H, Tanaka K, Meevasana W, Moore R G, Lu D H, Mo S K, Ishikado M, Eisaki H, Hussain Z, Devereaux T P, Kivelson S A, Orenstein J, Kapitulnik A and Shen Z X 2011 Science 1579
- (10) Lee P A 2014 Phys. Rev. X 031017
- (11) Chen S D, Hashimoto M, He Y, Song D, Xu K J, He J F, Devereaux T P, Eisaki H, Lu D H, Zaanen J and Shen Z X 2019 Science 1099
- (12) Yang H B, Rameau J D, Johnson P D, Valla T, Tsvelik A and Gu G D 2008 Nature 77
- (13) Liu G D, Wang G L, Zhu Y, Zhang H B, Zhang G C, Wang X Y, Zhou Y, Zhang W T, Liu H Y, Zhao L, Meng J Q, Dong X L, Chen C T, Xu Z Y and Zhou X J 2008 Rev. Sci. Instrum. 023105
- (14) Zhou X J, He S L, Liu G D, Zhao L, Yu L and Zhang W T 2018 Rep. Prog. Phys. 062101
- (15) Meng J Q, Liu G D, Zhang W T, Zhao L, Liu H Y, Lu W, Dong X L and Zhou X J 2009 Supercond. Sci. Tech. 045010
- (16) Zheng G Q, Kuhns P L, Reyes A P, Liang B and Lin C T 2005 Phys. Rev. Lett. 047006
- (17) Ma J H, Pan Z H, Niestemski F C, Neupane M, Xu Y M, Richard P, Nakayama K, Sato T, Takahashi T, Luo H Q, Fang L, Wen H H, Wang Z Q, Ding H and Madhavan V 2008 Phys. Rev. Lett. 207002
- (18) Aebi P, Osterwalder J, Schwaller P, Schlapbach L, Shimoda M, Mochiku T and Kadowaki K. 1994 Phys. Rev. Lett. 2757
- (19) Ding H, Campuzano J C, Bellman A F, Yokoya T, Norman M R, Randeria M, Takahashi T, Yoshida H K, Mochiku T, Kadowaki K and Jennings G 1995 Phys. Rev. Lett. 2784
- (20) Osterwalder J, Aebi P, Schwaller P, Schlapbach L, Shimoda M, Mochiku T and Kadowaki K 1995 Appl. Phys. A 247
- (21) Liu J, Zhao L, Gao Q, Ai P, Zhang L, Xie T, Huang J W, Ding Y, Hu C, Yan H T, Song C Y, Xu Y, Li C, Cai Y Q, Rong H T, Wu D S, Liu G D, Wang Q Y, Huang Y, Zhang F F, Yang F, Peng Q J, Li S L, Yang H X, Li J Q, Xu Z Y and Zhou X J 2019 Chin. Phys. B 077403
- (22) Gao Q, Yan H T, Liu J, Ai P, Cai Y Q, Li C, Luo X Y, Hu C, Song C Y, Huang J W, Rong H T, Huang Y, Wang Q Y, Liu G D, Gu G D, Zhang F F, Yang F, Zhang S J, Peng Q J, Xu Z Y, Zhao L, Xiang T and Zhou X J 2020 Phys. Rev. B 014513
- (23) Sun X, Zhang W T, Zhao L, Liu G D, Gu G D, Peng Q J, Wang Z M, Zhang S J, Yang F, Chen C T, Xu Z Y and Zhou X J 2018 Chin. Phys. Lett. 017401
- (24) Bardeen J, Cooper L N and Schrieffer J R 1957 Phys. Rev. 1175
Acknowledgement This work is supported by the National Natural Science Foundation of China (Grant Nos. 11888101, 11922414 and 11974404), the National Key Research and Development Program of China (Grant Nos. 2021YFA1401800, 2017YFA0302900, 2018YFA0305602 and 2018YFA0704200), the Strategic Priority Research Program (B) of the Chinese Academy of Sciences (Grant No. XDB25000000 and XDB33000000), the Youth Innovation Promotion Association of CAS (Grant No. 2021006), the Synergetic Extreme Condition User Facility (SECUF) and the Research Program of Beijing Academy of Quantum Information Sciences (Grant No. Y18G06).
Author Contributions
X.J.Z. and H.T.Y. proposed and designed the research. H.T.Y. carried out the ARPES experiments. H.T.Y. grew the single crystals. H.T.Y., Q.G., C.Y.S., C.H.Y., Y.W.C., F.F.Z., F.Y., S.J.Z., Q.J.P., G.D.L., L.Z., Z.Y.X. and X.J.Z. contributed to the development and maintenance of Laser-ARPES systems. H.T.Y and X.J.Z. analyzed the data and wrote the paper. All authors participated in discussions and comments on the paper.
Additional information
Competing financial interests: The authors declare no competing financial interests.