Towards Realistic Statistical Channel Models For Positioning: Evaluating the Impact of Early Clusters
Abstract
Physical effects such as reflection or diffraction cause a radio signal to travel from a transmitter to a receiver in multiple replicas of different amplitude and rotation. Early clusters define replicas from objects in the immediate vicinity of a transmitter or a receiver, which influence the lobe of the Line-Of-Sight (LOS). For positioning in particular, the replica, which arrives with a delay bordering that of the LOS path highly impacts the performance evaluation and must not be overlooked in the channel model considerations.
In this paper, we show that the existing channel model specified for performance evaluation within 3GPP does not cover the above phenomena with sufficient accuracy and simulation results deviate significantly from the measured values. As an extension to overcome this shortcoming, we propose model early clusters to simulate measured effects with sufficient accuracy and ensure that it channel model reflects typical effects in real scenarios.
Index Terms:
positioning, channel model, 5G, OLOS, spatial consistencyI Introduction
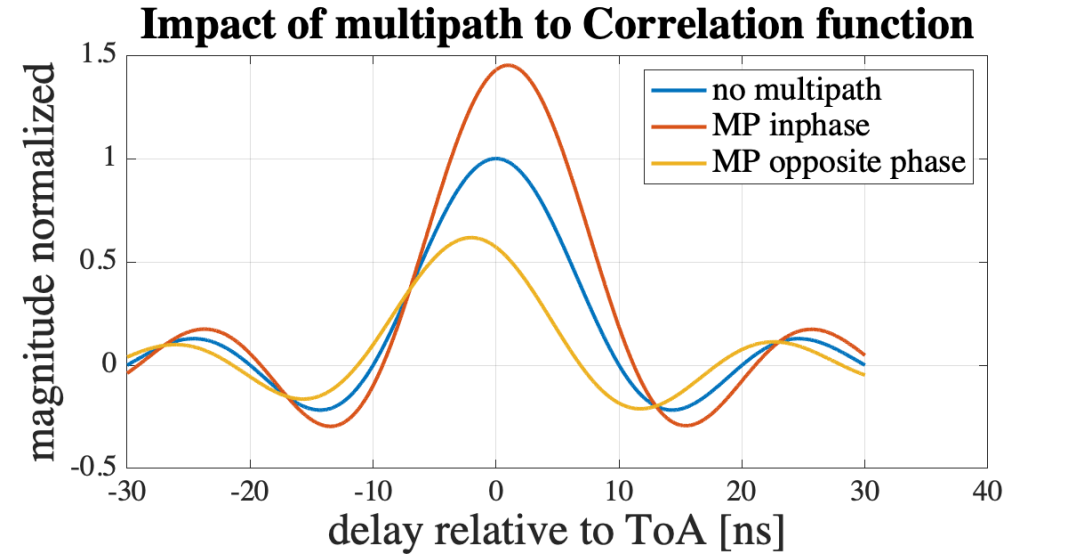
Signals traversing a multipath channel consist of multiple replicas of the original signal that have been attenuated and phase rotated. The channel impulse response (CIR) can be estimated by correlating the received signal with the transmitted sequence. In the case of signals with limited bandwidth, the correlation paths related to the LOS and different multipath components (MPC) may overlap (constructively or destructively) and it is unlikely to separate them. As a result, the correlation peak deviates from its true value, see Fig. 1. The deviation corresponds to the geometric distance of the LOS between the transmitter and the receiver and introduces errors in time-of-arrival (ToA) estimates, and thus degrades position accuracy. Depending on the signal bandwidth and the target accuracy requirements, it may be not necessary to consider paths arriving with similar delay. But for high accuracy ToA estimation or for limited bandwidth, realiable ToA estimation algorithms must be able to detect the ToA of the first arriving path even if the related correlation peak is impaired by other multipath components. Moreover, 3GPP has gradually increased the requirements of the 3GPP-NR standard w.r.t. accuracy, latency and reliability. In particular, the support of service classes 5 or 6 [1, 2] require an accuracy of less than 30 (ToA error of 1 ). Reflections from objects close to the receiver or transmitter may have a delay of a few or even lower. Typical examples are the ground reflection or object close to the mounting point of the antennas.
To evaluate positioning performance, [3] and [4] specified several scenarios using geometry based statistical channel models. These channel models are based on measurements and focused on effects relevant for data communication applications. Effects relevant for positioning may be not well covered or the models offer limited flexibility to adjust the related parameters. For communication applications typically CIRs with high delay spread are more critical, whereas the for positioning especially the characteristics of the first arriving paths are essential.
To overcome these issues, we propose methods allowing a better control of the properties of each link. Additional enhancements supporting a better evaluation of machine-learning based algorithms and emulation of ”obstructed LOS” (OLOS) conditions are in the scope of [5]. Accordingly, we consider early (arriving) clusters (EC) and late arriving clusters (LC). We developed a modified TR38.901 model offering a more flexible adjustment of the ratio between the EC and LC. It is the nature of statistical models that EC are generated also randomly. However, to better control the probability and the strength of the EC additional parameters are required. Furthermore, we propose a metric allowing the evaluation of the performance versus channel characteristics. This helps to identify critical channel conditions.
The rest of this paper is structured as follows. Sec. II gives a short introduction to the principle of the TR38.901 model. Sec. III describes our proposed extension of the existing channel model Sec. IV evaluates the effects caused by ECs. Sec. V compares measured CIRs with CIRs generated in simulation with and without the proposed extensions.
II State of the Art
Most research in the field of communications engineering relies on modeling the wireless radio propagation and environment. For comparison of the results of studies performed by different companies, 3GPP defines a standardized channel model in Technical Report TR38.901 [6] including deployment scenarios, channel parameters and characteristics of key components as antennas, for example. The underlying statistical model shall generate propagation conditions representing different usage scenarios. The generated channels shall cover “easy” scenarios as well as critical scenarios with a probability as expected in the given deployment. For positioning algorithms using several base stations and triangulation, for example, the performance may already degrade, if one link provides a low accuracy. For the evaluation of the reliability of a technology very long simulations may be required, ensuring that critical scenarios are well covered, also.
The TR38.901 model splits the CIR in clusters, where each cluster being composed of several subpaths. The models define the statistical properties of the cluster delays, AoA, AoD, etc. and the CIRs are generated randomly according these parameters.
To simulate a specific radio system setup, the geometric layout (position of base stations, etc.) and the environment parameter set (called scenario table) are selected. The scenario tables cover the statistical properties of the channel characteristics defined by parameters like delay spread, angular spread, the Ricean K-factor, and shadow fading. The CIRs itself are generated in a two step approach:
-
•
The large scale model emulates the changes of the propagation conditions and generates the instantaneous values of the delay spread, K-factor, shadow fading, etc. inline with the statistical distributions defined by the scenario tables.
-
•
The small scale model generates the CIRs itself, controlled by the values generated by the large scale model.
The channel model generates the multipath components of the power-delay-profile (PDP) of the CIR composed of clusters by randomly selecting for each cluster the delay by
| (1) |
and the cluster power by
| (2) |
where is the spatially-correlated delay spread generated by the large scale model, is a uniformly-distributed random variable and is a normal-distributed random variable implementing the per cluster shadow term. is a proportionality factor defined by the scenario tables. These equations offer limited flexibility to generate PDP covering effects like reflections from objects close to the transmitter or receiver or other effects relevant for high accuracy ToA estimation. For the evaluation of positioning algorithms, it is essential to pay attention to the characteristics of the components arriving with a low delay—called early (arriving) cluster (EC). With a certain probability the equations (1) and (2) generate also EC. But the probability depends on the number of clusters and the . This means, it is not possible to adjust the parameters related to effects resulting from reflections close to the transmitter and receiver and the overall delay spread independently.
III Extension of the TR38.901 Model
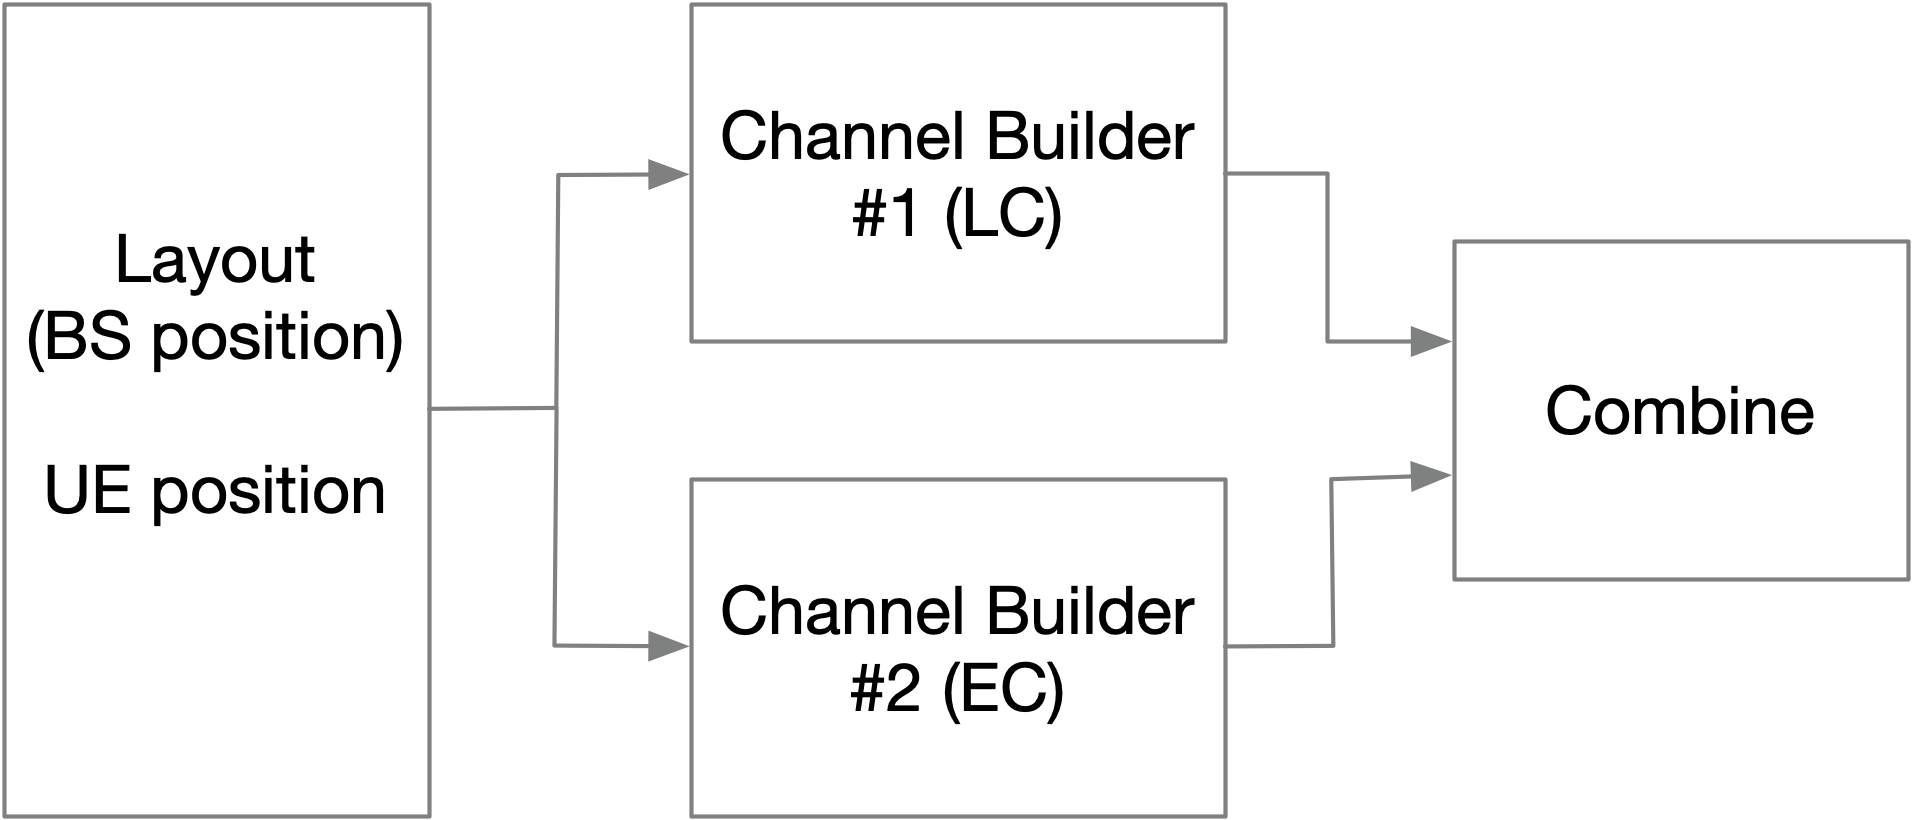
Fig. 2 depicts the principle of the proposed extension of the TR38.901 model. The CIR is generated by combining two CIRs generated by two channel builders as defined by TR38.901. Two sets of clusters are generated using parameter sets focusing on the components with high path delay (LC) and clusters arriving early (EC). The combining includes a normalisation to maintain the overall power according to the pathloss and shadow fading and (optional) other properties like the overall K-factor. The parameter sets for each builder can be set independently. The ratio between the LC and EC can be selected. To demonstrate the effect we selected four configurations (marked with configuration numbers)
-
•
104.20 represents the parameter set “InF LOS” as defined by TR38.901
-
•
104.60 adds the ground reflection according the method as already supported by TR38.901
-
•
104.63 uses two builders. The combiner is set to “maintain overall K-Factor statistics”
-
•
104.66 adds to the 104.63 configuration the ground reflection.
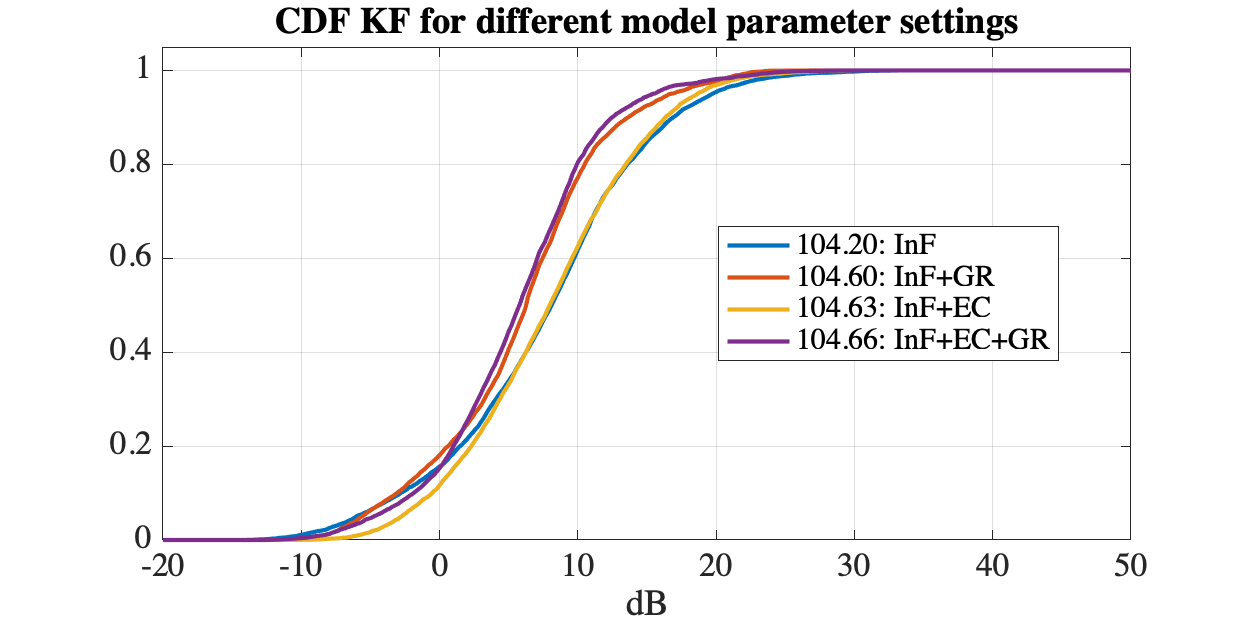
From the K-factor statistic given in Fig. 3 we observe that 104.20 and 104.63 have the same K-factor properties. In addition, ground reflection according TR38.901 may influence the overall K-factor. Along with CIRs with low (less than 0 ) K-factor are generated with a probability of circa 10 percent.
To further evaluate the channel characteristics with respect to the EC we selected a modified K-factor (which we denote as ) as criterion. The considers the signal components arriving within a time window relative to the line-of-sight path. This is given as
| (3) |
where is the set of indices of clusters having a delay less than , i.e., , denotes the power of the LOS component and denotes the power of the th NLOS cluster. The cluster powers are as defined in the 38.901 model [6].
In Fig. 4, we depict the CDFs of the statistics for different channel model parameter settings as given above. For InF LOS, the in 25 percent of the cases no multipath component arrives within a delay of 20ns. This means multipath components with a delay typical for ground reflection and in a radius in the range of 5m no objects reflecting the signal are placed.
Fig. 4 also show that using EC allows to change the while maintaining the overall K-factor.

IV Influence of Early Clusters on ToA Estimation Accuracy
To demonstrate the impact of the EC, we ran simulations of a ToA estimator optimized for detecting the first arriving path of a 5G reference signal. The algorithm is used as an example for a super resolution algorithm and is based on detecting the inflection point of the rising edge of the correlation function which outperforms peak-detection-based methods. Here, SRS according the 5G NR standard was used with a signal bandwidth set to 100 MHz and sampled at 122.88 MHz at the receiver. For each randomly generated channel realization, first, we calculated , cf. (3). For this particular example, we set . To cover a wide range of ) we combined the results of several simulation runs using the four channel model parameter settings as given above. We sorted the ToA estimation errors according the criterion and generated for different ranges separate ToA error CDFs
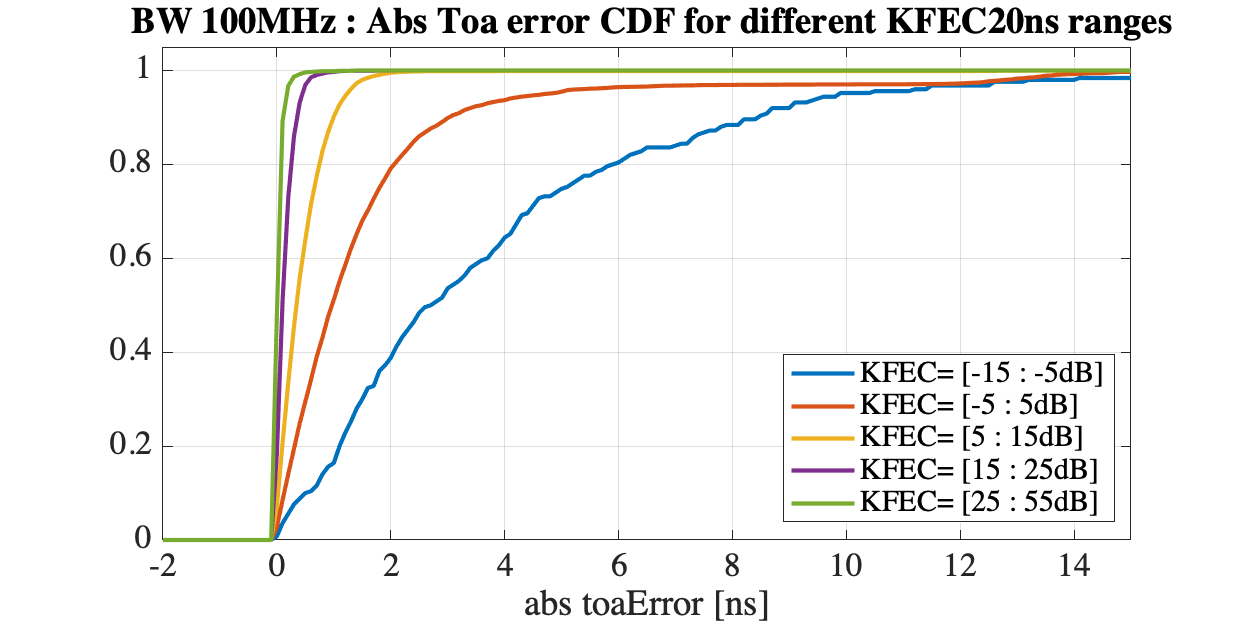
The obtained empirical CDFs are all plotted in Fig. 5. Here, we see that has a high impact on the ToA estimation accuracy. In fact, we have a large variation in the observed error. When is high, any reflecting object must be placed at a distance of at least 3 meters (when behind the transmitter or receiver) to ensure that all multipath component arrived with a delay higher than .
It should be noted that the grouping of the results according the calculated offers two advantages:
-
•
It is possible to identify the scenarios where a higher error can be expected or the method fails.
-
•
The simulation results are less dependent on the overall channel statistics. The overall channel statistics has mainly an impact to the share of channel instances per group.
V Measurement and Evaluation
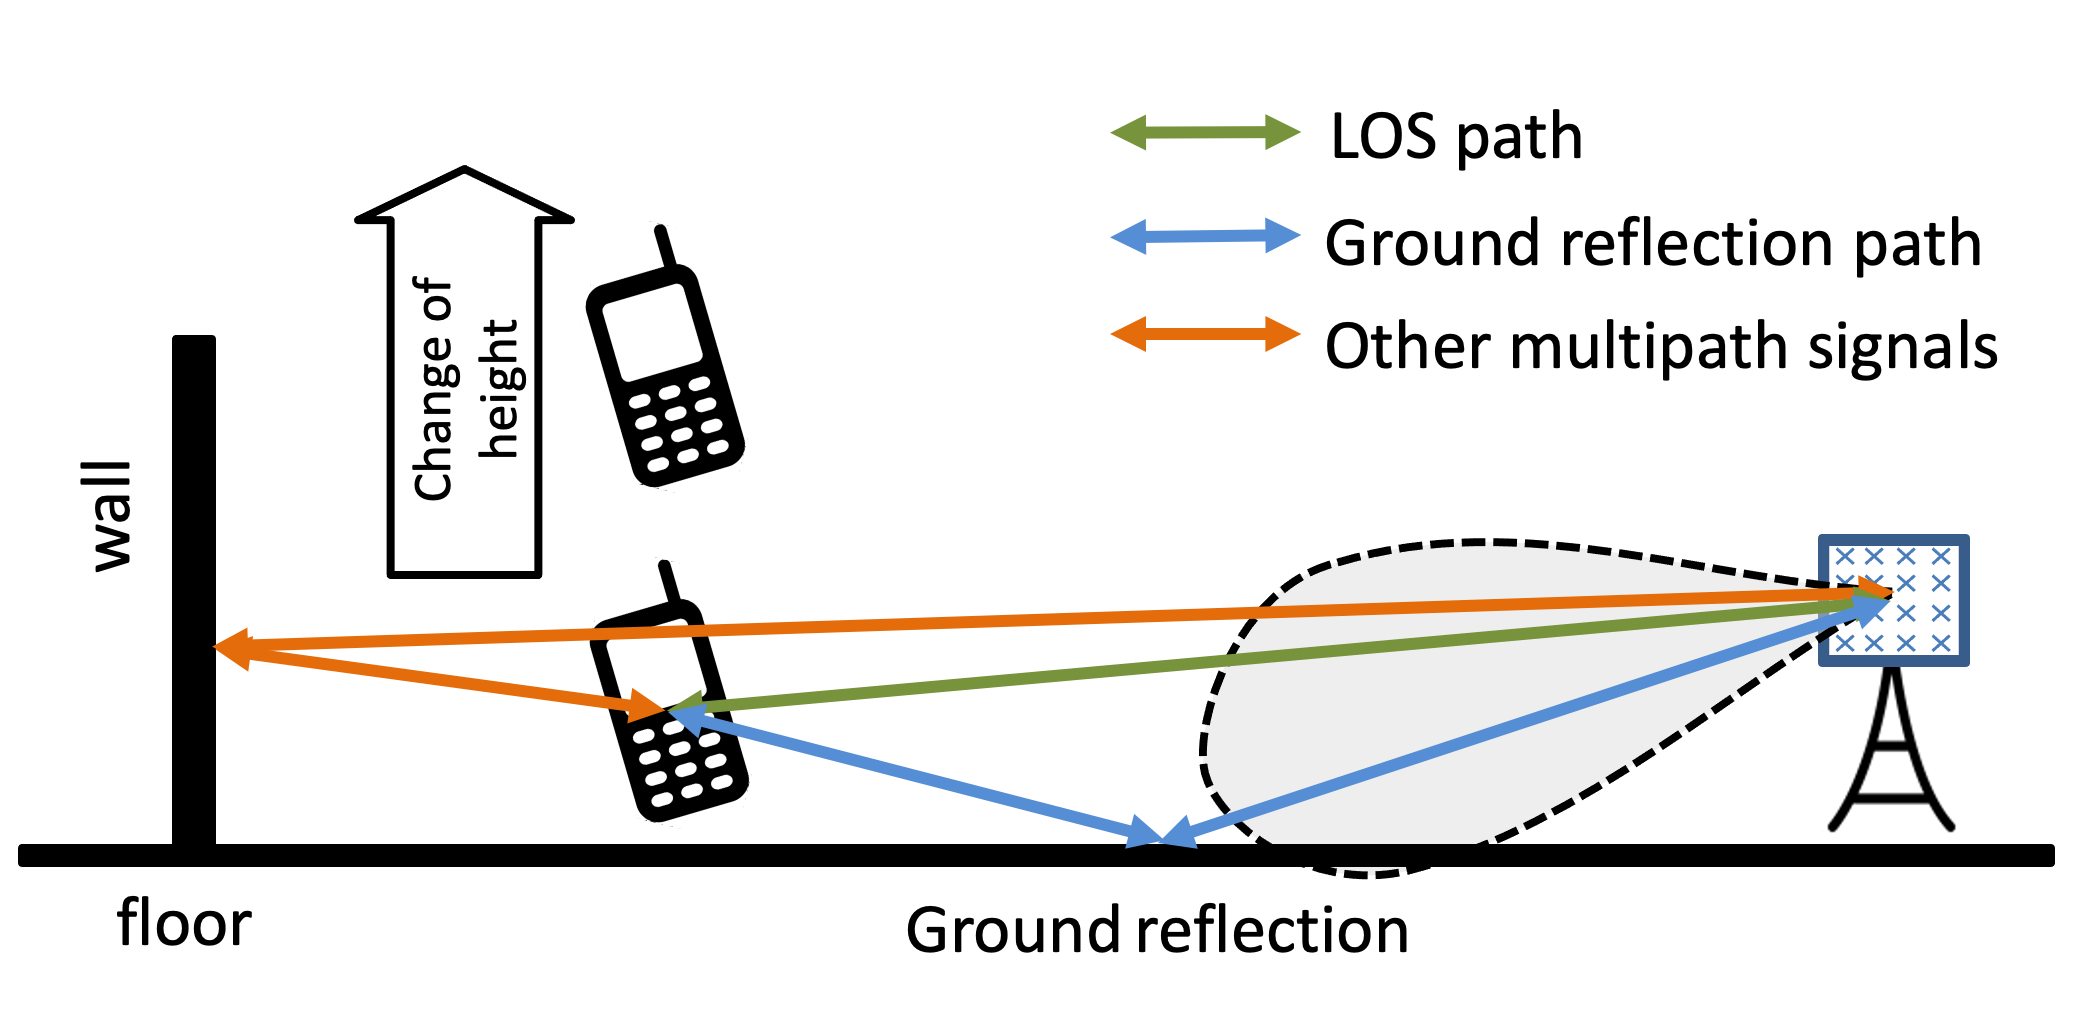
We conducted a measurement campaign to demonstrate the behavior of the TR38.901 model with and without extension and to validate the impact of early clusters. The comparison of measurements with simulations using statistical models can be only performed if the measurements covers also significant amount of different environment characteristics. This is time consuming and subject of future work. For the comparison of the CIRs generated by simulation with an experimental setup the channel model statistics must be constraint accordingly to achieve a better match with the experimental setup. The experimental setup can be considered as small subset of real world scenarios, whereas the statistical model targets several scenarios. In our experiment we focused on the impact of one type of EC, the ground reflection.
The measurement setup is described in Fig. 6, and the campaign was carried out in the L.I.N.K. test center [7]. The general planning of the floor consists of an open area bounded by the walls. In a first experiment we placed no additional objects around the UE. Hence, we expect mainly EC from ground reflections (GR) and ceiling. The distance to the walls was around 10 . These reflections are not considered as EC. The measurements were performed at a carrier frequency of 3.75 (wavelength = 8 ). To change the additional path length of the ground reflection we moved the UE along the Z-axis covering a UE height in the range between 0.7 and 3.3 . The different UE height has a minor impact to the LOS distance and the beamwidth of the antenna was high to minimize antenna effects on the pathloss. The BS was positioned at a height of 1.7 . The measured channels that were analyzed correspond to a (good) line-of-sight situation. Results for measurements including also OLOS conditions can be found in [5]. The distance between the UE and BS is 28 , wherein the LOS distance may change by 4 at different heights relative to the shortest distance. The path length of the ground reflections changes from 6.6 to 34 relative to the LOS distance. Hence, the difference between the LOS path and the ground reflection changes by almost 3 times the wavelength. Accordingly, constructive (in-phase) and destructive addition of the LOS and ground reflection is expected when the UE height changes.
As transmit signal, we selected a 5G compliant SRS signal with 100 bandwidth, the same signal as used for the simulation. The SRS was transmitted by the UE with an omni-directional antenna. The antenna of the receiving BS is characterized with a 60°beamwidth.
For the evaluation, we derived the reference signal received power (RSRP), reference signal received path power for the estimated first path (RSRPP) and the measured time-of-arrival (ToA) for the first path. In addition, we recorded the bandwidth limited CIR corresponding to the correlation between the transmitted SRS and the reference signal at the receiver.
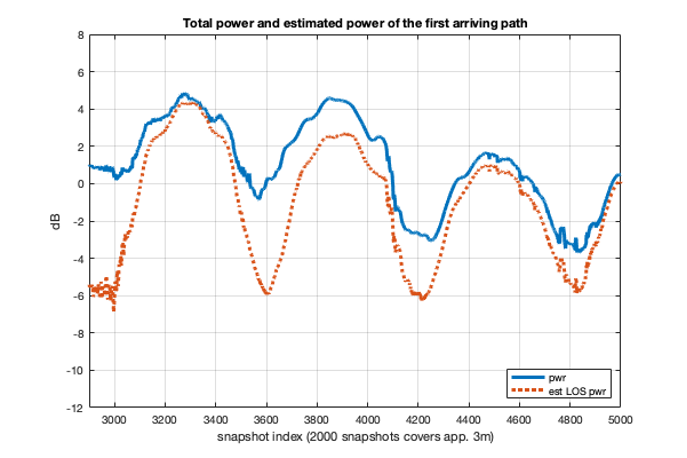
Due to the low delay of the ground reflection it is difficult to distinguish between the LOS path and the ground reflection. Taking into account the in-phase and out-of-phase addition of the two components, from the level variation of the first correlation peak the strength of the ECs, in the experiment mainly the GR, can be estimated.
Fig. 7 depicts the measured (total) signal power and estimated power of the first arriving path over a height variation of around 3 between the first and last measured snapshot. It can be observed that for the total power and estimated LOS power, the change of the phase difference between the direct signal and the reflected signal causes a high signal level variation.
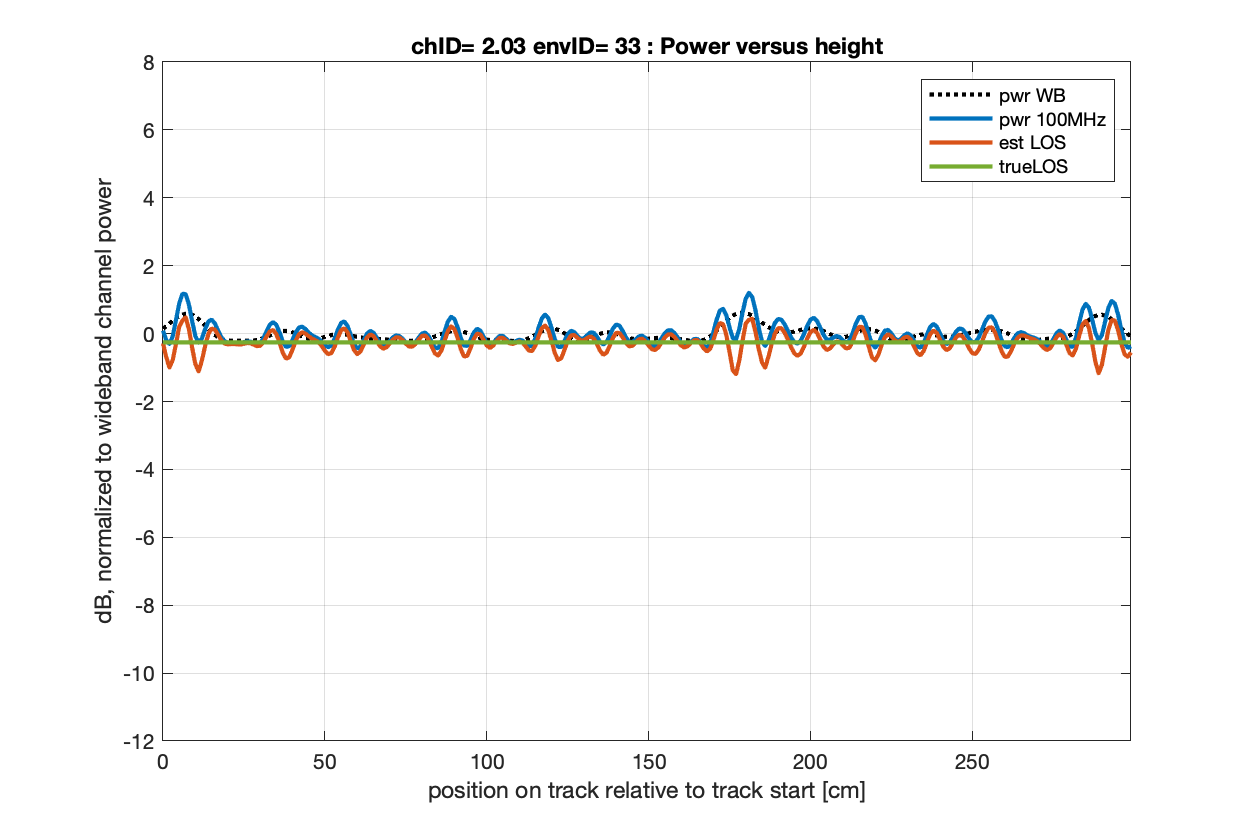
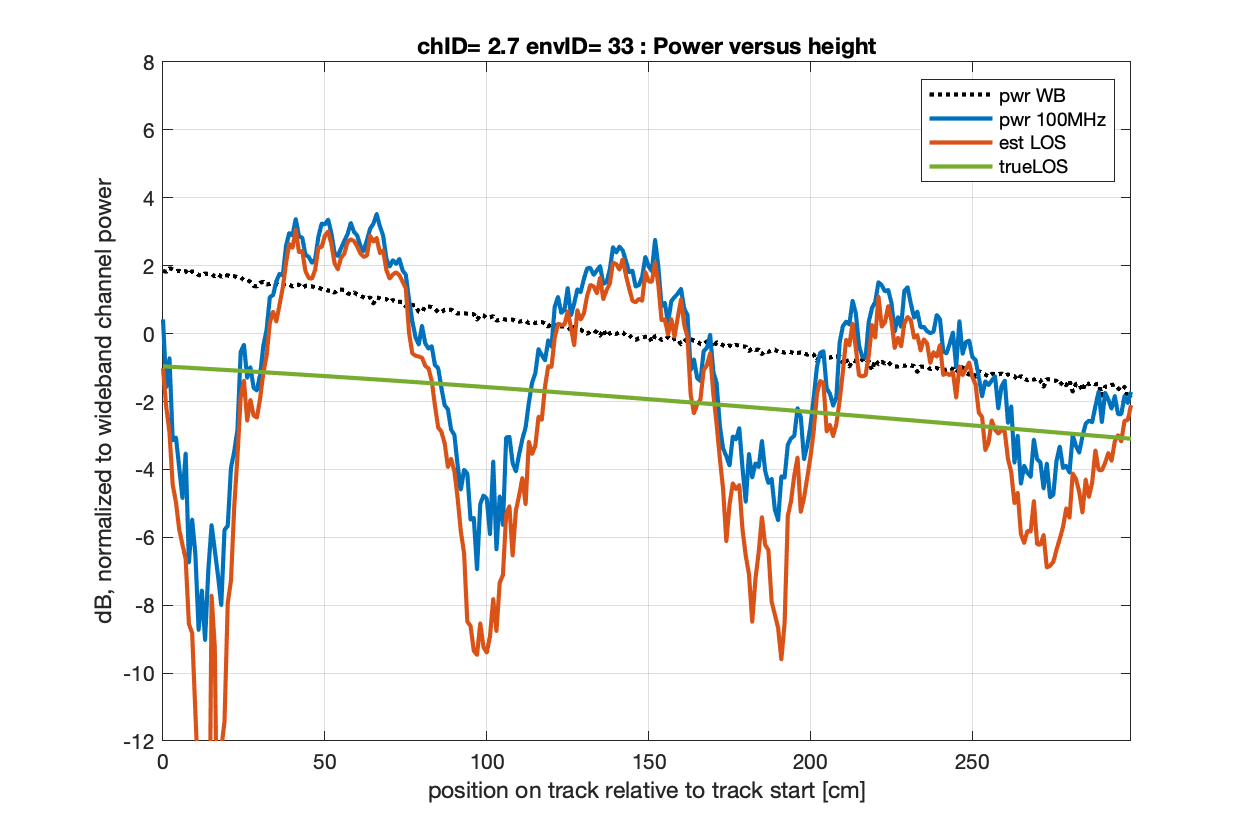
We rebuild the setup using the model and compared the CIRs generated by the model with the measurements. Fig. 8 shows the behavior using the model as defined by [6]. The optional feature ground reflection was NOT enabled. The spatial consistency procedure as defined by [6] was enabled for this simulation. It is observed that the model predicts a nearly constant signal power level. This is caused by the normalisation of the sum of the cluster power according the pathloss and the randomly generated shadow fading. The shadow fading is generated by the large scale model and is spatially correlated. Hence, for different UE heights the shadow fading is constant resulting in constant overall power. The observed small power variation result from the measurement of the power in the signal bandwidth, whereas the sum of the cluster power covers the “wideband” signal power. Fig. 9 depicts the results for the simulation with EC (mainly GR in the example). The low delay of the EC cause a constructive and destructive addition of the LOS and EC within the bandwidth of 100 . Already without fine-tuning of the parameters a good match with the measurement is achieved.
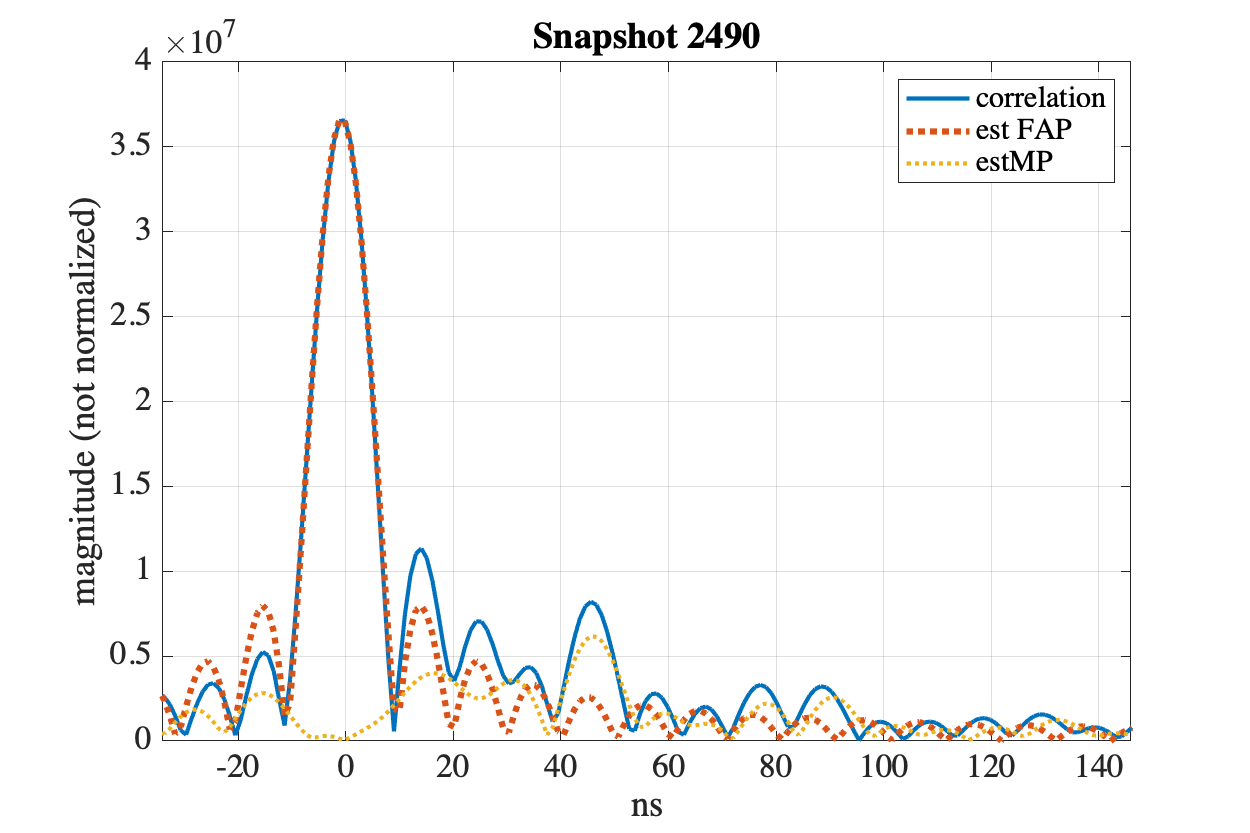
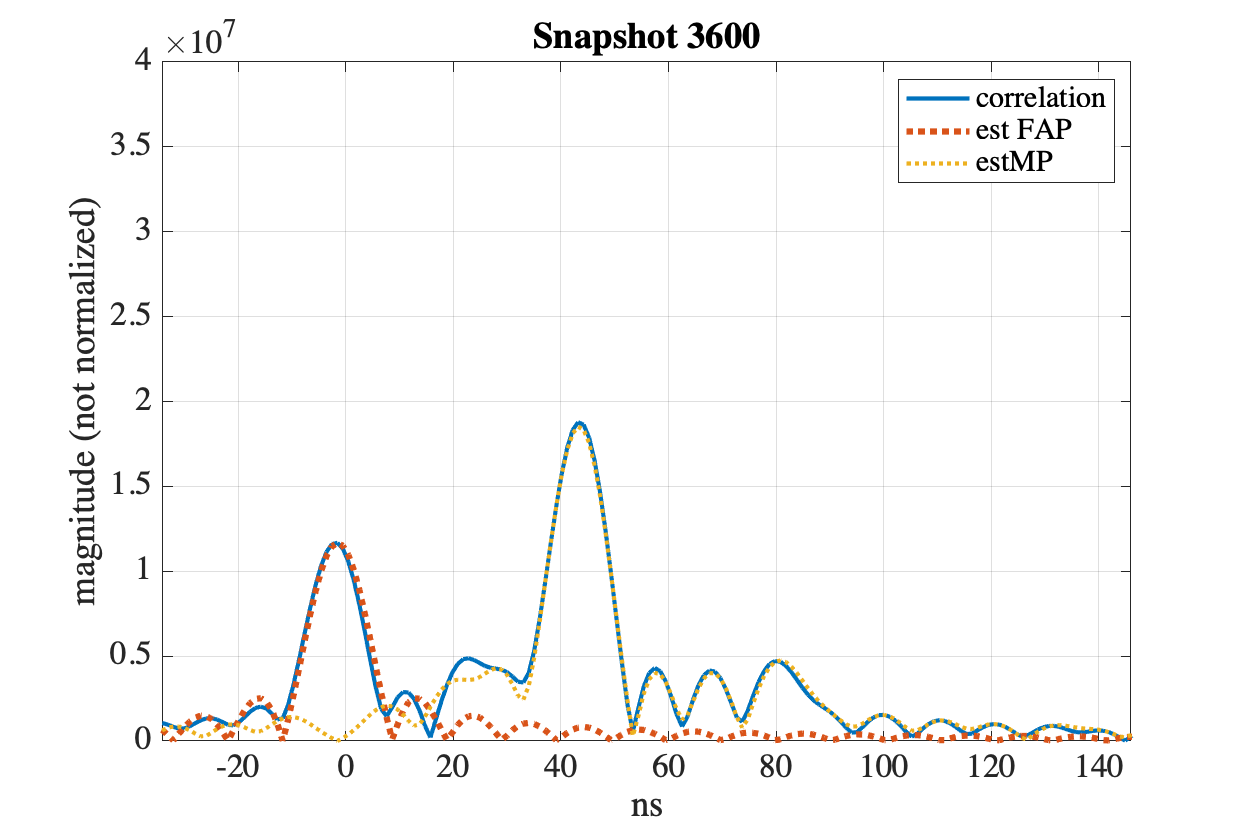
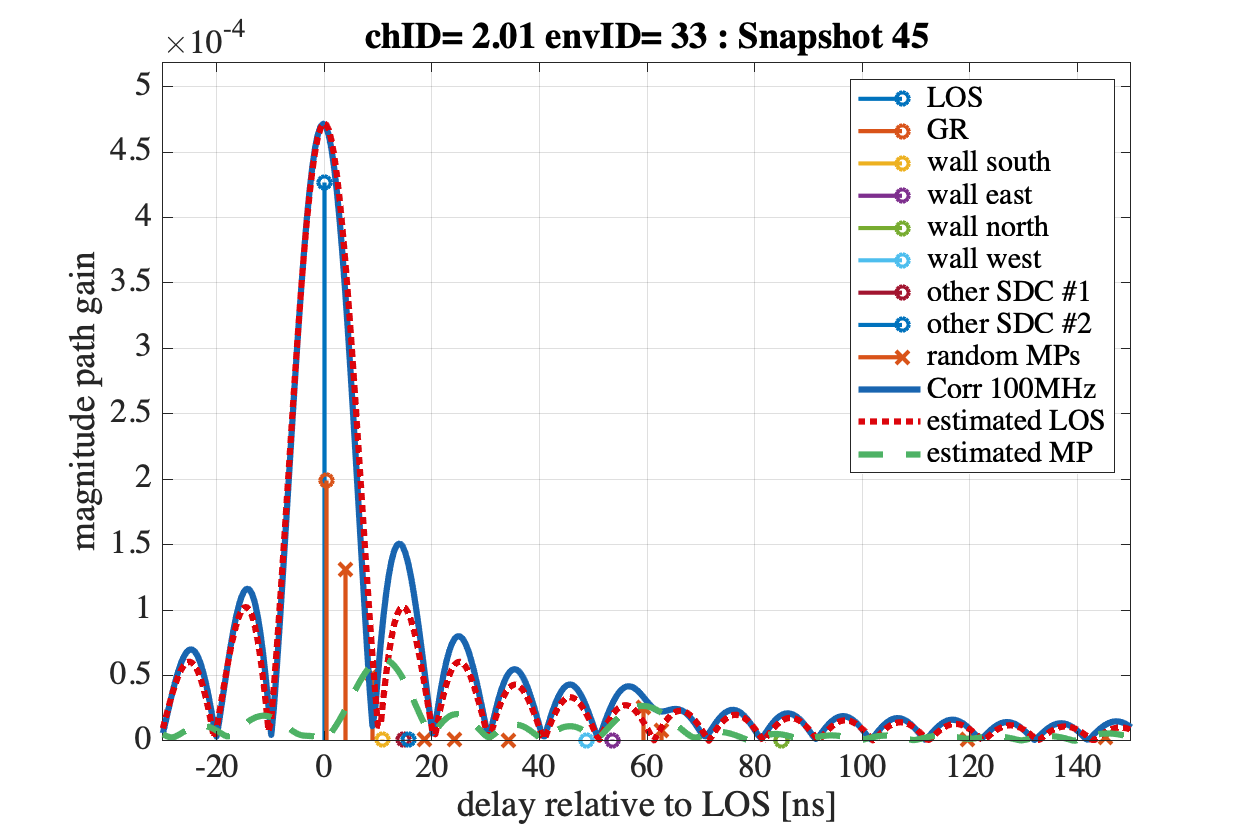
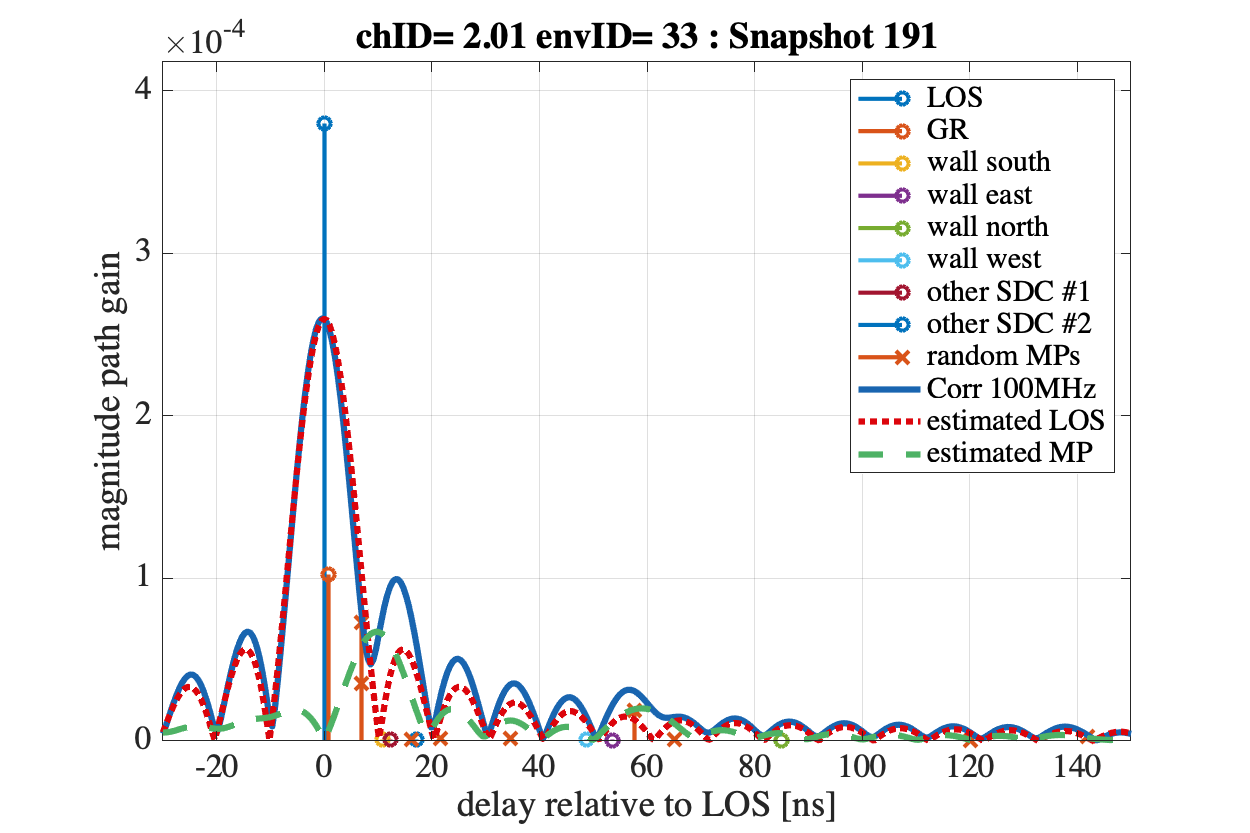
Recording the correlation function allows also a detailed comparison of the CIR generated in simulation and measured. As an example Fig. 10 depicts two examples of the measured CIRs and demonstrates the results from the constructive (in-phase) and destructive (opposite phase) superposition according to the strength of the GR on correlation function given the applied bandwidth-limited SRS. Due to the low propagation delay difference between the LOS and GR signal (less than 1 ) and the bandwidth of 100 , it is difficult to separate the signals. Hence, the measured first-arriving-path (FAP) power is the sum of the LOS and GR components. For the same positions we generated the CIRs also in simulation. In the simulation we know the power and phase of each cluster and can compare the true (wideband) CIR (WB-CIR) with the correlation function representing the bandwidth limited CIR. Fig. 11 shows the magnitude of the WB-CIR and the correlation associated to measured examples given in Fig. 10. The figure show constructive addition of the LOS and GR (the magnitude of the correlation function is higher than the LOS component of the WB-CIR) and destructive superimposition (the correlation peak is lower than the magnitude of the LOS component of the WB-CIR). Comparing the simulation and the measured correlation we observe a significant difference at a delay close to 45 . In the measurement this is caused from the reflection at the wall behind the UE. To include also these effects in the model a ”hybrid approach” is required generating the position of reflecting cluster in a deterministic way. This additional extension of the TR38.901 model is subject of [5]
VI Conclusion
In this paper, the effect of early clusters (EC) on radio channel modeling for simulations is presented. A precise modeling of the EC is essential for the verification and optimisation of algorithms targeting reality-like performance. Using channel model described in TR 38.901 as a baseline, a statistical analysis was performed. Due to the stochastic nature of the generation of the clusters and their respective parameters, we show that clusters representing strong reflections arriving with a low delay are generated with a low probability only. Hence, simulation results based on this model may be optimistic and may not justify the need of enhancements.
Complementary to the proposed model extension, a method for the statistical evaluation of the simulation results is presented. The proposed metric is a good indicator on the level of difficulty of the randomly generated CIRs and can be used for sorting the simulation results to better identify critical scenarios.
Accordingly, for positioning evaluation based on TR38.901 we recommend the following:
-
•
Activation of optional features like ground reflection as already covered by the TR 38.901 model
-
•
More flexibility in the definition of the statistical properties of the power delay profile (PDP) is required. The proposed method combining two channels, whereas the first channel focuses on the parameters relevant for communication and the second channel covers the effects important for positioning, offers sufficient flexibility and allows the reuse of the existing channel model software with minor modifications.
-
•
Further extensions are proposed in [5].
References
- [1] 3GPP Radio Access Network Working Group and others, “Service requirements for cyber-physical control applications in vertical domains; Technical Specification (TS) 22.104, version 18.3.0., 3rd Generation Partnership Project (3GPP),” in 3GPP TR 38.901, version 18.3.0., 2022.
- [2] 3GPP Radio Access Network Working Group and others, “Service requirements for the 5G system; Technical Specification (TS) 22.261, version 18.6.1.; 3rd Generation Partnership Project (3GPP),” in 3GPP TR 38.901, version 18.6.1., 2022.
- [3] 3GPP Radio Access Network Working Group and others, “3rd Generation Partnership Project 3GPP; Technical Report Study NR positioning enhancements,” in 3GPP TR 38.857, version 17.0.0., (Sophia Antipolis, France), 2021.
- [4] 3GPP Radio Access Network Working Group and others, “3rd Generation Partnership Project 3GPP; Technical Report Study on NR Vehicle-to-Everything (V2X),” in 3GPP TR 38.885, version 16.0.0., (Sophia Antipolis, France), 2021.
- [5] M. Alawieh, E. Eberlein, S. Jäckel, N. Franke, B. Ghimire, T. Feigl, G. Yammine, and M. C., “Complementary Semi-Deterministic Clusters for Realistic Statistical Channel Models for Positioning,” arXiv:2207.07837 [eess.SP], pp. 1–6, 2022.
- [6] 3GPP Radio Access Network Working Group and others, “3GPP TR 38.901 3rd Generation Partnership Project; Technical Report Study on channel model for frequencies from 0.5 to 100 GHz (Rel. 17),” in 3GPP TR 38.901, (Sophia Antipolis, France), 2022.
- [7] Fraunhofer Institute for Integrated Circuits (IIS), “Fraunhofer Test and Application Center L.I.N.K.,” 2022.