Characterizing Nodes and Edges in Dynamic Attributed Networks: A Social-based Approach
Abstract.
How to characterize nodes and edges in dynamic attributed networks based on social aspects? We address this problem by exploring the strength of the ties between actors and their associated attributes over time, thus capturing the social roles of the actors and the meaning of their dynamic interactions in different social network scenarios. For this, we apply social concepts to promote a better understanding of the underlying complexity that involves actors and their social motivations. More specifically, we explore the notion of social capital given by the strategic positioning of a particular actor in a social structure by means of the concepts of brokerage, the ability of creating bridges with diversified patterns, and closure, the ability of aggregating nodes with similar patterns. As a result, we unveil the differences of social interactions in distinct academic coauthorship networks and questions & answers communities. We also statistically validate our social definitions considering the importance of the nodes and edges in a social structure by means of network properties.
1. Introduction
The large amount of data available today from Internet services and applications has allowed us to explore how entities relate to each other. As such, we can map entities and their links as social networks in order to provide new kinds of analysis, both structural and social (Easley and Kleinberg, 2010), for instance, to characterize entities behaving like hubs (Newman, 2004) or acting as bridges by connecting different parts of a network (Granovetter, 1973). Indeed, the so-called social network analysis has contributed to understand how highly connected complex networks work, ranging from graph theory to property rights (Watts and Strogatz, 1998; Newman et al., 2006; Silva, 2020). In this regard, based on how entities play structural roles in networks, we contribute with a social-based perspective in order to better analyze the behavior and the strength of the ties involving such entities.
We recall that in general social networks are constructed considering the existence of explicit relationships (e.g., social ties with relatives). In this static structural scenario, one approach is to explore the notion of social capital given by the position of the nodes in the social network structure (Granovetter, 1973; Coleman, 1988; Burt, 1992). For instance, Granovetter (Granovetter, 1973) defines the concept of weak ties as being those important relationships that make a network more cohesive by means of the creation of bridges between communities. As discussed by Aral (Aral, 2016), the most influential sociological theories explore bridging ties (e.g., connecting different parts of a network) and cohesive ones (e.g., building a trust circle), which provide more advantage when accessing information passing through a network.
However, as explicit relationships evolve to other kinds of interactions (e.g., encounters, phone calls, exchanged messages, etc.), they become more complex, thus bringing more information about these social interactions. In this way, a more general approach is required to model these specificities by using only edge or node attributes (Aggarwal et al., 2016; Rezaei et al., 2017). By doing so, it is possible to promote more information about the social motivation involving each interaction, since individuals tend to change their attributes over time, whether in terms of location (a new job or country), relationships with other people (childhood friends who no longer participate in their network) or new skills acquired. This would enable us to understand the evolution of social structures, in which the persistence of attributes over time indicates the social value associated with each interaction.
Additionally, several other works have investigated topological properties and patterns of social networks in order to define the behavior of their actors and measure the strength of their relationships (Newman, 2004; Barabási, 2009; Huang et al., 2018; Leão et al., 2018; Levchuk et al., 2012). Exploring the behavior and the dynamics of the actors in a social network is essential for a better understanding of its social structure, which is usually characterized by graphs that capture the social aspects involved (Medo et al., 2016; Silva et al., 2015; Yang and Xie, 2016). Accordingly, Barabási (Barabási, 2009) reinforces the importance of the network theory paradigm as fundamental for understanding the complexity that involves actors and their relationships. For example, Newman (Newman, 2004) measures the influence of the nodes in a network based on their proximity and the number of shortest paths among them.
In a previous work (Silva et al., 2019, 2020), we analyzed how social aspects impact knowledge transfer in a network. Our proposed model allows one to represent the social dynamics of node-attribute relationships to capture the influence generated by knowledge transfer. Here, we go a step forward and focus on the strength of nodes and their dynamic relationships over time by means of social capital.
More specifically, in this article, we propose to address together distinct aspects: actors, interactions, time intervals, attributes and social concepts. Our strategy to address theses issues consists in modeling nodes by associating them with their attributes in order to extract persistent features over time. Regarding its social perspective, our method is based on Burt’s definition of social capital by considering two concepts: closure, the ability of aggregating actors with similar patterns, and brokerage, the ability of creating bridges with diversified patterns (Burt, 2005).
In a preliminary work (Silva et al., 2018), we presented two specific contributions to this kind of analysis: (i) a node-attribute graph model that captures the social tie of individuals and their associated attributes, thus providing a dynamic attributed model that enables us to mine multiple interactions over time; and (ii) a new method to classify nodes and their relationships based on temporal node-attributes that considers the social role of the nodes and the social meaning of the edges.
Here, we extend our previous work by first redefining the classes assigned to nodes and edges in order to reflect the social concepts behind the proposed model. For this reason, both nodes and edges are now thoroughly classified according to the concepts of closure and brokerage. We also contribute by applying our new social classification strategy to different types of social network, therefore providing a detailed discussion underlying social aspects based on additional experiments.
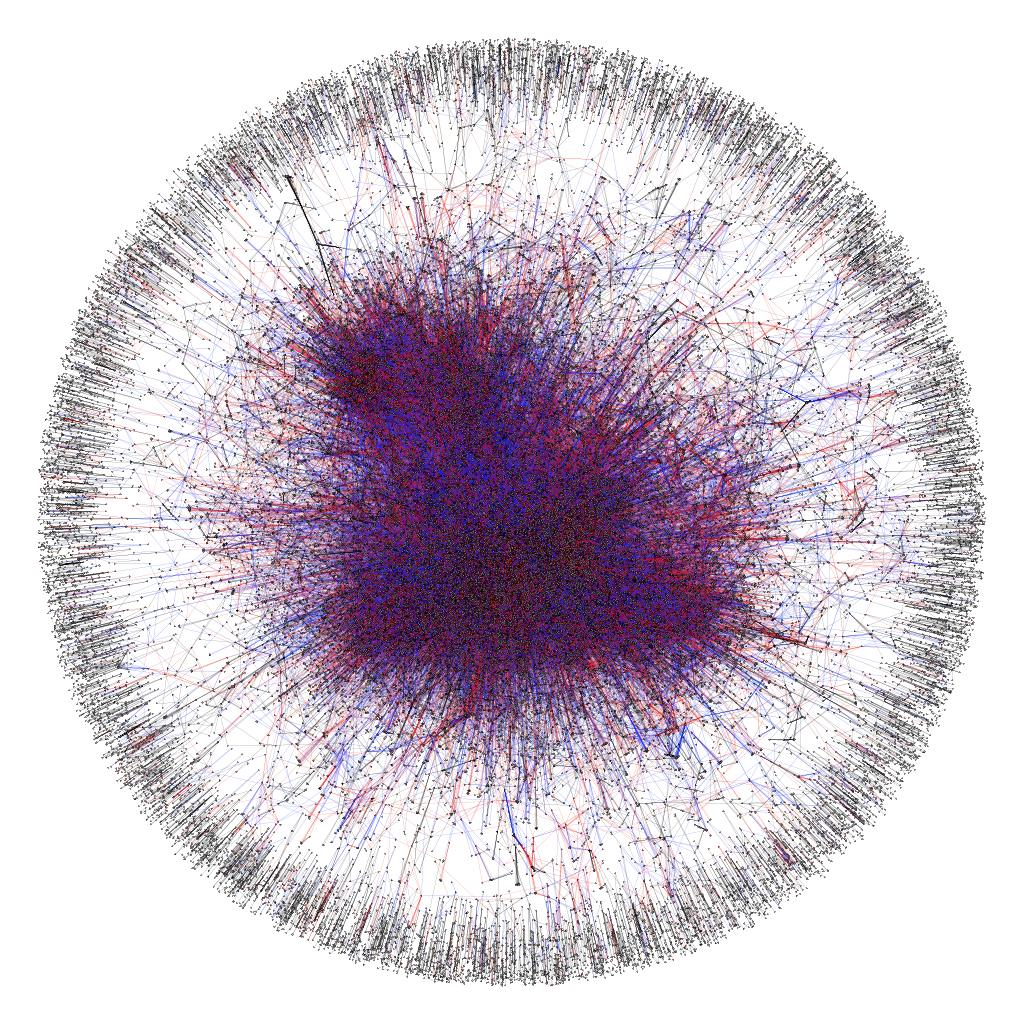
In order to illustrate this, Figure 1 shows a Computer Science academic coauthorship network, including more than 79 thousand nodes and 263 thousand edges, built on data collected from DBLP (details presented in Section 4.1). In this network, the edges classified according to the concept of closure are shown in blue, those classified according to the concept of brokerage are shown in red and those that express no social meaning (i.e., that are non-relevant) are shown in black. Note that the edges based on the brokerage and closure concepts dominate the center of the graph, while the extremities tend to have a greater prominence of edges regarded as non-relevant. This means that edges strongly related to social concepts tend to be better positioned in a social structure (i.e., linked to central nodes), which provides early access to information passing through the network. Our approach allows to analyze networks in terms of their structural autonomy, which occurs when people are tightly connected to one another with extensive bridge ties beyond them, thus achieving high levels of innovation and productivity because there are both trust and cooperation between individuals who connect different parts of a network (Burt, 2005).
The rest of this article is organized as follows. Firstly, Section 2 reviews related work, whereas Section 3 introduces our proposed model and describes the methodology adopted for evaluating it. Then, Section 4 analyzes and discusses the results of applying our classification method to different social network scenarios, whereas Section 5 summarizes the results of our experimental validation. Finally, Section 6 presents our conclusions and some considerations for future work.
2. Related Work
The study of the individuals’ dynamics enables us to understand the evolution of social networks, thus providing models to characterize their behavior (Silva, 2020; Iacobelli and Figueiredo, 2017; Medo et al., 2016; Silva et al., 2015; Barabási et al., 2002). For instance, Barabási et al. (Barabási et al., 2002) capture the social tie importance by observing the topology and the nodes’ internal behavior in coauthorship networks, whereas Sun et al. (Sun et al., 2013) propose a model to analyze the social dynamics of science in terms of scientific disciplines. Yet, Iacobelli and Figueiredo (Iacobelli and Figueiredo, 2017) explore random walks on dynamic networks to better characterize and understand their structures. In another context, Silva et al. (Silva et al., 2015) characterize the moving properties and the behavioral profile of how researchers move around publication venues stratified in terms of their quality, whereas Brandão et al. (Brandão et al., 2017) address how the social roles of researchers change over time. Also, traditional network metrics have been employed to identify the most important nodes within a graph, such as done by Newman (Newman, 2004) that uses centrality metrics based on shortest paths (e.g., closeness and betweenness) for determining the best positioned nodes in academic social networks.
Several other studies analyze social networks based on particular social concepts such as tie strength (Brandão et al., 2017; Brandão and Moro, 2015; Gilbert and Karahalios, 2009; Vaz de Melo et al., 2015), the friendship paradox (Adamic and Adar, 2003; Higham, 2019) and social influence (Jiang et al., 2017), as well as on structures such as triadic closure and social balance (Huang et al., 2018; Giscard et al., 2017). For instance, based on the information shared between nodes, Adamic and Adar (Adamic and Adar, 2003) measure the strength of relationships by analyzing the similarity between messages exchanged between individuals. Yet, Gilbert and Karahalios (Gilbert and Karahalios, 2009) also consider temporal aspects, but modelling tie strength as a linear combination of different dimensions such as intensity by means of the number of words exchanged, emotional support based on positive words, social distance in terms of the political differences, among other aspects. Finally, Levchuk et al. (Levchuk et al., 2012) propose an approach to learn and detect network patterns such as repetitive groups of people involved in coordinated activities.
Regarding social perspectives, several works have explored the notion of social capital given by the strategic positioning of a particular actor in a social structure (Granovetter, 1973; Feng et al., 2018; Burt, 2005). Based on the premise that actors can make a network stronger by integrating different parts, Granovetter (Granovetter, 1973) defines the concept of weak ties as being those important relationships that make a network more cohesive by creating bridges between communities. Likewise, Burt (Burt, 2005) describes a structural hole as the gap formed by individuals who have complementary knowledge, and then defines as brokers those nodes that hold certain positional advantages due to their good location in the social structure. Considering such results, Feng et al. (Feng et al., 2018), for instance, used structural holes to identify the most central and bridging group of nodes in a network.
In another context, Brandão et al. (Brandão et al., 2017) investigate the strength of dynamic social relationships in academic social networks based on topological metrics, thus revealing that such relationships tend to have more weak and random ties than strong and bridges ones. Leão et al. (Leão et al., 2018) analyze the role of random interactions in the structure of communities, whereas Sanz-Cruzado and Castells (Sanz-Cruzado and Castells, 2018) analyze the role played by strong ties (links within communities) and weak ties (links between communities), thus showing that bridges work as enhancers of the structural diversity in social networks.
In this article, we define social classes to better characterize social networks. In this regard, Yang et al. (Yang et al., 2014) propose a metric for expert identification in the StackOverflow Q&A site, which is based on the quality of its users’ contribution. Specifically, they define two profiles: sparrows, as being highly active users on the network that contribute to the vast majority of its content, and owls, as being the most experienced users that provide useful answers. Furtado et al. (Furtado et al., 2013) also characterize users’ behavior in Q&A sites, but observing a dynamic perspective. They define ten profiles based on motivation (e.g., activity duration) and ability (e.g., how useful a comment is) metrics, thus characterizing users as unskilled, expert, activist and hyperactivist. In another context, Vaz de Melo et al. (Vaz de Melo et al., 2015) propose the RECAST (Random rElationship ClASsifier sTrategy) algorithm that identifies random and social interactions based on network properties. Specifically, such algorithm explores topological and temporal aspects in order to measure the strength of the nodes’ relations, which is derived from the neighborhood overlap and the persistence of the relationships. Doing so, it is able to classify the edges of a network by assigning them to one of the following social classes: friend, acquaintant, bridge and random.
Our proposed method also relies on temporal aspects and on the regularity of the relationships over time, but differs from those discussed above by mainly exploring social concepts. In this regard, Alhazmi and Gokhale (Alhazmi and Gokhale, 2016) measure the structural social capital of online social networks by defining closure and brokerage as closed and open triads, respectively. Alternatively, in a recent work (Silva et al., 2019), we classify nodes and edges by inspecting how knowledge is transferred across a network. For this, we depict a closure tie when two individuals are teaching to and learning from each other, whereas a brokerage tie characterizes a knowledge transfer between an expert and an inexpert user. Here, instead of describing an entire network or exploring knowledge-transfer behaviors, we aim at characterizing nodes and edges based on the strength of the social ties with their relevant attributes. Thus, we explore strong ties between nodes and their relevant attributes as representing the closure effect, and weak ties underlying the potential of the knowledge acquired by the nodes in the network as depicting the brokerage effect.
3. Social-based Perspective
In this section, we first present an overview of our method for social-based classification of multiple interactions in dynamic attributed networks (Silva, 2020; Silva et al., 2018). Then, we present and discuss our classification scheme entirely based on social concepts. For this, we reinforced the notion of social capital to capture the importance of the nodes based on their positioning in the network structure and the social meaning of the relationships involved.
3.1. Modeling Dynamic Interactions
In our previous work (Silva et al., 2018, 2020), we modeled attributed networks by a dynamic multigraph that represents a temporal aggregated graph within a time interval . In short, is the union of temporally disjoint graph instances constructed in time steps of size (e.g., days) (Vaz de Melo et al., 2015). Likewise, in order to consider the dynamic temporal attributes, we defined a heterogeneous dynamic multigraph graph , where . This graph consists of two types of node: actors (e.g., researchers) and attributes (e.g., expertise). In other words, this strategy is an abstraction that transforms the attributes of each edge into additional nodes, allowing an original actor node to be directly connected to these new attribute nodes. In this context, each actor is associated with a set of attributes that can change overtime. We also assume that all attributes are related to some knowledge, which can be seen as a skill acquired by the actors along the time.
3.2. Extracting Relevant Attributes
The next step in our approach is to determine the set of relevant attributes for each node at each time interval. We define as relevant attributes those that are closely connected to the nodes, i.e., persistent in their histories. The idea is to identify, for each actor, all attributes and evaluate them in terms of the set of attributes most strongly statistically associated with the actor nodes (i.e., according to their stability along the time).
For this, we analyze the nodes’ interaction history in order to extract knowledge from the node-attribute relationships. We apply the concept of persistence of an edge along the time, which captures the importance of the relationship between two nodes in terms of their associated attributes. The persistence metric of an edge is defined as , where the indicator function is defined as
| (1) |
Note that this operation is performed on each attributed graph at discrete intervals and not on the aggregated graph. In other words, it captures the dynamics by observing the persistence in each temporal subgraph within the time interval .
More precisely, Algorithm 1 details the process of extracting relevant attributes. It receives as input the aggregated graph and the final time interval . In summary, the algorithm inspects, for each actor, all attributes and evaluates them according to their persistence along the time by means of percentiles (function percentile on lines 9 and 11), thus identifying the set of attributes most strongly statistically associated with the actor’s nodes. The idea is to filter such attributes that are exaggeratedly linked to a node in a specific period in comparison to the others, i.e., identifying the abnormal presence of certain attributes at each time point. In order to choose the appropriate statistical method to select the most significant attributes, we first check whether the values of the edge persistence metric follows a normal distribution. Then, we extract the relevant attributes based on the definition of an outlier given by the interquartile range (IQR). Another approach is to use the modified z-score for the same purpose (Iglewicz and Hoaglin, 1993). Since the experimental results were similar for IQR and for the modified z-score, we chose IQR due to the possibility of applying different percentages by means of percentiles (i.e., adapting the constraints according to specifics problems).
As a result, this strategy builds a set comprising all attributes statistically relevant for each node at a time interval (i.e., for each subgraph), which are referenced as . Note that the sets are dynamically built according to the degree of persistence, i.e., different instants may contain completely distinct sets of attributes.
3.3. The Classifier
Our classification scheme reinforces the importance of social concepts as a relevant factor for better understanding the complexity that involves actors and their relationships in dynamic attributed networks. In summary, we classify nodes and edges as follows:
-
•
Node classification. This classification captures the expertise of the nodes by means of their relevant attributes. For example, in an academic social network, a node that has a long-lasting association with attributes like relational model, data definition and query language is likely to have an authority over them. Thus, this node can be classified as having a strong tie with the Databases domain.
-
•
Edge classification. This classification assigns a tie strength to the edges in order to represent the kind of their interactions. For example, in a social media network like Facebook, a strong edge may indicate a social tie between relatives, whereas a weak one may represent a social tie with a co-worker.
Based on the social structure that models the dynamic interactions along the time, the edge classification process assesses the degree of relevance of the attributes associated with each node by considering its past interactions (see Algorithm 1). For this, it determines the dynamic state of a node at each time interval as representing a strong, weak or non-relevant association with a specific attribute (knowledge). In this context, the strong state represents the importance of a node in terms of its expertise within a closed group, whereas the weak one captures its potential for connecting different parts of a network. The next step consists in mapping these dynamic states in order to determine the social classes of the edges. We propose three social classes for edges111In our previous work (Silva et al., 2018), we defined seven classes for the edges (very strong, strong, strong bridge, regular bridge, weak bridge, ordinary and sporadic), but we report that they were not very discriminatory. Thus, here we map the classes according to Burt’s social theory (Burt, 2005), which provided more representative results.: closure, brokerage and innocuous. In this way, such social classes emphasize the strength of the relationships as strong ties (closure), weak ties (brokerage) and non-relevant (innocuous), the latter when there is no relevant information passing through the edge.
Formally, Algorithm 2 describes our process for classifying multiple edges. Note that we express the set of attributes of the edge formed by the nodes and at time as the function . In addition to function , the algorithm receives as input the multigraph , the final time and the function that defines all relevant attributes for each node at each instant (Algorithm 1). First, the algorithm determines the nodes’ dynamic states. These states are assigned independently at each iteration of the algorithm and considering each instant in which an edge is inspected. A node is assigned a state strong when there is a strong temporal link with its attributes at the exact moment of the interaction (lines 4 and 5, and 9 and 10). However, if these attributes do not apply to the inspected edge, then the state weak is assigned to it (lines 6 and 11). If there are no relevant attributes and the node is active in more than one time interval, then the state non-relevant is assigned to it (lines 7 and 12). Once the dynamic states have been assigned to nodes and , the class of the corresponding edge is assigned according to them (lines 13-17). More specifically, the brokerage class can be seen as a social tie of nodes from distinct domains (lines 13 and 14), whereas the closure one establishes a social role by demonstrating a high tightness between a node and its attributes (line 15 and 16). Finally, an innocuous class means that there is no knowledge being disseminated through the inspected relationship (line 17).
For classifying the nodes, the same classes are assigned to them, in which case we mean by closure a node that has authority on certain attributes, by brokerage a node that has a weak association with its attributes and by innocuous a node that has an occasional presence in the network. The function for this node classification is given by
| (2) |
where the indicator function is defined as
| (3) |
In summary, the aforementioned social classes reinforce a sociological perspective based on their positioning in a social structure (Granovetter, 1973; Burt, 2005; Guimera et al., 2005), i.e., by applying social concepts to better understand the strength of the node-attribute relationships. More precisely, we rely on Burt’s definition of social capital (Burt, 2005) by considering the concept of closure as representing the importance of a node in terms of its expertise within a closed group, whereas the concept of brokerage captures its potential for knowledge transfer. In other words, by a closure edge we mean a high tightness between a node and its attributes, whereas a brokerage edge can be seen as a social tie of nodes with distinct relevant attributes. Likewise, when classifying a node, the closure class is assigned to it when there is a strong tie with some knowledge under its set of relevant attributes and the brokerage class when it represents a potential to acquire knowledge from attributes outside its own set of relevant attributes. Indeed, strong ties with certain attributes show an authority on them, whereas weak ties indicates a great potential to diffuse knowledge from its domain. Finally, the innocuous class assigned to a node or edge represents no skill acquired by an individual or a lack of relevant information passing through a relationship, respectively.
4. Characterization of Nodes and Edges
In this section, we characterize several social contexts based on our proposed classification method. We begin by introducing the datasets considered. Then, we analyze the overall results of our method when classifying the social behavior of the nodes and the social meaning of their interactions.
4.1. Datasets
| Network | #snapshots | #nodes | #edges |
| 24 SIG Academic Networks | |||
| Average | 34.5 | 4.0K | 10.9K |
| Median | 35.0 | 2.6K | 7.1K |
| Standard Deviation | 9.8 | 2.9K | 9.2K |
| Full Academic Network | 55 | 79.7K | 263.1K |
| 28 Q&A Communities | |||
| Average | 2.7M | 4.8K | 20.9K |
| Median | 2.7M | 3.6K | 13.8K |
| Standard Deviation | 1.2M | 7.0K | 23.6K |
| Networks | Nodes | Edges | |||||
| closure | brokerage | innocuous | closure | brokerage | innocuous | ||
| 24 SIGs | Average | 27.0% | 15.2% | 57.8% | 29.4% | 35.3% | 35.2% |
| Median | 27.1% | 14.9% | 57.2% | 30.4% | 34.8% | 32.3% | |
| Std. Dev. | 8.5% | 2.8% | 10.8% | 7.0% | 10.4% | 14.6% | |
| Full Network | 18.8% | 12.2% | 69.0% | 31.5% | 37.1% | 31.4% | |
We consider two specific scenarios, academic social networks and Q&A communities, whose datasets were built in our previous work (Silva et al., 2018, 2019). Table 1 shows general statistics of the networks. Overall, they present distinct characteristics that allow us to contrast the effect of our classification method on each scenario.
In summary, the academic scenario consists of 24 co-authorship networks derived from the ACM Special Interest Groups222ACM SIGs: http://www.acm.org/sigs, as well as the full network comprising all groups with more than 79 thousand nodes and 263 thousand multiple edges. In each network, we modeled authors as nodes, coauthorships in each paper as relationships, publications’ year as time intervals and tokens taken from the publication titles as attributes (Silva et al., 2020). Note that such networks are well-known in the Computer Science community, which enables us to carry out a more accurate discussion of their behavioral dynamics.
Regarding the Q&A communities, we use the database built from the Stack Exchange network (Silva et al., 2019). This dataset consists of 173 Q&A communities divided into six categories (Technology, Culture/Recreation, Life/Arts, Science, Professional and Business)333Stack Exchange: https://stackexchange.com.. Specifically, nodes as representing community members and edges as representing answers to questions, comments to questions and comments to answers as described by Paranjape et al. (Paranjape et al., 2017). In addition, each time interval has been configured to last one minute, and tokens taken from the questions and answers as attributes. The extraction process removes stop-words and reduces inflected words to their roots.
4.2. Academic Coauthorship Networks
The Full Network shows a substantial drop from 27.0% to 18.8% in the number of closure nodes when compared with the average of all 24 ACM SIG communities. Despite that, the number of innocuous nodes considerably increased from 57.8% to 69.0%. This was expected due to the fact that more active nodes (researchers) tend to participate in more than one community. Thus, with more subjects covered, the likelihood of having many relevant attributes decreases. Even so, although there are fewer closure nodes, there is still relevant information flowing through them (i.e., high figures for closure and brokerage edges). In fact, such figures indicate that about 30% of all nodes have acted structurally to make the network stronger by means of cohesion (i.e., closure) and bridges (i.e., brokerage).
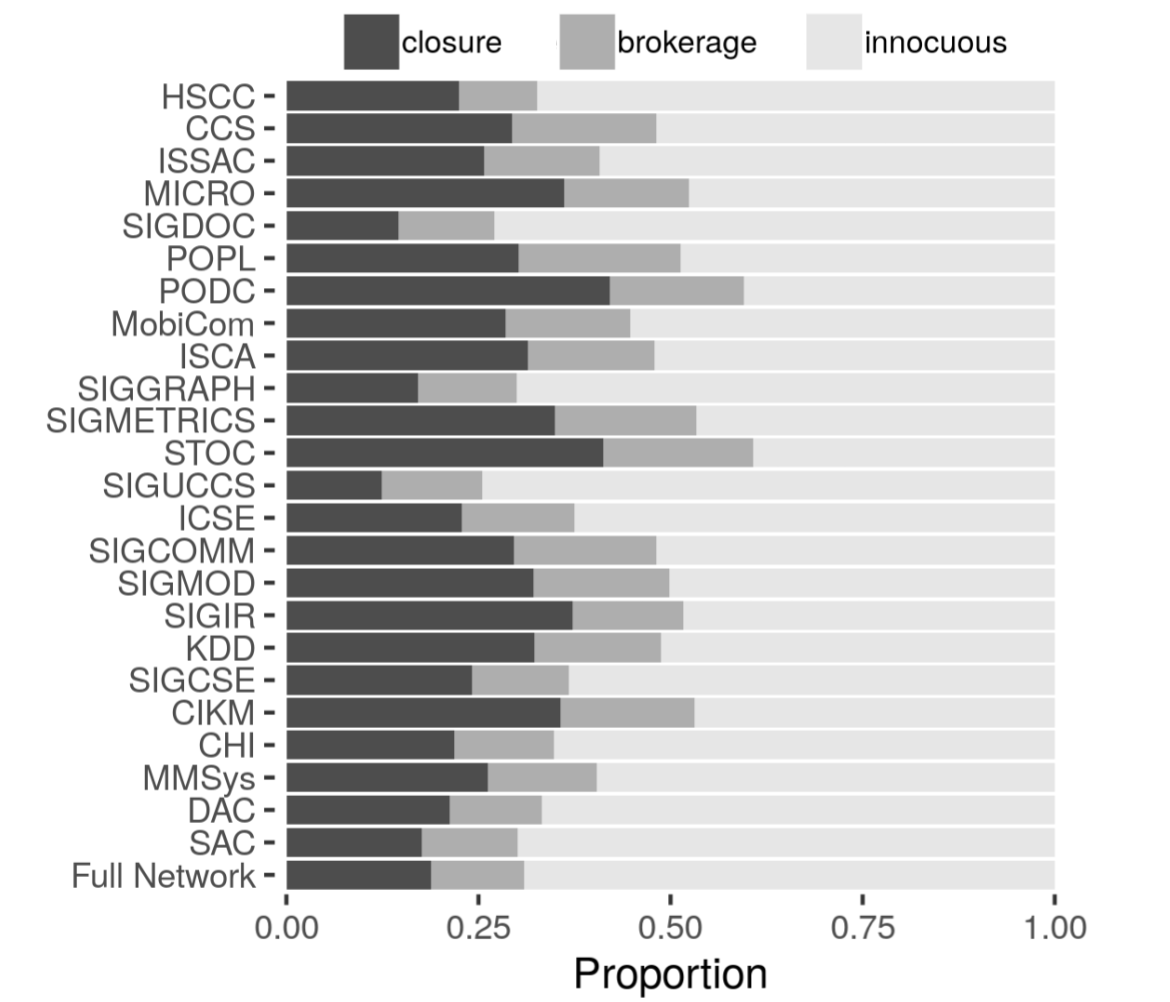
Note also that there are small variations between the means and medians for the 24 ACM SIG communities, but with a marked standard deviation. This means that there are different social behaviors according to the specificities of each community. Specifically, Figure 2(a) presents the distribution of the node classes for the 24 ACM SIG communities and the Full Network that includes all these communities. Overall, the classification shows a significant presence of nodes of the class innocuous (average of 57.8%). Indeed, an academic coauthorship network usually has a strong presence of new nodes (e.g., students or sporadic collaborators). Despite that, there is also a strong presence of nodes of the class closure with percentages above 30% for more established communities such as CIKM, KDD, SIGIR, SIGMOD, STOC, SIGMETRICS, ISCA, PODC, POPL and MICRO. Particularly, most members from these communities tend to be coherent in the research topics addressed throughout their academic trajectories. In contrast, communities such as SAC, SIGUCCS, SIGGRAPH and SIGDOC show percentages below 18% for the class closure, which represents some lack of synergy among their members. Particularly, SIGUCCS (University and College Computing Services) and SIGDOC (Design of Communication) are two communities that address very specific topics. SIGGRAPH (Computer Graphics), although a well established scientific community, covers here only its editions up to 2003, since after that year their proceedings were discontinued and replaced by special issues of the ACM Transactions on Graphics.
Generally, such percentages can be seen as evidence of the characteristics of each community. For instance, members of the STOC (Theory of Computing) community have a tendency to show more competence in specific topics related to computation theory, thus the higher number of nodes of the class closure (41.3%). On the other hand, SAC (Applied Computing) is a community mainly focused on applied issues, thus covering a wide range of topics, which justifies the high number of innocuous nodes (69.9%).
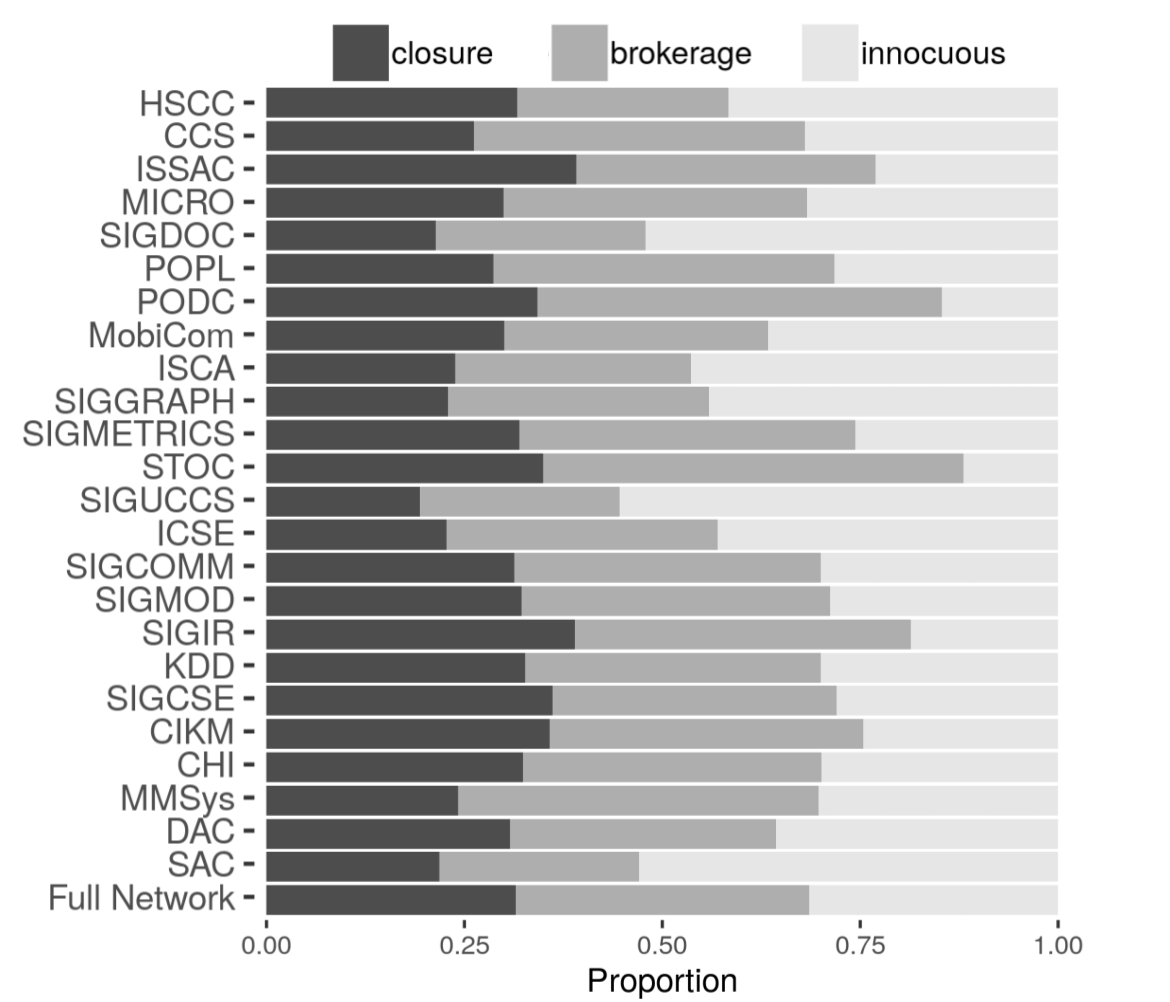
Regarding the edge classification, Figure 2(b) presents the distribution of the edge classes for the 24 ACM SIG networks and the Full Network, which comprises the 24 SIG networks altogether. As we can see, most of these edge classes carry some kind of information and have been characterized as closure or brokerage (on average, they sum 64.7%), thus demonstrating a strong social tie between the researchers and their relevant topics. On the other hand, edges without any social meaning (i.e., innocuous) tend to be less present in these networks. Again, specific communities show a singular behavior, such as ISSAC (Symbolic and Algebraic Computation) and SIGIR (Research and Development in Information Retrieval) with the highest presence of closure edges. SAC, SIGUCCS and SIGDOC also stand out for having an expressive number of innocuous edges (more than 50%), thus reinforcing the fact their members show no regularity with their research topics.
4.3. Questions & Answers Communities
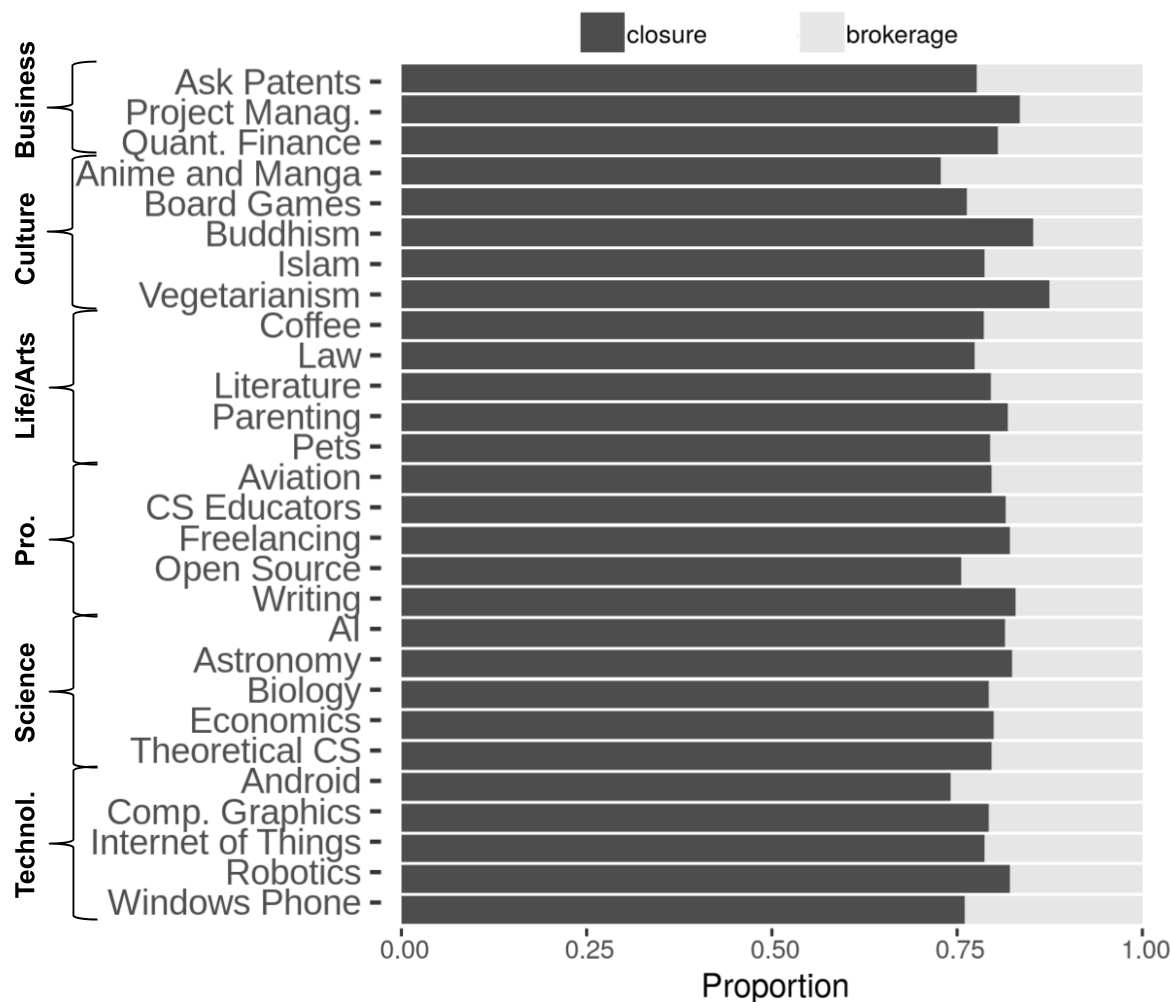
As we only consider frequent users in the Q&A communities (see Section 4.1), by definition there are no innocuous nodes in these networks (Silva et al., 2018). With respect to the node classes, Figure 3(a) shows few variations in the percentages of closure and brokerage nodes across the communities (average values of 79.8% and 20.2%, respectively). More specifically, the Vegetarianism and Buddhism communities show the highest proportions for the closure class (87.5% and 85.3%, respectively), whereas Anime & Manga stands for 72.8%.
In contrast, we notice that the full academic coauthorship network had 18.8% of its nodes classified as closure, 12.2% as brokerage and 69.0% as innocuous (see Table 2). Indeed, there are few closure nodes (e.g., research leaders) in an academic network compared with the other ones (e.g., new students). However, in the Q&A communities, users are in general experts and enthusiasts about specific topics, which gives them some authority (Posnett et al., 2012; Tang et al., 2012; Liao et al., 2017; Shah et al., 2016; Vasilescu et al., 2014).
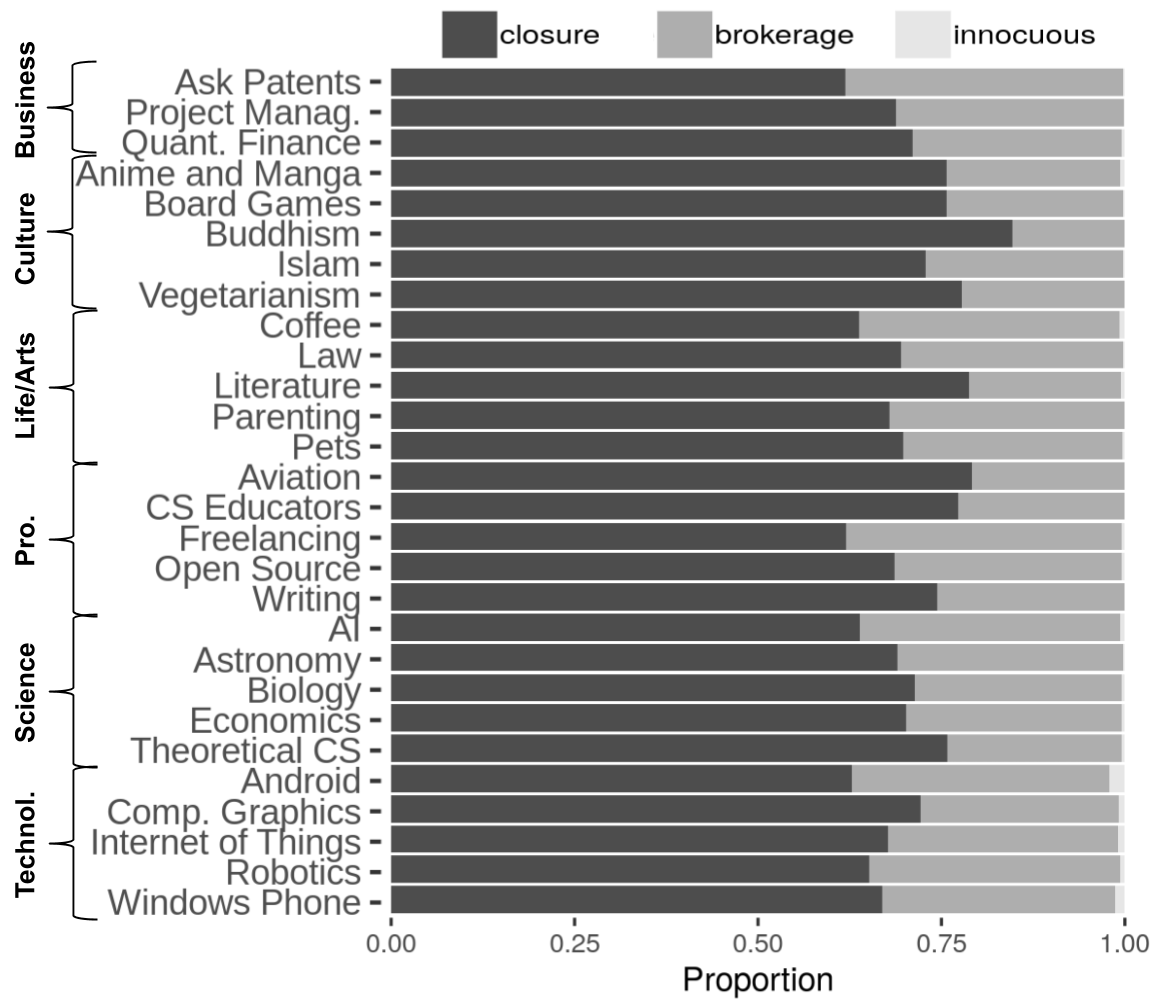
Considering the social classification of the edges in Figure 3(b), the proportions by category and by community have significant oscillations, thus reinforcing a distinct behavior of our classification method on several topics. For example, the Buddhism community (85.3% of closure nodes) has 84.7% of closure edges, whereas the AI community (81.4% of closure nodes) has a much smaller proportion of edges (63.8%) belonging to that same class. There are also notorious divergences between communities in the same category such as Ask Patents and Quantitative Finance from the Business category, Aviation and Freelancing from the Professional category, and Literature and Parenting from the Life/Arts category. As we only selected frequent users, it justifies the very low presence of innocuous edges.
By comparing the Q&A distribution by community with the same figures from the academic ones (see Table 2), we observed that the entire DBLP academic coauthorship network had 38.5% of its edges classified as closure, 41.6% as brokerage and 20.2% as innocuous. That is, we note that both scenarios reveal very different proportions of assigned classes, particularly with a higher proportion of the closure class in the Q&A scenarios, whereas in the academic scenarios the most representative class tended to be the brokerage one.
5. Evaluation of Nodes and Edges
Given the challenging task of analyzing social interactions in a social network in order to better characterize the social role of its nodes and the meaning of its edges, Newman (Newman, 2004) applies network properties to evaluate the robustness of his proposed method. More specifically, he applied centrality metrics to determine the best-placed nodes in a network.
As we are also dealing with non-labeled data, we evaluate our unsupervised classification by means of the nodes and edges acting as structurally important in a network. In others words, our methodology consists of quantifying how well nodes and edges are positioned in a social structure. For this, we explore network metrics as formally presented by Table 3, which their social aspects are discussed as follows:
| Metric | Formula |
| Degree centrality of a node | |
| where | |
| Closeness centrality of a node | |
| where is the distance between | |
| nodes and | |
| Betweenness centrality of an edge | |
| where is the number of | |
| shortest paths from node to node | |
| that pass through the edge | |
| Betweenness centrality of a node | |
| where is the total number of | |
| shortest paths from node to node | |
| and is the number of those | |
| paths that pass through the node | |
| Clustering coefficient of a node | |
| where is the number of edges | |
| between neighbors of and is the | |
| number of neighbors of node |
-
•
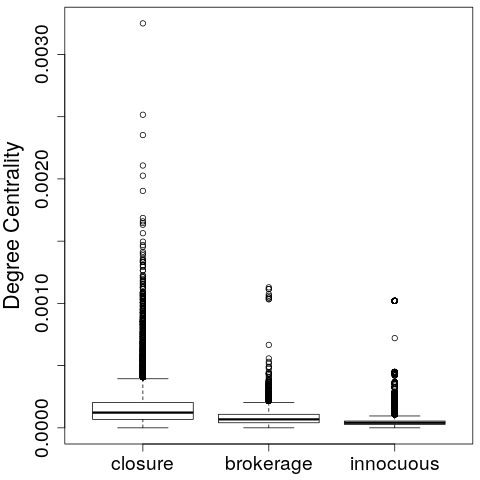
Degree Centrality. As shown by Srinivas and Velusamy (Srinivas and Velusamy, 2015), this metric indicates influential nodes as, for example, a node with an immediate risk of catching a virus or getting some information. Thus, a node with high connectivity is more likely to have early access to knowledge.
-
•
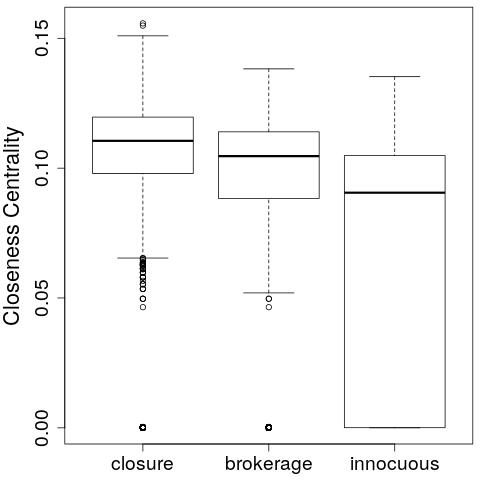
Closeness Centrality. Nodes with higher closeness are, by definition, closer (on average) to the other nodes in the network. Then, we expect important classes (closure and brokerage) to have high values for this metric, since they have better access to knowledge from other nodes (e.g., making an opinion to reach other nodes more quickly).
-
•
Betweenness Centrality. Following Newman (Newman, 2004), nodes with a high degree of betweenness centrality are likely to be influential, since they act as an intermediary for other nodes (e.g., in message-passing scenarios). Thus, as nodes and edges with high betweenness centrality values play crucial roles in the spread of knowledge in social networks (Mahyar et al., 2018), then we expect high values for this metric for important nodes and edges assigned to the closure and brokerage classes.
-
•
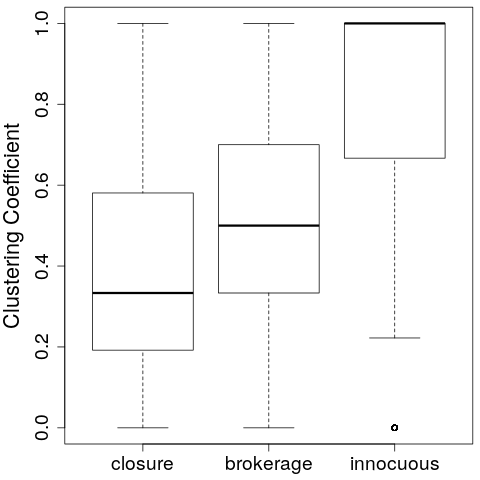
Clustering Coefficient. As this metric reveals the fraction of a node’s neighbors that are connected to each other (i.e., how complete the neighborhood of a node is) (Srinivas and Velusamy, 2015), we expect low clustering coefficient values for the most important classes (closure and brokerage), confirming the behavior of connecting different parts of a network.
In addition, we also use the PageRank algorithm (Page et al., 1999) by considering that more important nodes tend to make stronger endorsements due to their connectivity and ties to other important nodes. That is, we also expect closure and brokerage nodes to have high values for this metric.
5.1. Results
By means of the aforementioned social properties, we now assess the importance of nodes and their dynamics relationships by contrasting the classes assigned to them with the network properties444All experiments were performed with a significance level of .. Considering the node classification, Figure 4 shows the distribution of the network properties by node class. In Figure 4(c), we can see that the lowest clustering coefficient values are for nodes classified as closure, followed by those classified as brokerage. On the other hand, nodes classified as innocuous tend to have worse positions in the social structure. In this way, these results indicate that nodes classified as innocuous are highly dependent on their neighborhood, while those classified as closure and brokerage tend to diversify their relationships. In addition, Figure 4(b) and 4(a) confirm that nodes classified as closure and brokerage tend to have a better position in the social structure as, respectively, having more connections in the network (high degree centrality) and being on average closer to other nodes (high closeness centrality).
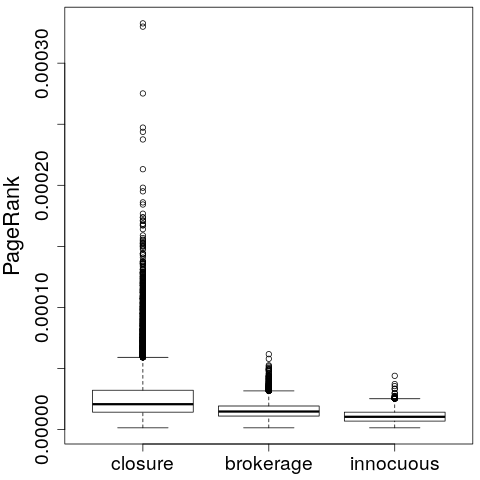
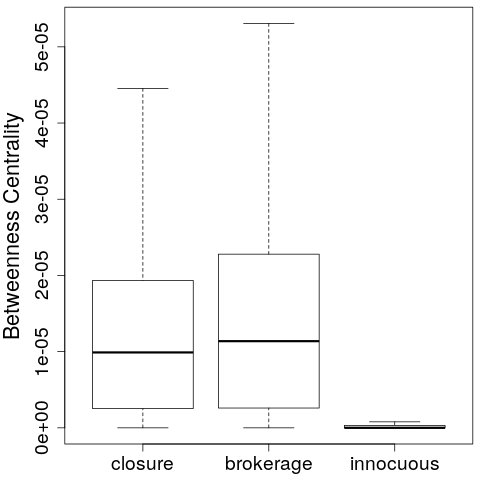
Considering the importance of nodes in terms of the paths that pass through them and how much endorsement they receive, Figures 4(d) and 4(e) respectively show that nodes classified as closure and brokerage have more information passing through them and are seen as topologically more relevant by their peers. Note that all cases have a clear class distinction. Formally, all distributions are statistically different by means of the Mann-Whitney-Wilcoxon test (among all classes) and by the Kruskal-Wallis test (between each pair) (Hollander et al., 2013).
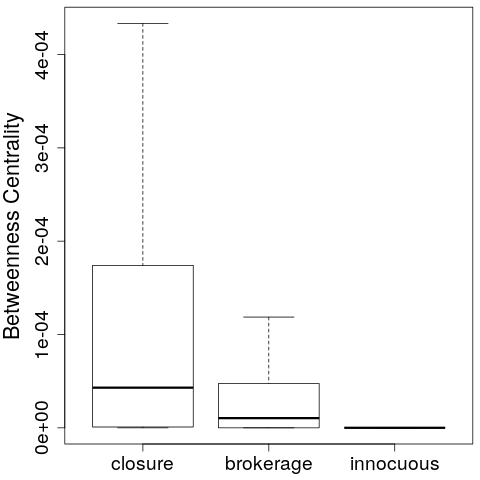
As for the classification of the edges, Figure 5(a) shows the distribution of the betweenness centrality metric with respect to our classification. We clearly note that the brokerage and closure classes have more expressive values for this metric. Note that the distributions of closure and brokerage distinguish less than those reported for nodes, but now the brokerage class is slightly superior to the closure one in contrast to the classification of the nodes (Figures 4a-e). Nonetheless, they are still statistically different according to the Kruskal-Wallis and Mann-Whitney-Wilcoxon tests. Moreover, even though the innocuous class accounts for 31.4% of all edges, their centrality values are very low.
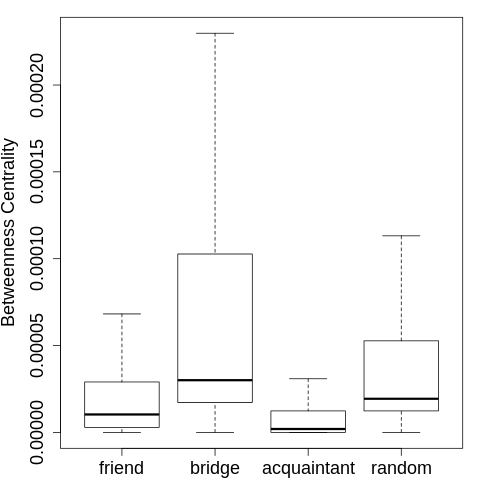
For the sake of comparison, Figure 5(b) depicts the same distribution for the RECAST classes. As discussed in Section 2, the RECAST algorithm assigns social classes to edges in temporal networks. For this, it explores the regularity of the relationships and the topological overlap existing among them over time. By comparing such regularities with random temporal graphs, it classifies social ties as friend, bridge, acquaintant and random. In this way, we expect the important social classes (friend and bridge) to have better network properties than those considered less important (acquaintant and random).
Similar to our classification, the most expressive values of centrality are those assigned to the bridge class. On the other hand, RECAST classifies many structural edges (i.e., those with high network properties) as random, as well as several edges with low figures as friend. In conclusion, our method brings a new perspective and provides a more accurate analysis to characterize such relationships.
5.2. Sensitivity Analysis
Since we are dealing with temporal attributed networks, the relevant attributes and time aspects must be properly analyzed regarding the effectiveness of our classification method. Accordingly, we address these issues next.
Discriminatory power of the attributes. In order to measure the strength of social interactions, Algorithm 1 ensures the function containing the sets of all statistically relevant attributes for each node. In fact, if an attribute is associated with a node several times, then we can infer its importance.
However, a specific statistical treatment can be added to this process in order to exclude attributes that, even if randomly distributed, were erroneously considered as relevant ones. This additional statistical step consists in making the function , which associates each edge with a specific set of attributes, a random association . Then, we get from different instances to measure the probability that each attribute has been erroneously classified as being relevant. Finally, we exclude such attributes that were considered as relevant with probability significantly higher than the level of significance . In other words, we filter from our input the attributes that can interfere in the process of identifying the relevant ones. Even removing some of the data, we expect the proposed method to be robust enough to properly classify nodes and edges.
As a result, both configurations (without the exclusion step and with the step of excluding attributes that are not statistically valid when randomly distributed) are statistically equivalent by means of the distribution of network properties by classes.
Existence time of the nodes. This sensitivity test consists in investigating the robustness of our approach to differentiate nodes with similar existence times. For this, we divided the nodes into the following annual time intervals: , , e . Our method was able to distinguish the distributions of all network metrics by classes for all time intervals in terms of the Kruskal-Wallis test. However, for the time interval , the Mann-Whitney-Wilcoxon test did not differentiate the distributions between the classes closure and brokerage for the metrics betweenness centrality and clustering coefficient.
6. Conclusions and Future Work
In this article, we reinforce the importance of the network theory paradigm for understanding the complexity that involves real world actors and their relationships (Barabási, 2009). Based on the structural autonomy that captures when people are tightly connected to one another with extensive bridge ties beyond them (Burt, 2005), we emphasize the concept of closure as representing the importance of a node in terms of its expertise according their associated attributes (strong ties), whereas the brokerage one captures its potential for transferring its attributes (weak ties). Then, we proposed a node-attribute graph model that captures the social tie of individuals and their associated attributes, thus exploring the importance of the persistence of node-attribute relationships over time.
Overall, our classification method was able to reveal the social role of the nodes and the strength of the social meaning of their multiple interactions in different social contexts from academic coauthorship networks and Q&A communities. For instance, there is a contrasting social behavior when comparing the Theory of Computing and Applied Computing networks, as well as when we compare the Buddhism and Islam communities. In addition, based on Newman’s experimental methodology (Newman, 2004), we statistically validated the assigned classes according to network properties, thus agreeing with their expected social meaning.
As future work, we aim to apply our social-based characterization approach to the problem of community detection (Leão et al., 2018; Dao et al., 2020). We also intend to propose a new strategy to explore its propagation behavior, mainly focusing on knowledge transfer aspects (i.e., characterizing how the attributes pass through the network) (Silva et al., 2020). In addition, we plan to investigate the persistence of the nodes with respect to their neighborhood in order to identify the most influential ones.
Acknowledgments
This work was supported by the authors’ individual grants from CAPES and CNPq.
References
- (1)
- Adamic and Adar (2003) Lada A Adamic and Eytan Adar. 2003. Friends and neighbors on the web. Social Networks 25, 3 (2003), 211–230.
- Aggarwal et al. (2016) Charu Aggarwal, Gewen He, and Peixiang Zhao. 2016. Edge classification in networks. In Proceedings of the 32nd IEEE International Conference on Data Engineering. IEEE, Helsinki, Finland, 1038–1049.
- Alhazmi and Gokhale (2016) Huda Alhazmi and Swapna S Gokhale. 2016. Mining Social Capital on Online Social Networks with Strong and Weak Ties. In Proceedings of the 2nd International Conference on Open and Big Data (OBD). IEEE, 9–16.
- Aral (2016) Sinan Aral. 2016. The future of weak ties. Amer. J. Sociology 121, 6 (2016), 1931–1939.
- Barabási (2009) Albert-László Barabási. 2009. Scale-free networks: a decade and beyond. Science 325, 5939 (2009), 412–413.
- Barabási et al. (2002) Albert-Laszlo Barabási, Hawoong Jeong, Zoltan Néda, Erzsebet Ravasz, Andras Schubert, and Tamas Vicsek. 2002. Evolution of the social network of scientific collaborations. Physica A: Statistical mechanics and its applications 311, 3-4 (2002), 590–614.
- Brandão and Moro (2015) Michele A Brandão and Mirella M Moro. 2015. Analyzing the Strength of Co-authorship Ties with Neighborhood Overlap. In Proceedings of the International Conference on Database and Expert Systems Applications. Springer, Valencia, Spain, 527–542.
- Brandão et al. (2017) Michele A Brandão, Pedro O S Vaz de Melo, and Mirella M Moro. 2017. Tie Strength Dynamics over Temporal Co-authorship Social Networks. In Proceedings of the International Conference on Web Intelligence. ACM, Leipzig, Germany, 306–313.
- Burt (1992) Ronald S Burt. 1992. Structural holes: The social structure of competition. Harvard University Press, New York, USA.
- Burt (2005) Ronald S Burt. 2005. Brokerage and Closure: An Introduction to Social Capital. Oxford University Press, New York, USA.
- Coleman (1988) James S Coleman. 1988. Social capital in the creation of human capital. Amer. J. Sociology 94 (1988), S95–S120.
- Dao et al. (2020) Vinh Loc Dao, Cécile Bothorel, and Philippe Lenca. 2020. Community structure: A comparative evaluation of community detection methods. Network Science 8, 1 (2020), 1–41.
- Easley and Kleinberg (2010) David Easley and Jon Kleinberg. 2010. Networks, Crowds, and Markets: Reasoning About a Highly Connected World. Cambridge University Press, Cambridge, UK.
- Feng et al. (2018) Jian Feng, Dandan Shi, and Xiangyu Luo. 2018. An identification method for important nodes based on k-shell and structural hole. Journal of Complex Networks 6, 3 (2018), 342–352.
- Furtado et al. (2013) Adabriand Furtado, Nazareno Andrade, Nigini Oliveira, and Francisco Brasileiro. 2013. Contributor Profiles, their Dynamics, and their Importance in Five Q&A Sites. In Proceedings of the 2013 Conference on Computer Supported Cooperative Work. Association for Computing Machinery, San Antonio, Texas, USA, 1237–1252. https://doi.org/10.1145/2441776.2441916
- Gilbert and Karahalios (2009) Eric Gilbert and Karrie Karahalios. 2009. Predicting tie strength with social media. In Proceedings of the SIGCHI Conference on Human Factors in Computing Systems. ACM, Boston, MA, USA, 211–220.
- Giscard et al. (2017) Pierre-Louis Giscard, Paul Rochet, and Richard C Wilson. 2017. Evaluating balance on social networks from their simple cycles. Journal of Complex Networks 5, 5 (2017), 750–775.
- Granovetter (1973) Mark S. Granovetter. 1973. The Strength of Weak Ties. Amer. J. Sociology 78, 6 (1973), 1360–1380.
- Guimera et al. (2005) Roger Guimera, Brian Uzzi, Jarrett Spiro, and Luis A Nunes Amaral. 2005. Team assembly mechanisms determine collaboration network structure and team performance. Science 308, 5722 (2005), 697–702.
- Higham (2019) Desmond J Higham. 2019. Centrality-friendship paradoxes: when our friends are more important than us. Journal of Complex Networks 7, 4 (2019), 515–528.
- Hollander et al. (2013) Myles Hollander, Douglas A. Wolfe, and Eric Chicken. 2013. Nonparametric Statistical Methods. Vol. 751. John Wiley & Sons, Hoboken, New Jersey, USA.
- Huang et al. (2018) Hong Huang, Yuxiao Dong, Jie Tang, Hongxia Yang, Nitesh V Chawla, and Xiaoming Fu. 2018. Will Triadic Closure Strengthen Ties in Social Networks? ACM Transactions on Knowledge Discovery from Data 12, 3 (2018), 30.
- Iacobelli and Figueiredo (2017) Giulio Iacobelli and Daniel Ratton Figueiredo. 2017. Edge-attractor random walks on dynamic networks. Journal of Complex Networks 5, 1 (2017), 84–110.
- Iglewicz and Hoaglin (1993) Boris Iglewicz and David Caster Hoaglin. 1993. How to Detect and Handle Outliers. Vol. 16. ASQC Quality Press, Milwaukee, USA.
- Jiang et al. (2017) Jiuchuan Jiang, Peng Shi, Bo An, Jianyong Yu, and Chongjun Wang. 2017. Measuring the social influences of scientist groups based on multiple types of collaboration relations. Information Processing & Management 53, 1 (2017), 1–20. https://doi.org/10.1016/j.ipm.2016.06.003
- Leão et al. (2018) Jeancarlo C Leão, Michele A. Brandão, P. O. Vaz de Melo, and Alberto H. F. Laender. 2018. Who is really in my social circle? Mining Social Relationships to Improve Detection of Real Communities. Journal of Internet Services and Applications 9, 20 (2018), 20:1–20:17.
- Levchuk et al. (2012) Georgiy Levchuk, Jennifer Roberts, and Jared Freeman. 2012. Learning and detecting patterns in multi-attributed network data. In Social Networks and Social Contagion, AAAI Fall Symposium Series. AAAI, Arlington, Virginia, USA, 1–13.
- Liao et al. (2017) Lizi Liao, Xiangnan He, Hanwang Zhang, and Tat-Seng Chua. 2017. Attributed Social Network Embedding. CoRR abs/1705.04969 (2017).
- Mahyar et al. (2018) Hamidreza Mahyar, Rouzbeh Hasheminezhad, Elaheh Ghalebi, Ali Nazemian, Radu Grosu, Ali Movaghar, and Hamid R. Rabiee. 2018. Identifying central nodes for information flow in social networks using compressive sensing. Social Network Analysis and Mining 8, 1 (2018), 33:1–33:24. https://doi.org/10.1007/s13278-018-0506-1
- Medo et al. (2016) Matúš Medo, Manuel S Mariani, An Zeng, and Yi-Cheng Zhang. 2016. Identification and impact of discoverers in online social systems. Scientific Reports 6 (2016), 34218.
- Newman et al. (2006) Mark Ed Newman, Albert-László Ed Barabási, and Duncan J Watts. 2006. The structure and dynamics of networks. Princeton university press, Washington, DC, USA.
- Newman (2004) Mark E J Newman. 2004. Who is the best connected scientist? A study of scientific coauthorship networks. In Complex Networks. Springer, Heidelberg, Berlin, 337–370.
- Page et al. (1999) Lawrence Page, Sergey Brin, Rajeev Motwani, and Terry Winograd. 1999. The PageRank citation ranking: Bringing order to the web. Technical Report. Stanford InfoLab.
- Paranjape et al. (2017) Ashwin Paranjape, Austin R Benson, and Jure Leskovec. 2017. Motifs in temporal networks. In Proceedings of the Tenth ACM International Conference on Web Search and Data Mining. ACM, Cambridge, UK, 601–610.
- Posnett et al. (2012) Daryl Posnett, Eric Warburg, Premkumar Devanbu, and Vladimir Filkov. 2012. Mining stack exchange: Expertise is evident from initial contributions. In Proceedings of the International Conference on Social Informatics. IEEE, Lausanne, Switzerland, 199–204.
- Rezaei et al. (2017) Aria Rezaei, Bryan Perozzi, and Leman Akoglu. 2017. Ties That Bind: Characterizing Classes by Attributes and Social Ties. In Proceedings of the 26th International Conference on World Wide Web (Companion Volume). ACM, Perth, Australia, 973–981.
- Sanz-Cruzado and Castells (2018) Javier Sanz-Cruzado and Pablo Castells. 2018. Enhancing structural diversity in social networks by recommending weak ties. In Proceedings of the 12th ACM Conference on Recommender Systems. 233–241.
- Shah et al. (2016) N. Shah, A. Beutel, B. Hooi, L. Akoglu, S. Gunnemann, D. Makhija, M. Kumar, and C. Faloutsos. 2016. EdgeCentric: Anomaly Detection in Edge-Attributed Networks. In Proc. of the ICDM Workshops. IEEE Computer Society, Barcelona, Spain, 327–334. https://doi.org/10.1109/ICDMW.2016.0053
- Silva (2020) Thiago H. P. Silva. 2020. Characterizing Multiple Interactions in Dynamic Attributed Networks based on Social Concepts. Ph.D. thesis. Federal University of Minas Gerais, Belo Horizonte, Brazil.
- Silva et al. (2018) Thiago H. P. Silva, Alberto H. F. Laender, and Pedro O. S. Vaz de Melo. 2018. Social-Based Classification of Multiple Interactions in Dynamic Attributed Networks. In Proceedings of the IEEE International Conference on Big Data. IEEE, Seattle, WA, USA, 4056–4065.
- Silva et al. (2019) Thiago H. P. Silva, Alberto H. F. Laender, and Pedro O. S. Vaz de Melo. 2019. Characterizing Knowledge-Transfer Relationships in Dynamic Attributed Networks. In Proceedings of the 2019 IEEE/ACM International Conference on Advances in Social Networks Analysis and Mining. Association for Computing Machinery, Vancouver, Canada, 234–241. https://doi.org/10.1145/3341161.3342883
- Silva et al. (2020) Thiago H. P. Silva, Alberto H. F. Laender, and Pedro OS Vaz de Melo. 2020. On knowledge-transfer characterization in dynamic attributed networks. Social Network Analysis and Mining 10, 1 (2020), 1–16.
- Silva et al. (2015) Thiago H. P. Silva, Mirella M Moro, and Ana Paula C Silva. 2015. Authorship Contribution Dynamics on Publication Venues in Computer Science: an Aggregated Quality Analysis. In Proceedings of the 30th Annual ACM Symposium on Applied Computing. ACM, Salamanca, Spain, 1142–1147.
- Srinivas and Velusamy (2015) Amedapu Srinivas and R Leela Velusamy. 2015. Identification of influential nodes from social networks based on Enhanced Degree Centrality Measure. In Proceedings of the IEEE International Advance Computing Conference. IEEE, Bangalore, India, 1179–1184.
- Sun et al. (2013) Xiaoling Sun, Jasleen Kaur, Staša Milojević, Alessandro Flammini, and Filippo Menczer. 2013. Social Dynamics of Science. Scientific reports 3 (2013), 1069.
- Tang et al. (2012) Jie Tang, Tiancheng Lou, and Jon Kleinberg. 2012. Inferring Social Ties Across Heterogenous Networks. In Proceedings of the Fifth ACM International Conference on Web Search and Data Mining (Seattle, Washington, USA). ACM, New York, NY, USA, 743–752. https://doi.org/10.1145/2124295.2124382
- Vasilescu et al. (2014) Bogdan Vasilescu, Alexander Serebrenik, Prem Devanbu, and Vladimir Filkov. 2014. How social Q&A sites are changing knowledge sharing in open source software communities. In Proceendings of the 17th ACM Conference on Computer Supported Cooperative Work & Social Computing. ACM, 342–354.
- Vaz de Melo et al. (2015) Pedro O. S. Vaz de Melo, Aline Carneiro Viana, Marco Fiore, Katia Jaffrès-Runser, Frédéric Le Mouël, Antonio A. F. Loureiro, Lavanya Addepalli, and Guangshuo Chen. 2015. RECAST: Telling Apart Social and Random Relationships in Dynamic Networks. Perform. Eval. 87 (2015), 19–36.
- Watts and Strogatz (1998) Duncan J Watts and Steven H Strogatz. 1998. Collective dynamics of ‘small-world’networks. nature 393, 6684 (1998), 440.
- Yang et al. (2014) Jie Yang, Ke Tao, Alessandro Bozzon, and Geert-Jan Houben. 2014. Sparrows and Owls: Characterisation of Expert Behaviour in StackOverflow. In International Conference on User Modeling, Adaptation, and Personalization. Springer, 266–277.
- Yang and Xie (2016) Yunyun Yang and Gang Xie. 2016. Efficient identification of node importance in social networks. Information Processing & Management 52, 5 (2016), 911–922. https://doi.org/10.1016/j.ipm.2016.04.001