Differential phase reconstruction of microcombs
Abstract
Measuring microcombs in amplitude and phase provides unique insight into the nonlinear cavity dynamics but spectral phase measurements are experimentally challenging. Here, we report a linear heterodyne technique assisted by electro-optic downconversion that enables differential phase measurement of such spectra with unprecedented sensitivity (-50 dBm) and bandwidth coverage ( 110 nm in the telecommunications range). We validate the technique with a series of measurements, including single cavity and photonic molecule microcombs.
Microresonator-based Kerr frequency combs (microcombs) have attracted great attention as an optical source and witnessed significant research progress in the last decade. They enable applications ranging from spectroscopy to optical frequency synthesis [1]. Stable microcombs can be generated in various forms including dissipative solitons [2], Turing rolls [3], dark-pulses [4] or soliton crystals [5]. In addition, the cavity can be engineered to display higher order dispersion, resulting in the emission of dispersive waves [6]; and multiple cavities can be linearly coupled to each other, resulting in unique coherent states [7, 8]. Investigating the complex temporal shape of these waveform provides insight into the nonlinear dynamics but the measurement using conventional techniques [9] such as frequency-resolved optical gating or spectral phase interferometry for direct electric-field reconstruction is challenging. The pulse waveforms coming out of the cavity have usually very low energy due to the inherently large repetition rate. In addition, some microcomb waveforms are not transform-limited [4, 7], which reduces the efficiency for nonlinear gating.
A common strategy implemented in the context of microcomb spectral phase measurements is to equalize the phase of the microcomb with a pulse shaper until a transform-limited pulse is inferred from an intensity autocorrelation measurement [10, 11]. This technique played an instrumental role in unraveling the chaotic dynamics in microcombs [10] and the discovery of dark-pulse Kerr combs [4] and soliton crystals [5]. Background-free intensity autocorrelation measurements with high repetition rate pulses require an optical amplifier to boost the signal power and induce sufficient second harmonic power in the intensity autocorrelator. As a result, the spectral phase measurement is limited to the gain bandwidth of the amplifier or the bandwidth of the pulse shaper, whichever is narrower. An alternative diagnostic tool using dual comb interferometry was reported in [12, 13]. This is a linear technique, first proposed in the context of frequency comb complex measurements in [14], which can also enable extremely fast acquisition rates [15]. Dual-comb interferometry allowed for retrieving experimentally the pathway to soliton formation. One drawback of this technique is that it relies on electric-field cross-correlation and thus requires a well-calibrated reference comb.
A linear broadband technique named stepped heterodyne has been successfully implemented for measuring the phase difference between consecutive lines in electro-optic frequency combs [16] and modelocked lasers [17, 18]. The idea lies in beating the signal waveform with a continuous-wave laser that is tuned in a stepped-wise manner across the signal comb lines. The phase of the consecutive lines is embedded in the downconverted radio-frequency beat notes [16]. Here, we adapt this technique for the complex measurement of microcombs. This represents a great challenge as the repetition rate easily exceeds the bandwidth of state of the art photodetectors. We circumvent this issue by combining the technique with electro-optic down-conversion [19].
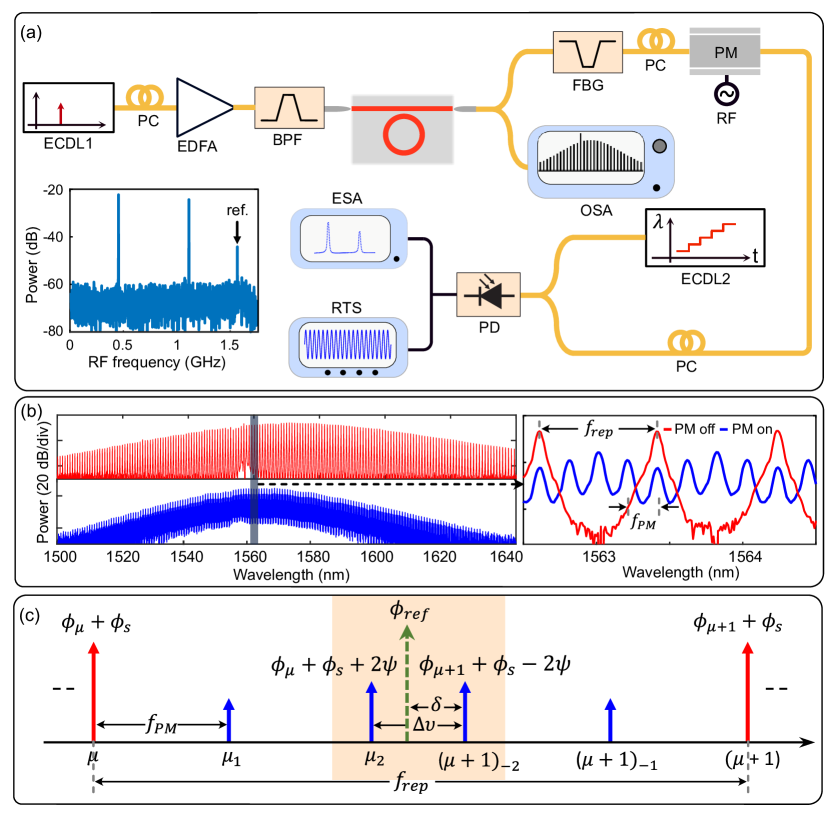
The experimental setup for the measurement of the spectral amplitude and phase is illustrated in Fig.1(a), where the former is directly measured on an optical spectrum analyzer (OSA). Basically, the differential phase is recovered by subtracting the phase of beating signals between the reference laser (ECDL2) and the sidebands of the comb lines. We used an electro-optic phase modulator (PM) to generate the sidebands (Fig. 1(b) blue spectrum) that enables direct referencing of microcomb line spacing to a microwave frequency. The RF modulation frequency () is varied in order to adjust the closest sideband spacing at the center within the detectable range. The phase modulation of the comb generates harmonics at where, represents the microcomb mode number and the electro-optic sideband number. The modulated microcomb field can be represented as . Here, is the frequency of comb line with static phase and is the order Bessel function of the first kind at modulation index . The phase of the RF signal is and phase noise of the optical carrier of the frequency comb is . The sidebands preserve the phase signature of the comb lines with an additional innocuous RF phase offset . Figure 1(c) is the schematic of two comb lines and corresponding sidebands. The phase associated with the comb modes, sideband, and reference laser (green) are labelled. It is assumed that the optical phase noise of the comb is correlated among the comb lines. The reference laser is detuned by frequency from the second-order sideband of mode. The static phase of the mode is and for is . The phase noise of the reference laser is . The phase noise terms () vanish from the differential phase as these terms are common to both the beating signals. With the electro-optic downconversion, the microcomb mode spacing can directly relate to the and a beat note () of the nth order sidebands between the adjacent microcomb modes by [20].
In the measurement, the second-order sidebands of the stable frequency comb are heterodyned with the reference laser. The first two RF peaks in Fig. 1(a) illustrate the resulting beat notes observed on an electrical spectrum analyzer (ESA). As the differential phase measurement is done on a pair of comb lines at a time, the reference laser is stepped at the of the comb. The reference laser position is not critical, as long as it is within the accuracy of . The optical mixing translates the phase difference between the adjacent optical spectrum to an easily measurable low-frequency RF signal. The beat signals have power proportional to the product of the reference laser and the sideband power. As such, the high-power reference laser allows resolving the beat notes of weak comb line powers without resorting to an optical amplifier.
In the differential phase calculation, an RF signal of frequency is required as reference. It is obtained from the beating of the nearest 2nd sidebands in the photodetector (Fig. 1(a) third peak in the ESA plot). However, it requires the optical signal to possess an intensity modulation (IM) of envelope frequency . This is not the case with the phase modulated signal. Therefore, we sent a fraction of modulated spectrum to an optical programmable filter (OPF) used as a periodic narrow bandpass filter centred in between the comb lines (not shown in the schematic).
A real-time scope (RTS) was used for the acquisition of the heterodyne signal detected by a photodiode of bandwidth (1.6 GHz) . The RTS acquires a ten microsecond interval of a beating signal. We record the RTS signal each time the reference laser is stepped to the next comb lines pair. The Fourier processing of the recorded signal results in three non-trivial RF components at , , and . The product of first two components generates an RF signal of frequency whose phase is , with complete cancellation of the phase noise of both the comb source and reference laser. The synthesized RF signal is multiplied with the conjugate of extracted signal. This enables the extraction of the phase difference . Here, the constant phase offset from the reference signal is attributed to the beating of all the second order sidebands passing through the OPF. The phase offsets and merely results in a linear phase term and temporal shift in a reconstructed signal. However, the measured differential phase includes both the inherent comb phase profile and the accumulated dispersion of the fiber assemblies at the output port of the microresonator. We calibrated this residual dispersive phase () with the aid of a swept-wavelength interferometer [24]. The device under test includes the components immediately outside the chip up to the input to the PM. Finally, the phase difference of the comb lines with a constant offset was calculated by subtracting the measured differential phase with the phase difference of the assemblies. Integration of the phase differences results in the relative phase of each comb line upon an otherwise irrelevant linear phase term. This causes a temporal shift when reconstructing the pulse. The intensity profile (Fig. 2 insets) was inferred from the complex optical spectrum as where, is power and is the reconstructed phase of the comb mode .
A crucial aspect of this technique is that it can accurately retrieve the phase profile at extremely low power levels. Remarkably, there is no optical amplifier in the heterodyne setup, allowing for measuring extremely broad microcombs. These features are exemplified with microcombs generated in two different low loss silicon nitride () microresonator configurations: a single ring with anamolous dispersion and coupled cavity rings with normal dispersion. The microresonators were fabricated via a subtractive processing method reported in [25]. The frequency comb was measured at the through port for both cases. We consider a soliton microcomb generation in the single cavity microresonator of free spectral range (FSR) 100 GHz. The same device was used to generate a soliton crystal and multi-soliton consisting of two circulating solitons. The frequency comb is initialized by thermal kicking technique [26] and proceeds to a single soliton state through a slow forward frequency tuning [27]. To generate the comb in the coupled cavity, an auxiliary resonance is first slightly blue-detuned from the main cavity resonance by applying a voltage to a heater circuit. The microcomb is then deterministically generated by blue tuning the pump laser into the main cavity resonance [7].
Numerical simulations of the different comb states were conducted with the Ikeda map to analyze the spectrum and differential phase profiles (Fig. 2 red profiles). For the simulation, some parameters were measured and have the following values: extrinsic coupling rate Hz, intrinsic loss rate Hz, and dispersion ps2km-1. For the photonic molecule frequency comb simulation, we followed ref. [7], where the Raman term is turned off because it plays a negligible effect. The FSRs for the two rings are 100.8 GHz and 99.83 GHz respectively. The main cavity has internal loss rate Hz and coupling rate Hz. The mode coupling induced mode splitting is 607 MHz and dispersion 100 ps2km-1.
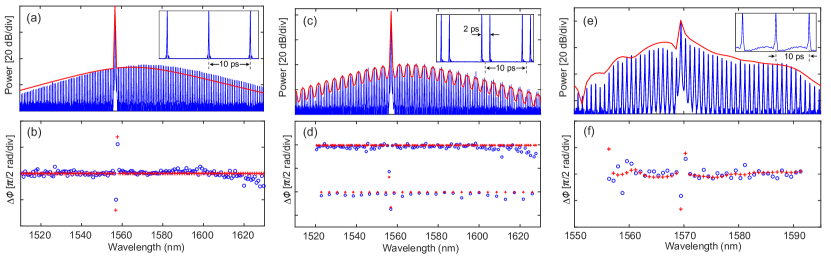
The measurement results (blue) validated with the simulations for three different microcomb states are illustrated in Fig. 2. The spectrum of the single FSR soliton comb at a pump wavelength 1557.147 nm with on-chip power dBm is shown in Fig. 2(a). The power at the blue side edge of the spectrum is dBm. The spectrum is blue-detuned by 1.7 THz relative to the soliton spectral maximum due to the Raman self-frequency shift [28]. The RF clock to the PM was set to 24.58 GHz, yielding GHz spacing between second-order sideband from the adjacent modes. The spectral phase difference after correcting the setup dispersion is shown in Fig. 2(b). The phase difference at the pump location is shifted approximately by 0.5.
Figure 2(c) shows the simulated (red) and measured (blue) spectral profile of a multisoliton comb. The frequency comb has a repetition rate of 99.9011 GHz. It has a spectral modulation where one comb line in every five becomes attenuated. This 5 FSR modulation in the comb envelope indicates two intracavity pulses of relative time difference 2 ps (Fig. 2(c) inset). The of the comb line pairs are aligned, except for the weaker comb lines which have a relative phase difference of (Fig. 2(d)). At the pump location, it has also as in the single cavity microcomb. The discrepancy between simulation (red) and measurement (blue) is likely due to uncertainties in the Raman coefficient in silicon nitride and the fact that our simulations do not include a wavelength dependent coupling coefficient. The phase difference is deviating from the simulated trend beyond 1600 nm wavelength (Fig. 2 (b,d)). It may be related to the wavelength dependent power coupling.
The microcomb coming out of the photonic molecule is shown in Fig. 2(e). The comb spectrum was acquired from the power coupled out of the bus waveguide. The cavity was pumped at 1569.67 nm with an on-chip optical power of 13 dBm. The microcomb has a repetition rate of 100.799 GHz. Unlike the flat in the single cavity microcomb, the coupled cavity microcomb has non-uniform (Fig. 2 (f)). The equivalent pulse coupled out of the cavity is shown in the inset of Fig. 2(e). The waveform of the coupled cavity microcomb is not transfer-limited. Indeed, it is a chirped pulse with asymmetric damping oscillation at both sides of the pulse (Fig. 2(e) inset) in line with the measurements and predictions of [7].
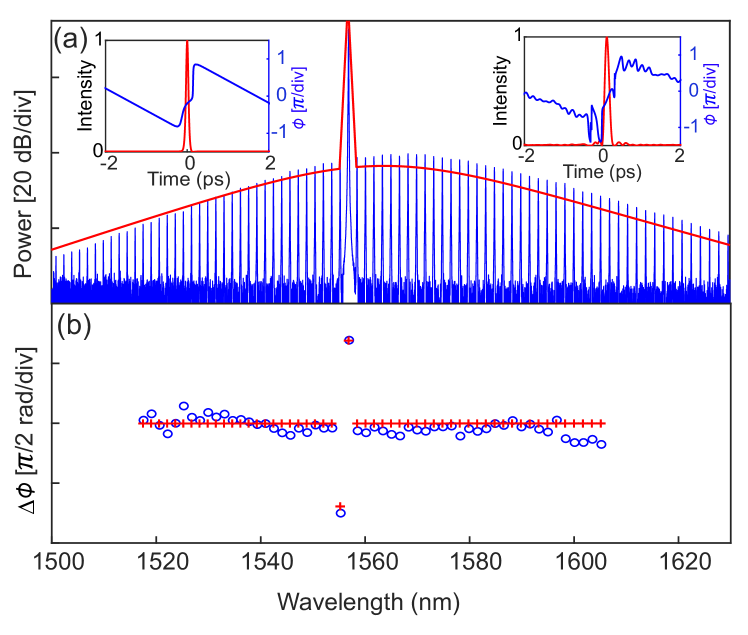
The proposed technique is in principle not limited by the repetition rate of the comb. Figure 3 demonstrates the characterization of a 2-FSR comb having 199.7843 GHz comb spacing. The RF frequency and modulation depth of the PM was adjusted such that the sidebands at the center are stronger and within the detectable frequency range. In this measurement, we increased the 24.78 GHz RF power applied to the PM. This in turn generates higher-order sidebands. For the heterodyning, we optimized the 4th order sideband from the neighbouring comb modes. Figure 3(b) is the calculated differential phase of the 2-FSR comb. The accuracy of the measured differential phase values is estimated to 0.2 rad, and the resulting phase error can thus be expected to grow as 0.2 times the square root of the number of summed differential phases. The reconstructed temporal intensity and phase profiles in Fig. 3(a) insets shows good agreement between simulation (left) and measurement (right).
In summary, we have demonstrated broadband complex spectral characterization of microcombs using stepped heterodyne interferometry combined with electro-optic downconversion. It requires no optical amplifier to boost the comb lines power, which allows for retrieving comb states over a bandwidth nm, only limited by the tuning range of the stepped lasers. The technique is linear and can also measure the phase difference of extremely weak power lines. We have validated the technique with a number of microcomb states produced in silicon nitride microresonators.
This project is financially supported by the Horizon 2020 Framework Programme (GA 812818), the Swedish Foundation for Strategic Research (FID16-0011), the European Research Council (GA 771410 DarkComb), and Vetenskapsrådet (2016-03960, 2016-06077, 2020-00453).
References
- Pasquazi et al. [2018] A. Pasquazi, M. Peccianti, L. Razzari, D. J. Moss, S. Coen, M. Erkintalo, Y. K. Chembo, T. Hansson, S. Wabnitz, P. Del’Haye, X. Xue, A. M. Weiner, and R. Morandotti, Micro-combs: A novel generation of optical sources, Physics Reports 729, 1 (2018).
- Herr et al. [2014] T. Herr, V. Brasch, J. D. Jost, C. Y. Wang, N. M. Kondratiev, M. L. Gorodetsky, and T. J. Kippenberg, Temporal solitons in optical microresonators, Nature Photonics 8, 145 (2014).
- Qi et al. [2019] Z. Qi, S. Wang, J. Jaramillo-Villegas, M. Qi, A. M. Weiner, G. D’Aguanno, T. F. Carruthers, and C. R. Menyuk, Dissipative cnoidal waves (turing rolls) and the soliton limit in microring resonators, Optica 6, 1220 (2019).
- Xue et al. [2015] X. Xue, Y. Xuan, Y. Liu, P.-H. Wang, S. Chen, J. Wang, D. E. Leaird, M. Qi, and A. M. Weiner, Mode-locked dark pulse kerr combs in normal-dispersion microresonators, Nature Photonics 9, 594 (2015).
- Cole et al. [2017] D. C. Cole, E. S. Lamb, P. Del’Haye, S. A. Diddams, and S. B. Papp, Soliton crystals in kerr resonators, Nature Photonics 11, 671 (2017).
- Brasch et al. [2016] V. Brasch, M. Geiselmann, T. Herr, G. Lihachev, M. H. Pfeiffer, M. L. Gorodetsky, and T. J. Kippenberg, Photonic chip–based optical frequency comb using soliton cherenkov radiation, Science 351, 357 (2016).
- Helgason et al. [2021] Ó. B. Helgason, F. R. Arteaga-Sierra, Z. Ye, K. Twayana, P. A. Andrekson, M. Karlsson, J. Schröder, and V. Torres-Company, Dissipative solitons in photonic molecules, Nature Photonics 15, 305 (2021).
- Tikan et al. [2021] A. Tikan, J. Riemensberger, K. Komagata, S. Hönl, M. Churaev, C. Skehan, H. Guo, R. N. Wang, J. Liu, P. Seidler, and T. J. Kippenberg, Emergent nonlinear phenomena in a driven dissipative photonic dimer, Nature Physics 17, 604 (2021).
- Trebino et al. [1997] R. Trebino, K. W. DeLong, D. N. Fittinghoff, J. N. Sweetser, M. A. Krumbügel, B. A. Richman, and D. J. Kane, Measuring ultrashort laser pulses in the time-frequency domain using frequency-resolved optical gating, Review of Scientific Instruments 68, 3277 (1997).
- Ferdous et al. [2011] F. Ferdous, H. Miao, D. E. Leaird, K. Srinivasan, J. Wang, L. Chen, L. T. Varghese, and A. M. Weiner, Spectral line-by-line pulse shaping of on-chip microresonator frequency combs, Nature Photonics 5, 770 (2011).
- Del’Haye et al. [2015] P. Del’Haye, A. Coillet, W. Loh, K. Beha, S. B. Papp, and S. A. Diddams, Phase steps and resonator detuning measurements in microresonator frequency combs, Nature Communications 6, 1 (2015).
- Kong et al. [2019] Z. Kong, C. Bao, O. E. Sandoval, B. Liu, C. Wang, J. A. Jaramillo-Villegas, M. Qi, and A. M. Weiner, Characterizing pump line phase offset of a single-soliton kerr comb by dual comb interferometry, Optics Letters 44, 1460 (2019).
- Yi et al. [2018] X. Yi, Q.-F. Yang, K. Y. Yang, and K. Vahala, Imaging soliton dynamics in optical microcavities, Nature Communications 9, 1 (2018).
- Ferdous et al. [2009] F. Ferdous, D. E. Leaird, C.-B. Huang, and A. Weiner, Dual-comb electric-field cross-correlation technique for optical arbitrary waveform characterization, Optics Letters 34, 3875 (2009).
- Durán et al. [2015] V. Durán, S. Tainta, et al., Ultrafast electrooptic dual-comb interferometry, Optics Express 23, 30557 (2015).
- Reid et al. [2010] D. Reid, S. Murdoch, and L. Barry, Stepped-heterodyne optical complex spectrum analyzer., Optics Express 18, 19724 (2010).
- Murdoch et al. [2011] S. Murdoch, R. Watts, Y. Xu, R. Maldonado-Basilio, J. Parra-Cetina, S. Latkowski, P. Landais, and L. Barry, Spectral amplitude and phase measurement of a 40 ghz free-running quantum-dash modelocked laser diode, Optics Express 19, 13628 (2011).
- Moskalenko et al. [2014] V. Moskalenko, S. Latkowski, S. Tahvili, T. de Vries, M. Smit, and E. Bente, Record bandwidth and sub-picosecond pulses from a monolithically integrated mode-locked quantum well ring laser, Optics Express 22, 28865 (2014).
- Szafraniec and Baney [2004] B. Szafraniec and D. M. Baney, Swept coherent spectrum analysis of the complex optical field, in Proceedings of the Lightwave Technologies in Instrumentation and Measurement Conference, 2004. (IEEE, 2004) pp. 68–72.
- Del’Haye et al. [2012] P. Del’Haye, S. B. Papp, and S. A. Diddams, Hybrid electro-optically modulated microcombs, Phys. Rev. Lett. 109, 263901 (2012).
- Zhang et al. [2019] S. Zhang, J. M. Silver, X. Shang, L. Del Bino, N. M. Ridler, and P. Del’Haye, Terahertz wave generation using a soliton microcomb, Opt. Express 27, 35257 (2019).
- Wen et al. [2016] Y. H. Wen, M. R. Lamont, S. H. Strogatz, and A. L. Gaeta, Self-organization in kerr-cavity-soliton formation in parametric frequency combs, Physical Review A 94, 063843 (2016).
- Wang et al. [2016] P.-H. Wang, J. A. Jaramillo-Villegas, Y. Xuan, X. Xue, C. Bao, D. E. Leaird, M. Qi, and A. M. Weiner, Intracavity characterization of micro-comb generation in the single-soliton regime, Optics Express 24, 10890 (2016).
- Twayana et al. [2021] K. Twayana, Z. Ye, Ó. B. Helgason, K. Vijayan, M. Karlsson, and V. Torres-Company, Frequency-comb-calibrated swept-wavelength interferometry, Optics Express 29, 24363 (2021).
- Ye et al. [2019] Z. Ye, K. Twayana, P. A. Andrekson, and V. Torres-Company, High-Q microresonators based on a subtractive processing for kerr nonlinear optics, Optics Express 27, 35719 (2019).
- Joshi et al. [2016] C. Joshi, J. K. Jang, K. Luke, X. Ji, S. A. Miller, A. Klenner, Y. Okawachi, M. Lipson, and A. L. Gaeta, Thermally controlled comb generation and soliton modelocking in microresonators, Opt. Lett. 41, 2565 (2016).
- Guo et al. [2017] H. Guo, M. Karpov, E. Lucas, A. Kordts, M. H. Pfeiffer, V. Brasch, G. Lihachev, V. E. Lobanov, M. L. Gorodetsky, and T. J. Kippenberg, Universal dynamics and deterministic switching of dissipative kerr solitons in optical microresonators, Nature Physics 13, 94 (2017).
- Yi et al. [2016] X. Yi, Q.-F. Yang, K. Y. Yang, and K. Vahala, Theory and measurement of the soliton self-frequency shift and efficiency in optical microcavities, Optics Letters 41, 3419 (2016).