DEXTER: An end-to-end system to extract table contents from electronic medical health documents
Abstract
In this paper, we propose , an end to end system to extract information from tables present in medical health documents, such as electronic health records (EHR) and explanation of benefits (EOB). consists of four sub-system stages:- i) table detection ii) table type classification iii) cell detection; and iv) cell content extraction. We propose a two-stage transfer learning-based approach using CDeC-Net architecture along with Non-Maximal suppression for table detection. We design a conventional computer vision-based approach for table type classification and cell detection using parameterized kernels based on image size for detecting rows and columns. Finally, we extract the text from the detected cells using pre-existing OCR engine Tessaract. To evaluate our system, we manually annotated a sample of the real-world medical dataset (referred to as ) consisting of wide variations of documents (in terms of appearance) covering different table structures, such as bordered, partially bordered, borderless, or coloured tables. We experimentally show that outperforms the commercially available Amazon Textract and Microsoft Azure Form Recognizer systems on the annotated real-world medical dataset.
Keywords:
Electronic Health RecordsEHR Explanation of Benefits EOB Revenue Cycle Management Table Detection Cell Detection Table Type Classification Content Extraction RCM1 Introduction
With the adoption of electronic data in the healthcare space, there is an increase in demand to find the best ways to extract relevant information from the documents to help various stakeholders, such as doctors, patients, hospitals, and insurance companies.
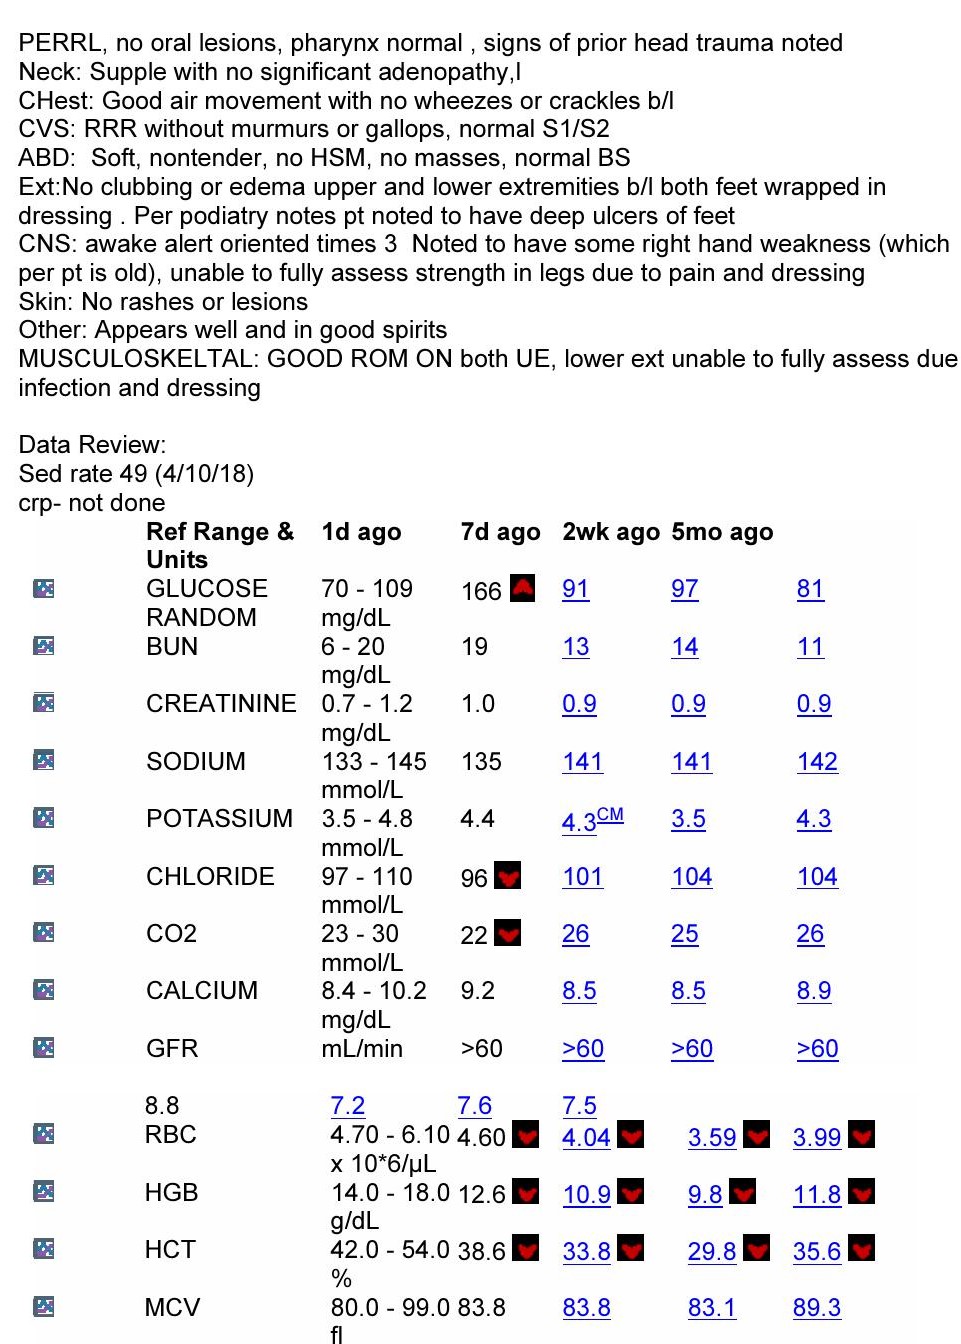
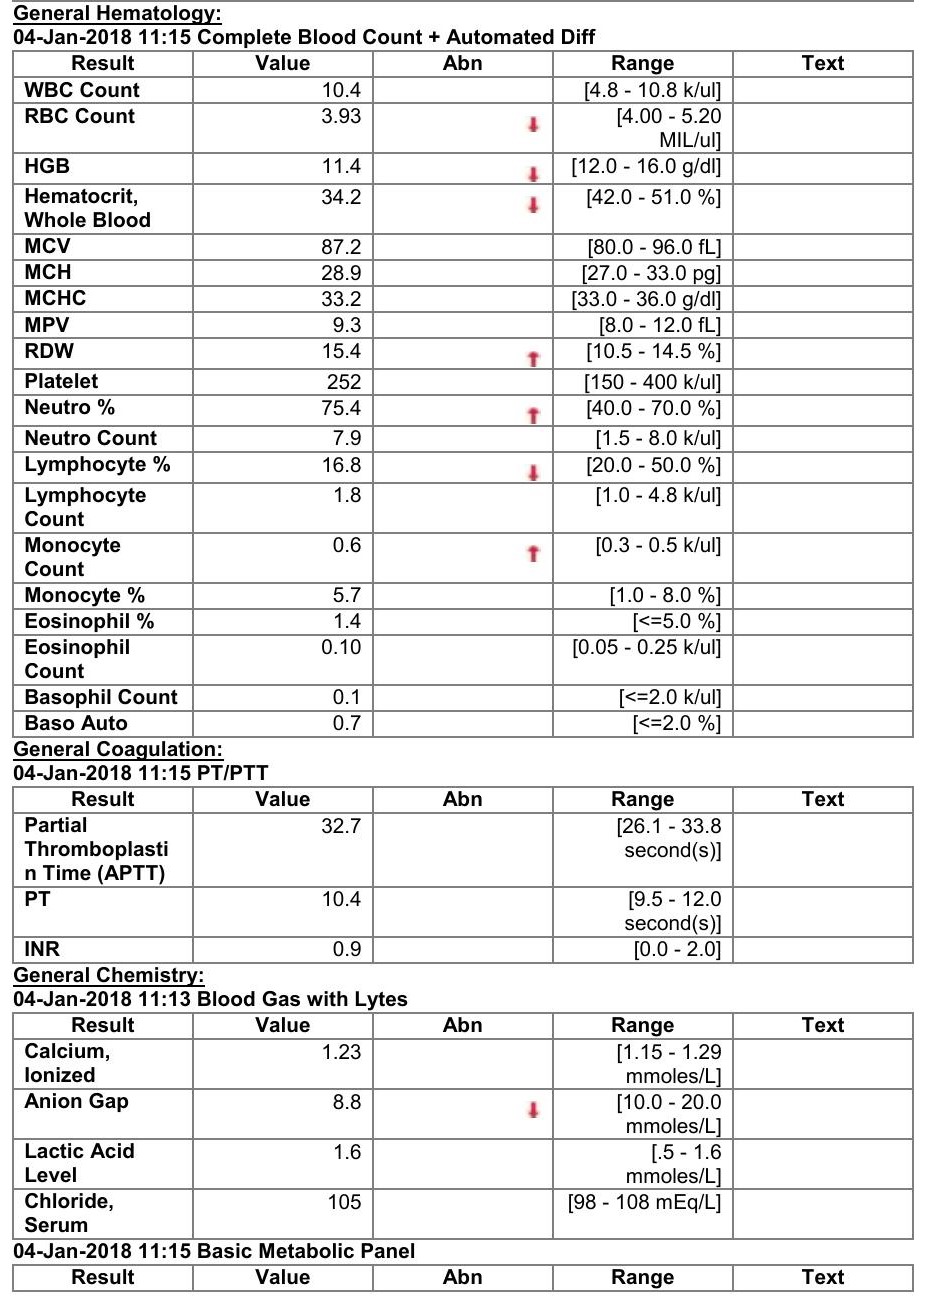
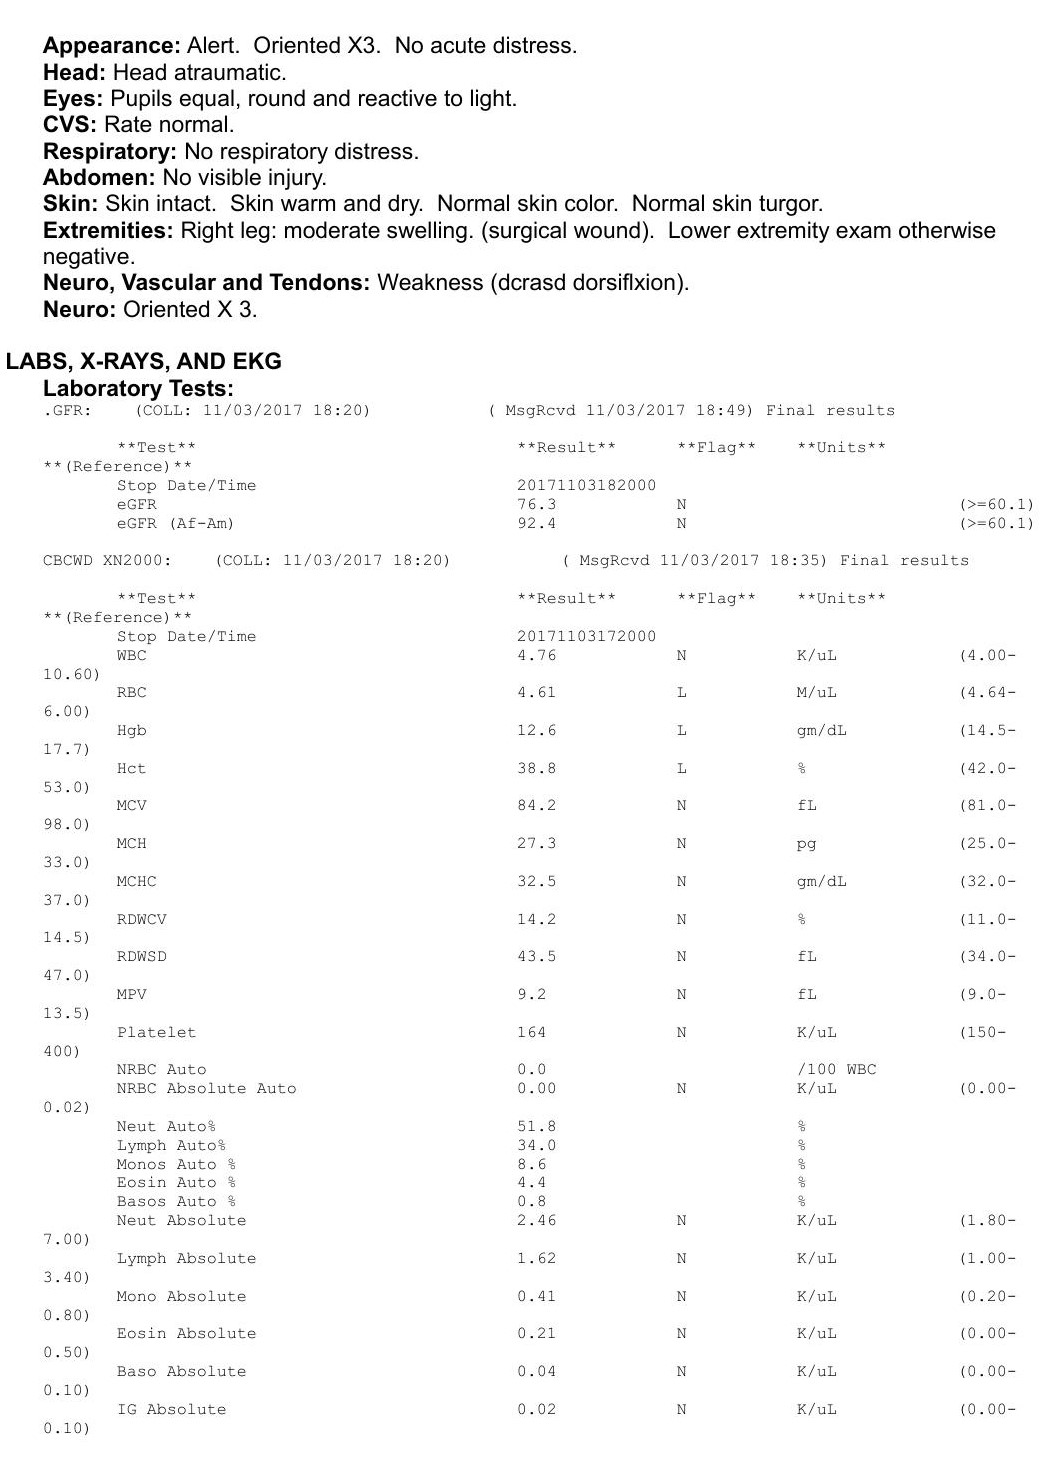
Apart from text, the tables present in electronic health records (EHRs) contain useful information like clinical analysis and laboratory results which are useful for research, medical investigations, clinical support system, and quality improvement.
In this paper, we propose an end-to-end system named as (Document Extractor) which automatically extracts the data from tables present in medical documents.
Related Work.
In the literature, many studies have been conducted to address the challenges in content extraction from tables present in documents.
Most of the proposed approaches can be categorized into two groups depending on the type of algorithms used to deal with the problem.
Computer-vision based approaches [8, 5, 19, 1] mainly focus on detecting lines or white patches between rows or columns in tables.
Kasar et al. [8] trained an SVM classifier using lines present in the scanned documents to classify table regions.
However, the proposed method is only applicable to bordered or partially-bordered tables.
Ghanmi et al. [5] designed an algorithm to detect lines from bordered tables.
However, for the documents containing borderless tables, the proposed approach relies on finding out the inherent syntax of the table’s content.
Given the wide variations in the appearance of medical documents, it is impossible to find the content based syntax for all kinds of documents.
Shi et al. [19] identified table candidates from a fixed list of table models represented by a matrix of horizontal and vertical lines.
For medical documents, Adamo et al. [1] proposed a conventional image processing based method to detect tables from laboratory reports which had fixed document structure.
However, in this work, we are interested in developing a generic system applicable to a wide range of medical documents and table structures.
With the surge in deep learning, various CNN based architectures [6, 7, 10, 15, 18, 16, 22] have been proposed for table detection and cell extraction. Hao et al. [7] used a combination of heuristic rules with the CNN model to determine table-like structures and classify them into table or non-table regions. Schreiber et al. [18] proposed the deep transfer learning-based algorithm DeepDeSRT for table detection and table structure recognition. Concretely, DeepDeSRT fine-tunes a pre-trained Faster RCNN model[17] and FCN segmentation model [12] for table detection and table structure recognition, respectively. Li et al. [10] used Faster R-CNN with ResNeXt[21] as the backbone architecture for table detection. Recently, Prasad et al.[16] designed an end to end approach, CascadeTabNet, using a single CNN model (utilizing iterative transfer learning) for both table detection and table segmentation. For medical laboratory reports, Xue et al. [22] proposed end-to-end system for table detection and information extraction from laboratory reports using a CNN-based model. However, the proposed approach is only applicable to a fixed variety of documents, i.e. laboratory reports with a fixed structure and with fixed number of tables. Whereas in medical domain, it is common to have a wide variety of documents with different tabular layouts and structures (bordered, partially bordered, borderless or coloured tables). Therefore, our objective is to design a generic end to end system that can extract content from the tables present in medical documents. Amazon’s Textract111https://aws.amazon.com/textract/ and Microsoft’s Form Recognizer222https://azure.microsoft.com/en-in/services/cognitive-services/form-recognizer/ are generic end to end commercial pipelines for information extraction from tables in a given document.

In our work, we empirically compare our system with Amazon’s Textract and Microsoft’s Form Recognizer.
Contribution. We propose an end to end system, (Document Extractor), which automatically extract the content from tables for any given input medical document, as shown in Figure 1.
For any given input document, System uses i) two-stage transfer learning using CDecNet [2] architecture along with Non Maximal Suppression (NMS)[13] for table detection; ii) a conventional computer vision based approaches for table type classifier and cell detection in table; and iii) finally from detected cells, we can use any OCR engine to extract information from the cells and return the output in JSON format.
To evaluate the proposed system, due to the unavailability of medical data, we have curated a real-world medical dataset (referred as 333We will release the dataset to the research community.) consisting of real world medical documents with wide variations in appearance and different tabular structures (bordered, partially bordered, borderless and coloured tables).
We experimentally demonstrate that, compared to the existing state-of-art approaches (FR-RNX-101[21] and CascadeTabNet[16]), CDeC-Net performs significantly better on real-world medical dataset and has better generalization abilities.
Therefore, for table detection in medical documents, we propose to use CDeC-Net architecture, which consists of cascade Mask R-CNN[3] with ResNeXt-101 dual backbone having deformable convolution, to detect tables present in the documents.
After initializing the network with MS COCO weights, we fine-tune it on TableBank dataset [10] in stage 1, followed by fine-tuning on dataset in stage 2.
Finally, to select a single table prediction from multiple overlapping predictions, we used Non Maximal Suppression (NMS)[13] approach.
We experimentally show that the two-stage deep transfer learning using CDeC-Net combined with NMS approach is an effective strategy to deal with table detection problem in medical datasets.
The proposed method performs significantly better than Amazon’s Textract and Microsoft’s Form Recognizer tools.
Instead of choosing complex deep learning based approaches, following Occam’s Razor principle, we designed simple computer vision based approaches for table type classifier and cell detection.
For the table type classifier, we propose to use parameterized horizontal and vertical kernels (based on image size) for line detection. Based on the detected lines and colour of the image, we classify tables into four categories: bordered, partially-bordered, borderless and coloured tables.
For cell detection in borderless and partially bordered tables, we propose to find vertical and horizontal column separators (or in other words, white patches) using parameterized kernels (based on the size of the image).
Compared to Amazon’s Textract and Microsoft’s Form Recognizer systems, our proposed method performs significantly better on the medical dataset .
Moreover, we performed root cause analysis for the lower performance of existing systems on the medical dataset.
We found out experimentally that the existing systems are not robust against the borderless tables, which is the common use-case in medical documents.
Paper Organization. In the next section, we present the proposed System. Before concluding in Section 4, we present the obtained experimental
results using our approach in Section 3.
2 The Proposed System
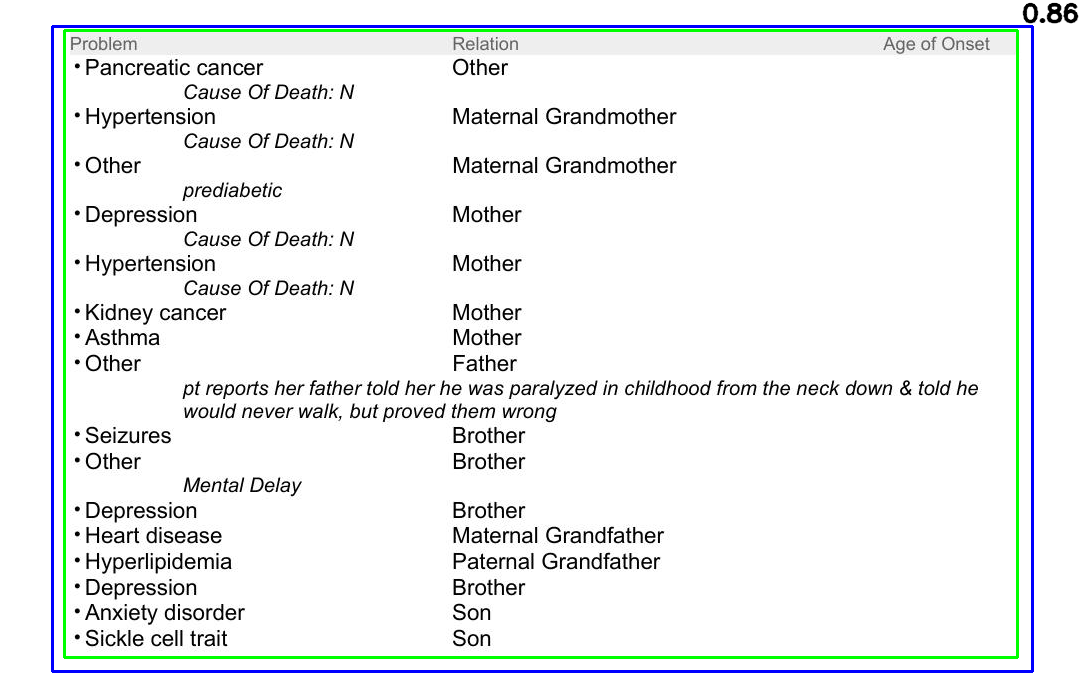
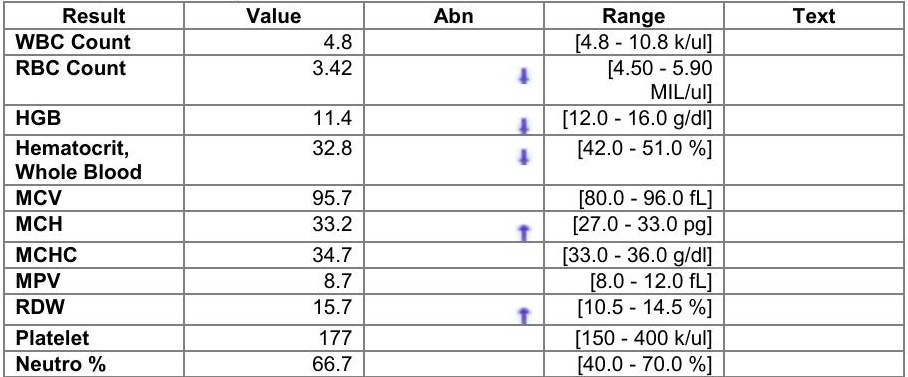
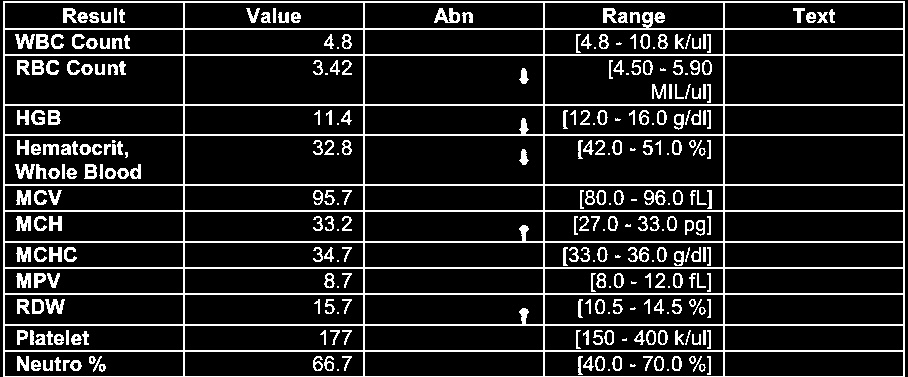
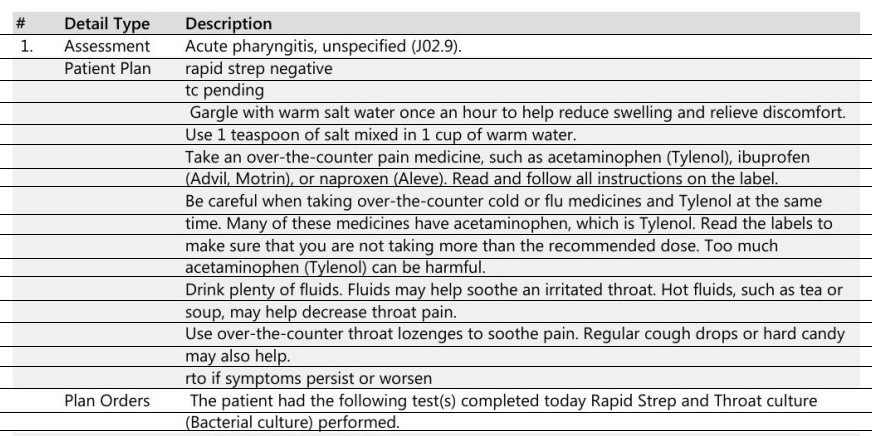
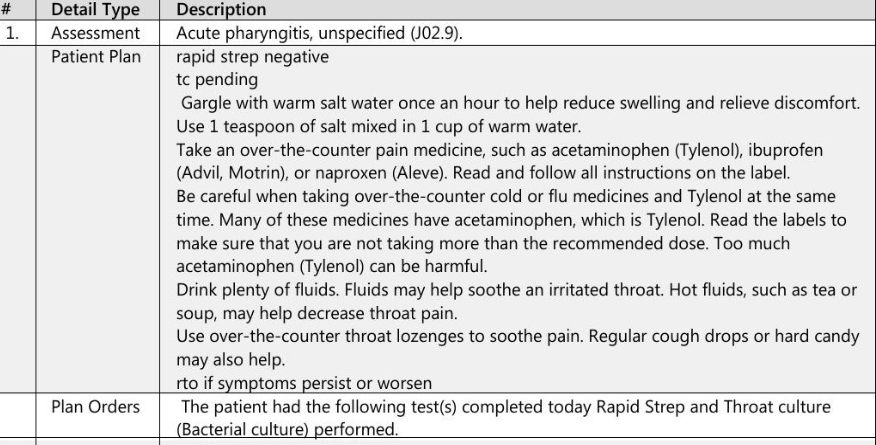
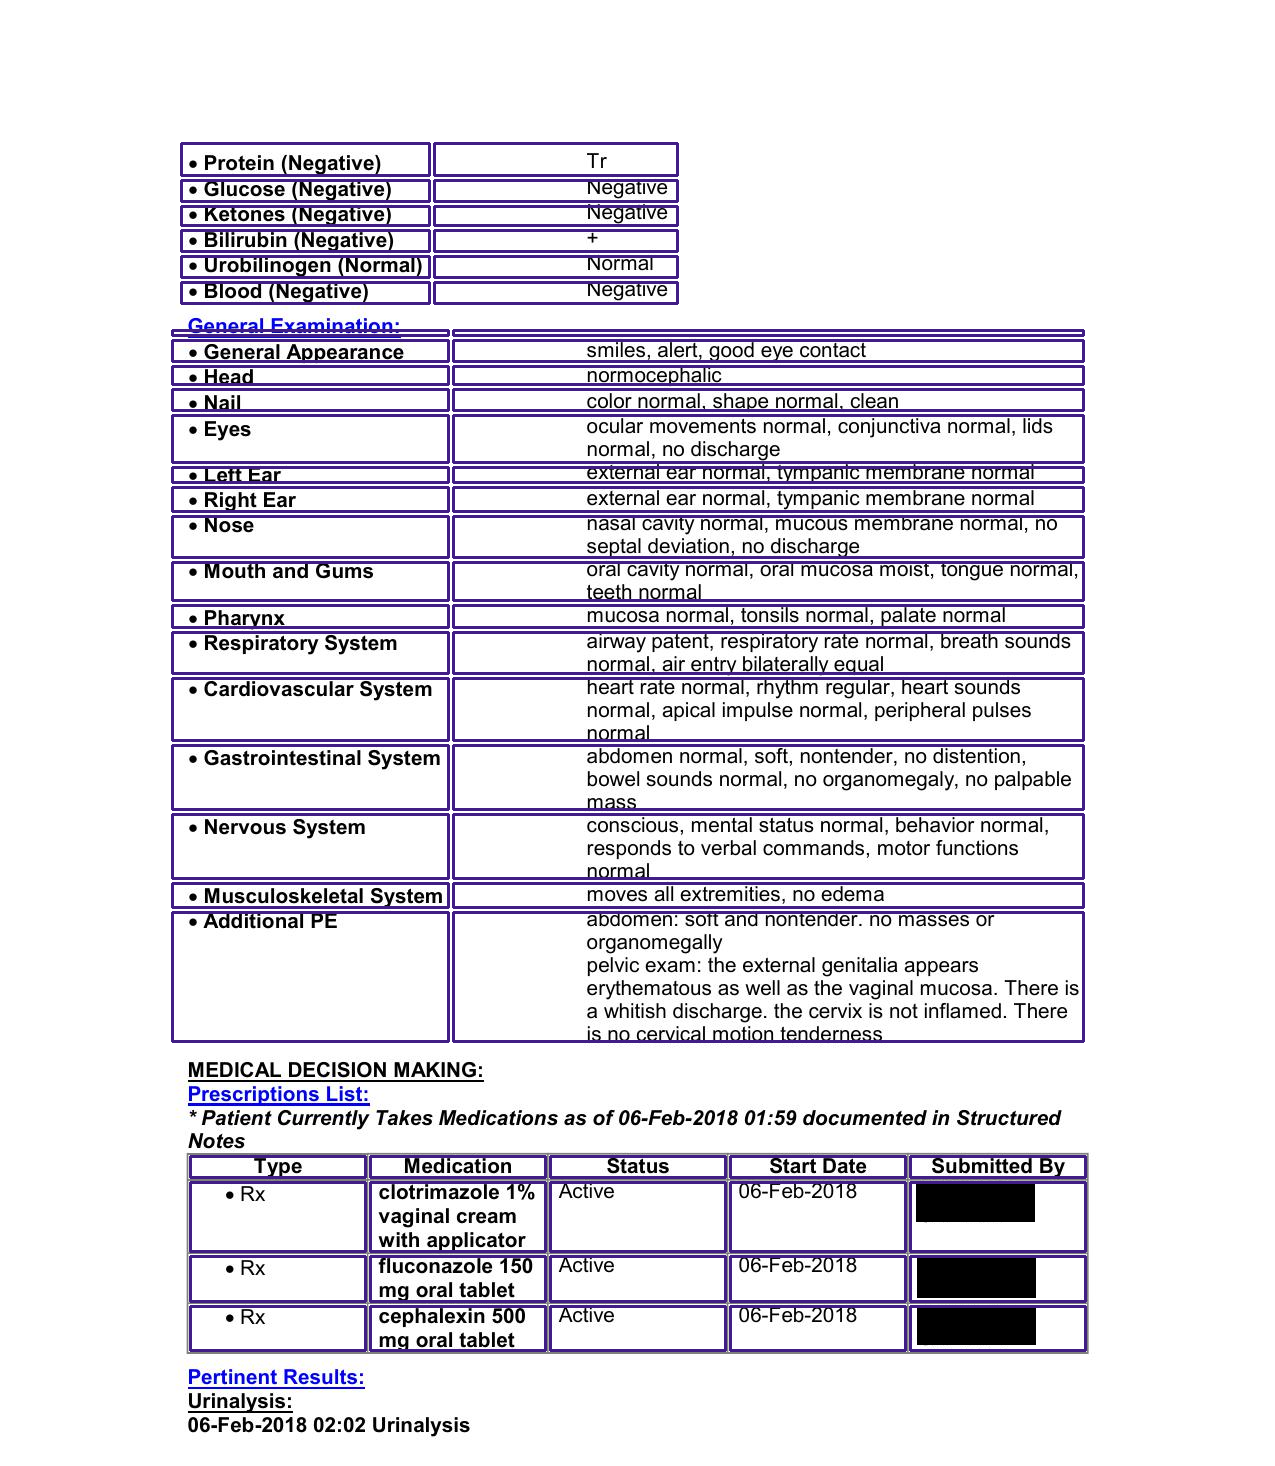
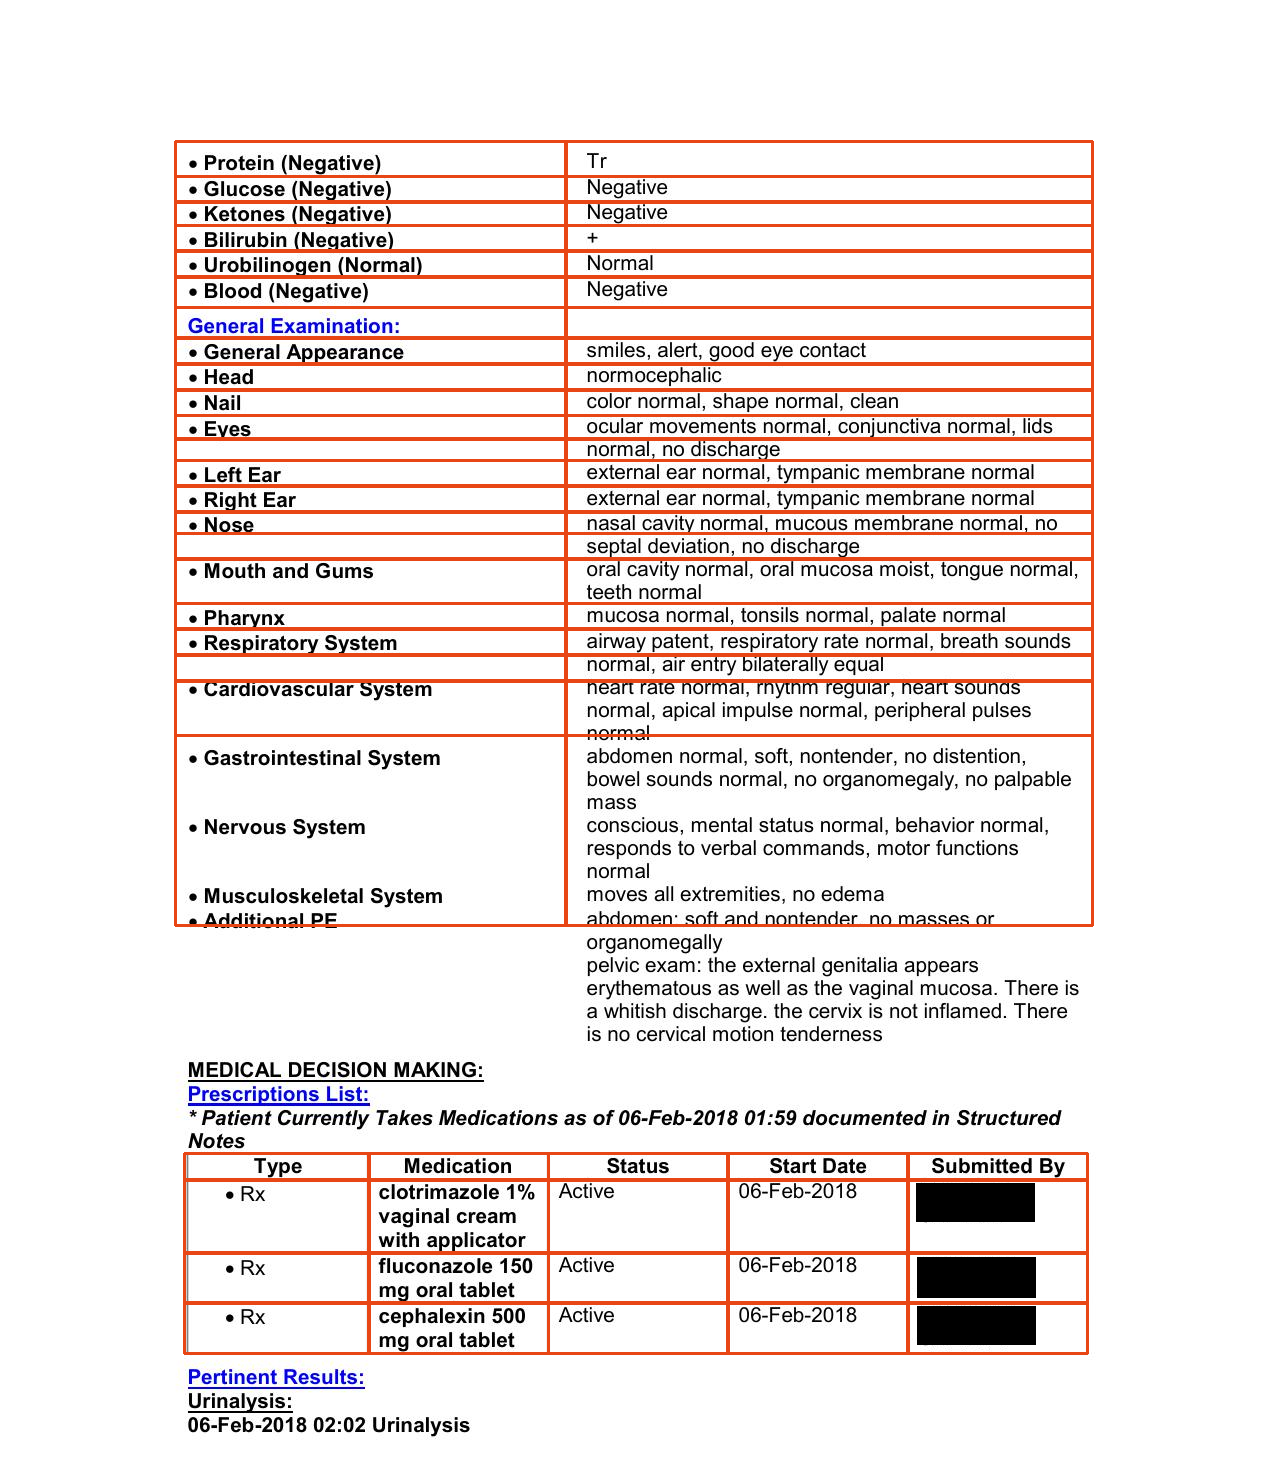
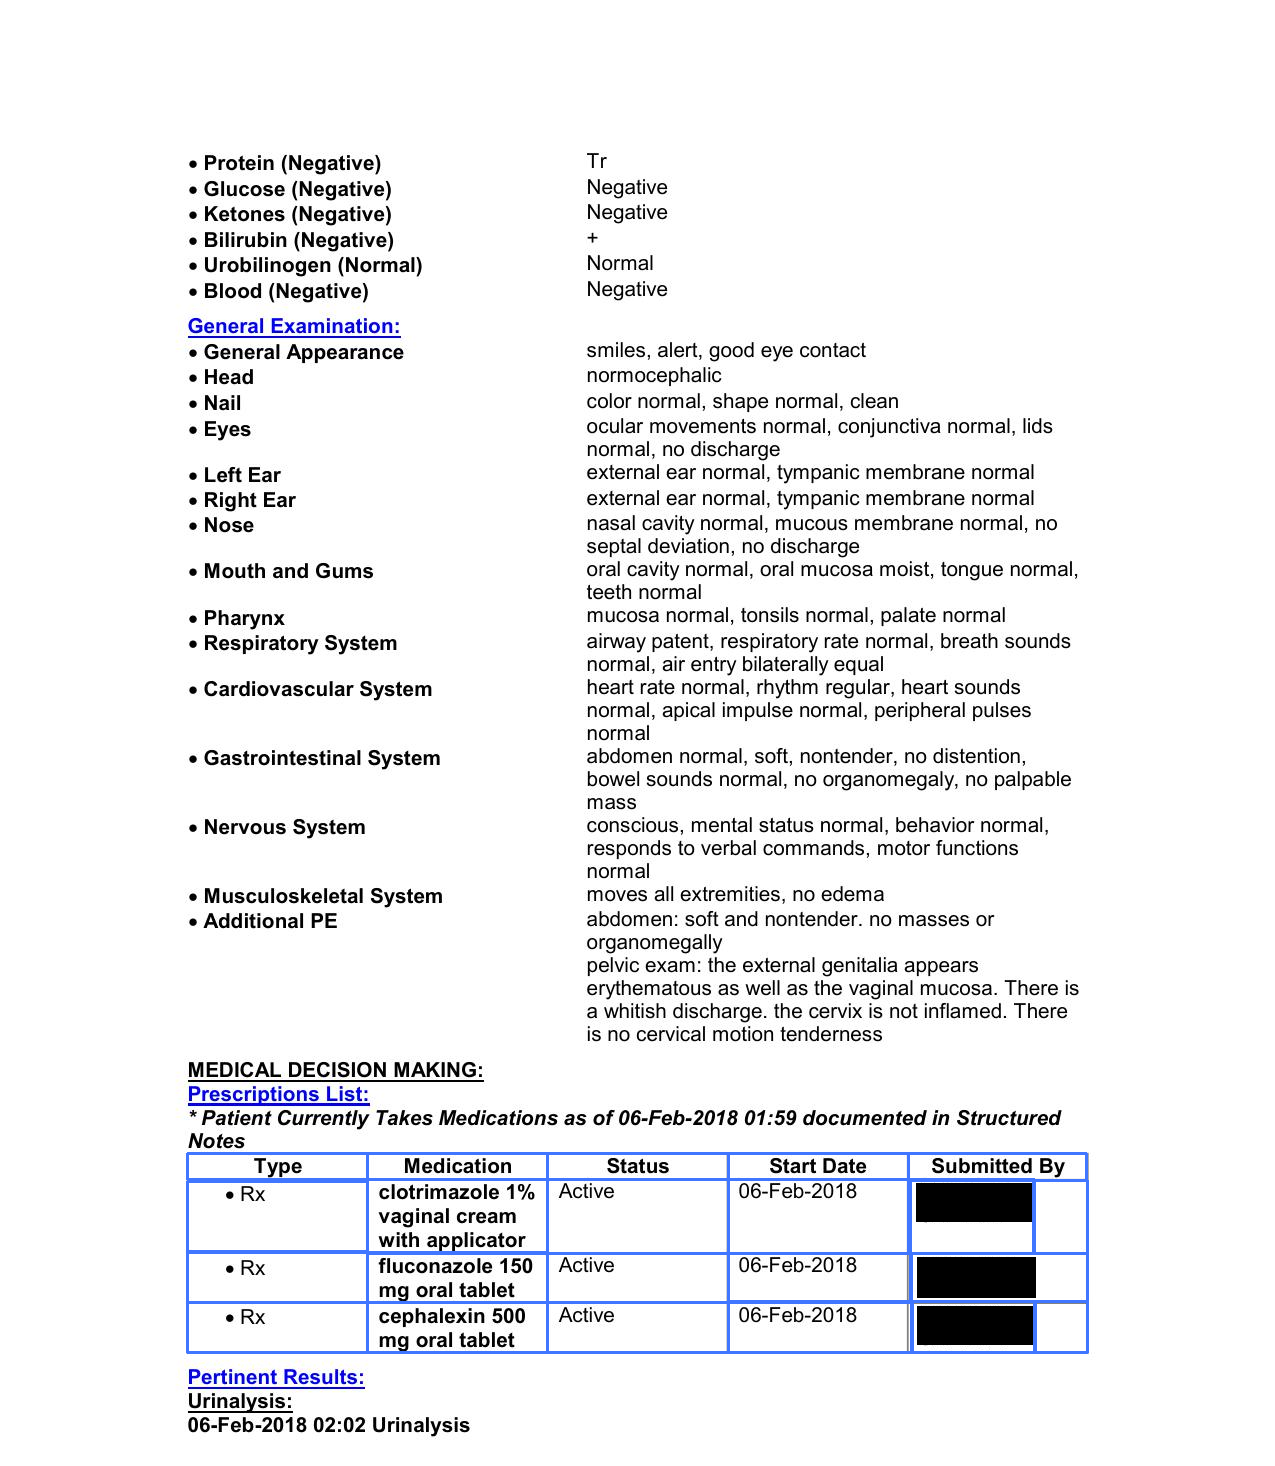
Different types of documents are encountered in the medical domain, and a few of these include diagnostic reports, discharge summary, prescription, case sheets, investigation reports and blood test reports. These documents have varied layouts and table structures, as shown in Figure 2. To the best of our knowledge, existing systems for extracting content from tables do not generalize well across wide variations of documents in the medical domain.
In our work, we design a generic end to end system, referred as , which extracts content from varied table structures present in electronic health documents. For any given input medical document image , the system’s objective is to return the content present in the document’s tables in JSON format (as shown in Figure 1). The table detection module returns co-ordinates for the detected table, , along with the prediction confidence. For the detected table, the table type classifier returns the table type with output space defined as . Based on the predictions of the table type classifier, the cell detection module returns the list of co-ordinates for detected cells within the table. Finally, we use the existing OCR engine Tesseract[20] to extract the content of detected cells in tables. In the next sections, we present each of these sub-modules in details.
2.1 Table Detection
In this section, we present a two-stage transfer learning approach using CDeC-Net [2] combined with Non Maximal Suppression (NMS)[13] for detecting tables (bordered, partially bordered or borderless) in wide variations of the documents for the medical domain.
While dealing with table detection in medical documents, we face three major challenges. Firstly, we have wide variations of document structures (diagnostic reports, discharge summary, etc. ) and tables types (as shown in the Figure 2). Therefore, we need to have an approach that can be generalized to different variations and structures of documents. Secondly, it is common to have tables at different scales in medical documents. Lastly, it is important to select a single table prediction from a set of falsely predicted sub-tables from an image (as shown in the left image of Figure 3).
To handle the first two challenges, we propose to use two stage transfer learning using CDeC-Net architecture. Concretely, we initialize the network with MS COCO weights followed by fine-tuning the network on TableBank and curated respectively. CDeC-Net architecture uses a dual backbone, one the assistant and the other, the lead, with composite connections between the two, forming a robust backbone. Here, the high-level features learnt from the assistant backbone are fed as an input to the lead backbone. This powerful backbone helps us to handle the wide variations of documents and increase the performance of the object detector. Moreover, we also show experimentally, in Section 3, that the CDeC-Net architecture has better generalization ability compared to other approaches (FR-RNX-101[21] and CascadeTabNet[16]). Also, to have scale-invariant table detection, CDeC-Net uses deformable CNNs that ensures that the receptive field is adaptive according to the scale of the object, thus ensuring that tables at all scales are captured correctly.
As shown in Figure 3 for CDeC-Net predictions, it is often possible to have multiple false sub-tables within a single tabular structure. Therefore, we propose to apply Non Maximal Suppression(NMS) technique. Concretely, NMS first selects the prediction having the highest confidence. It then computes the intersection over Union (IoU) of the selected prediction with every other prediction and discards those having IoU greater than a given threshold. Since tables don’t overlap each other, we set the threshold to . This is done recursively until all predictions in the image are covered.
2.2 Table Type Classifier
Table type classifier is an integral sub-module of pipeline because the processing steps for downstream tasks (cell detection and cell content extraction) depend on the type of table (bordered, borderless, partial bordered, coloured).
Following Occam’s Razor Principle, instead of choosing deep learning based approach, we designed a computer vision based method for table type classification. Concretely, we designed parameterized horizontal and vertical kernels to detect lines in a given table image. We classify the tables into three different categories based on the detected lines: bordered, borderless and partially bordered.
2.2.1 Parameterized Horizontal and Vertical Kernels.
As the first step, for any given input table image , we apply Otsu’s thresholding to the and invert the result to obtain as shown in Figure4(b), which contains 1s for text region and 0s for the background region.

Instead of using fixed-sized kernels, we designed horizontal () and vertical () kernels parameterized on size of the defined as follows:
| (1) |
| (2) |
where, and are hyper-parameters kernel width and kernel height. Finally, we generate an image containing horizontal lines (Figure 4(c)) and vertical lines (Figure 4(d)) as follows:
| (3) |
| (4) |
where and are erosion and dilation operations respectively. Then, we apply hough line transform to find the number of horizontal lines () and vertical lines () from and respectively. In case we have both and equals to 0, then it is a borderless table. Finally, depending on the presence of outer borders and intersection of horizontal and vertical lines we classify tables into two categories: bordered or partially bordered. If both outer borders and row column intersections exist, then it is bordered table, otherwise, it is a partially bordered table.
2.2.2 Determining presence of outer borders.
We locate the top-left foreground black pixel (, ) and top-right foreground black pixel (, ). If there is a line with co-ordinates ((, ), (, )) in (Equation 3), then it indicates a top border. Similarly, we check the presence of bottom, left and right borders.
2.2.3 Determining row-column intersections.
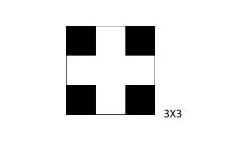
To find the row-column intersections, we define a kernel as (shown in figure 4(f)):
| (5) |
We use the Hit-or-Miss Transform [9], to find if this kernel exists in the image defined as:
| (6) |
where is bitwise OR operation on images. A single occurrence of signifies the presence of row-column intersection.
(shown in Figure 4(e)) is obtained by adding the images and . A single occurrence of in image denotes the position of a row separator intersecting with a column separator.
2.2.4 Coloured table detection.
In coloured tables, the count of foreground pixels is much higher than the count of background pixels. Therefore, we compute the ratio of the second highest and highest intensities from histogram () of grayscale table image . If the ratio is higher than a certain threshold , then it is classified as the coloured table.
2.3 Table Cell Detection
In this section, we present a computer vision based approach to detect cells depending upon the type of table. For bordered tables, we can easily find contours from image (Equation (6)), which corresponds to cell regions in the table. However, for partially bordered tables, we propose to first remove the existing borders, followed by the identification of row and column separators. Similarly, for borderless tables, we can directly identify row and column separators. After identifying row-column separators, we follow the same strategy for bordered tables to identify cells in partially bordered and borderless tables.


2.3.1 Identifying Row and Column Separators.
There are two challenges while identifying row and column separators in borderless tables: i) locating horizontal and vertical white patches in the table and ii) handling rows which span over multiple lines of text (common in medical documents).
To handle the first challenge, we propose to use the parameterized kernels for identifying white patches in the table image . As the first step, we apply Otsu’s thresholding to the original table image which outputs an image where 0s denote foreground pixels, and 1s denote background pixels. For identifying vertical white patches, we define the vertical slider kernel as follows:
| (7) |
where denotes the height of table and is a hyper-parameter computed based on the width and height of image . Finally, we convolve the above kernel with Otsu table image as follows (see figure 5(b)):
| (8) |
where represents convolution operation. Similarly, to find the horizontal white patches in otsu’s tab image , we define the horizontal slider kernel as follows:
| (9) |
where denotes the width of table. Finally, we convolve the above kernel with Otsu table image as follows (see figure 5(c)):
| (10) |
Finally, we draw row and column separators at the middle of the white patches in vertically and horizontally convolved images and (see figures 5(d) and 5(e)).
To solve the second challenge (rows spanning multiple lines), it is necessary to refine the row separators in (Equation 10).
We propose to use the information about the number of filled cells in a given row.
For any row in the table image, if the number of filled cells is less than the threshold we remove the row separator corresponding to that row (see figure 5(f)).
2.4 Table Cell Content Extraction
Table Cell content extraction can be facilitated using any OCR engine such as Tesseract, Abby, Microsoft Azure, etc. Note that, instead of making individual OCR calls for every cell in the table, we batch all the cells in a row and make an OCR call. This approach brings down the number of OCR calls made thereby, increasing the throughput of the system.
3 Experiments
In this section, we present the empirical study to show the performance of for three sub-modules: Table Detection, Cell Detection and Cell Content Extraction. Moreover, we present the root cause analysis for better performance of system compared to Amazon Textract () and Microsoft Azure’s Form Recognizer ().
3.1 Experimental Setting
3.1.1 Data Preparation
To evaluate the performance of on the medical dataset, we have curated a real world medical dataset (referred as ) containing images from Electronics Health Records (EHR).444The Protected Health Information (PHI) has been redacted from all the samples. These EHRs include wide variations of documents like investigation reports, blood test report, and discharge summary among others.555We will release the dataset to the research community.
For any given medical image, we use the VGG Image Annotator tool [4]666http://www.robots.ox.ac.uk/~vgg/software/via/ to manually annotate the table and cell regions. We export the annotated table and cell bounding box coordinates in the COCO[11] JSON format. For cell content annotations, we pass the annotated cell bounding box to an OCR for extracting the content and save the content in CSV format after manual verification.
3.1.2 Train Test Split
For all our experiments, we reserve approximately of total images for testing and the remaining for training. The training and test images contain 1873 tables and 589 tables in total respectively. To understand the performance of the systems for different table categories, we split these tables into four different table categories as shown in Table 1, with their support count. Samples containing more than one table category, are included in the splits of all relevant table categories (to maintain uniformity).
| Table Category | Training dataset | Testing dataset |
|---|---|---|
| Bordered Tables | 249 | 163 |
| Borderless Tables | 1339 | 250 |
| Partially Bordered Tables | 261 | 53 |
| Colour Separated Tables | 24 | 123 |
| Total | 1873 | 589 |
3.1.3 Training Environment
The experiments were performed on NVIDIA GeForce RTX 2080 Ti GPU with 12 GB GPU memory, Intel(R) Core(TM) i7-5930K CPU @ 3.50GHz and 32 GB of RAM.
3.1.4 Hyper-parameter Tuning.
For the table type classifier, we experimentally tune the hyper-parameter value (Equation 1) and (Equation 2) to and respectively. For colored table classification, we tune the value to 0.25. Similarly, for table cell detection, we tune the value based on the width and the height of the table image . When the height of table is greater that its width, is set to 1. When the height is less that 360px, is set to 4. For other cases, is set to 2. For refining the row separators in , we set to be one added with half of the number of columns in the table.
3.1.5 Evaluation Metrics.
As followed in the literature[14, 2, 16, 6, 15], we use precision (P), recall (R), F1-score (F1), and mean average precision (mAP) to evaluate the performance of table detection and cell detection modules at multiple Intersection over Union (IoU) thresholds. For cell content extraction, we use the edit-distance based metric at the character level, where we quantifying how dissimilar two strings are to one another by counting the minimum number of operations required to transform one string into the other. If the edit-distance is less than a set value (0, 2 or 3), then we consider that as a correctly classified sample.
3.2 Experiment Results
3.2.1 Preliminary Analysis.
Several SOTA architectures have shown promising results to detect tables in a given image. In order to identify the best performing architecture for our use case, we design an experiment to determine two things: i) performance of the architectures on the widely used TableBank [10] dataset and ii) generalizability of the architectures on the unseen dataset.
We choose three architectures, namely, FR-RNX-101[21], CasacadeTabNet[16] and CDeC-Net[2], where CasacadeTabNet and CDeC-Net are the state of the art models for table detection, and FR-RNX-101 is the current TableBank baseline model. We initialise these architectures, with their base weights provided by the authors and then fine-tune it on the train split of the TableBank dataset [10]. Each model in Stage-1 is trained over 2 epochs. We then evaluate these three models on the test split of TableBank and datasets. From Table 2, we can see that CDeC-Net outperforms both the architectures for both TableBank and test sets, thus demonstrating better generalizability. We hence choose CDeC-Net as our base architecture. For the second stage of the two stage fine-tuning process, we take the weights of CDeC-Net trained on TableBank dataset and fine-tune on the train split of for epochs.
| Method Name | Train Dataset | Test Dataset | Avg. Score (0.5 - 0.95 IoU) | ||
| P | R | F1 | |||
| FR-RNX-101 [21] | Tablebank | Tablebank | 0.95 | 0.97 | 0.96 |
| 0.22 | 0.24 | 0.23 | |||
| CascadeTabNet[16] | Tablebank | Tablebank | 0.93 | 0.95 | 0.94 |
| 0.33 | 0.42 | 0.37 | |||
| CDeC-Net[2] | Tablebank | Tablebank | 0.96 | 0.98 | 0.97 |
| 0.40 | 0.47 | 0.43 | |||
3.2.2 Table Detection.
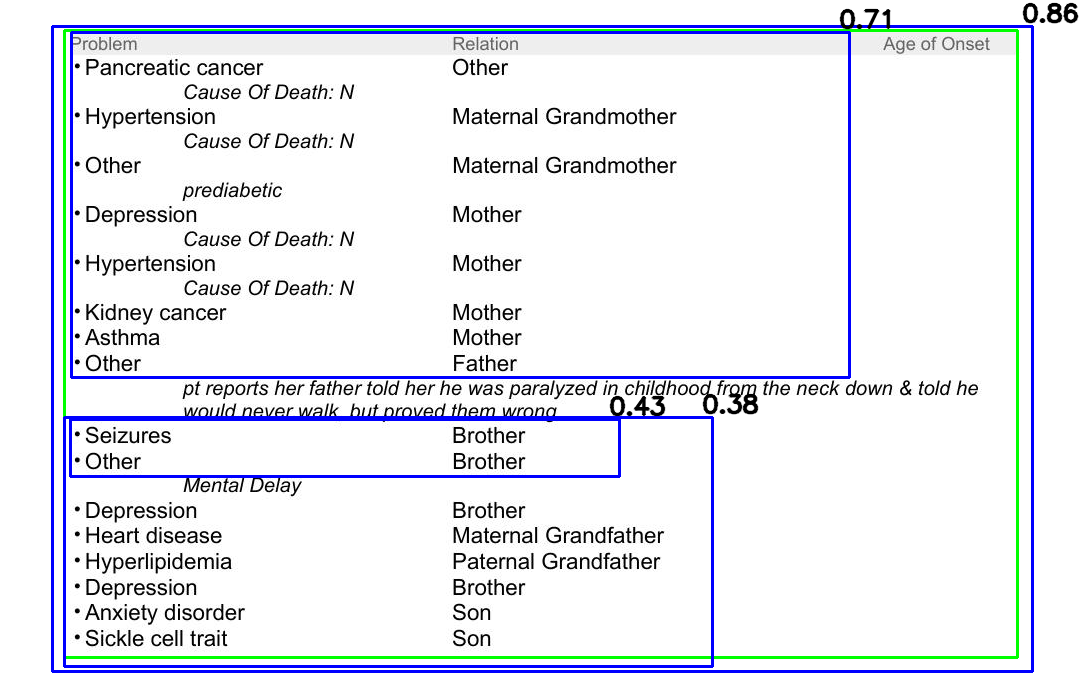
In Table 3, we present the experimental results for the table detection module. From table, we can deduce that the absolute gain in performance in terms of F1-score ranges between to at different IoU thresholds. Moreover, we can see that the proposed system is a high precision and high recall model which is important in medical document processing. Whereas, and are high precision models. This indicates that, was able to precisely capture most of the table in the medical charts, and performs well on the pages containing multiple table (as depicted in figure 6), while and find it difficult to predict all tables in a given page.
| IoU | ||||||||||||
|---|---|---|---|---|---|---|---|---|---|---|---|---|
| P | R | F1 | mAP(%) | P | R | F1 | mAP(%) | P | R | F1 | mAP(%) | |
| 0.5 | 0.88 | 0.91 | 0.9 | 89.30% | 0.88 | 0.59 | 0.71 | 57.79% | 0.97 | 0.49 | 0.65 | 47.63% |
| 0.6 | 0.88 | 0.9 | 0.89 | 87.67% | 0.86 | 0.58 | 0.69 | 55.45% | 0.95 | 0.48 | 0.64 | 45.96% |
| 0.7 | 0.85 | 0.88 | 0.86 | 84.04% | 0.82 | 0.55 | 0.66 | 52.00% | 0.91 | 0.46 | 0.61 | 42.67% |
| 0.8 | 0.8 | 0.82 | 0.81 | 76.97% | 0.75 | 0.5 | 0.6 | 45.15% | 0.82 | 0.42 | 0.55 | 35.37% |
| 0.9 | 0.69 | 0.71 | 0.7 | 61.11% | 0.57 | 0.38 | 0.46 | 30.24% | 0.59 | 0.3 | 0.4 | 20.17% |
| IoU | ||||||||||||
|---|---|---|---|---|---|---|---|---|---|---|---|---|
| P | R | F1 | mAP(%) | P | R | F1 | mAP(%) | P | R | F1 | mAP(%) | |
| 0.5 | 0.83 | 0.73 | 0.78 | 61.36% | 0.61 | 0.65 | 0.63 | 43.02% | 0.62 | 0.55 | 0.58 | 36.67% |
| 0.6 | 0.78 | 0.69 | 0.73 | 54.42% | 0.55 | 0.59 | 0.57 | 35.36% | 0.57 | 0.5 | 0.53 | 31.42% |
| 0.7 | 0.71 | 0.63 | 0.67 | 46.21% | 0.47 | 0.5 | 0.48 | 26.26% | 0.51 | 0.45 | 0.48 | 25.98% |
| 0.8 | 0.66 | 0.58 | 0.62 | 39.63% | 0.27 | 0.29 | 0.28 | 9.25% | 0.26 | 0.23 | 0.25 | 7.04% |
| 0.9 | 0.6 | 0.53 | 0.56 | 33.01% | 0.06 | 0.06 | 0.06 | 0.45% | 0.04 | 0.04 | 0.04 | 0.19% |
3.2.3 Cell Detection.
In Table 4, we present the experimental results for the cell detection module. For each of the tables predicted in the previous stage, we take the cell bounding box predictions relative to the page and compute the P, R and F1 scores at multiple IoU thresholds. We can see that the absolute gain in performance in terms of F1-score ranges between to at different IoU thresholds. There are two reasons for this significant better performance: i) has better table detection performance in terms of both precision and recall; and ii) is able to handle well the cells where the text spans over multiple rows as shown in Figure 6.
| Edit-distance | |||||||||
|---|---|---|---|---|---|---|---|---|---|
| P | R | F1 | P | R | F1 | P | R | F1 | |
| 0 | 0.5433 | 0.3856 | 0.4511 | 0.545 | 0.4166 | 0.4722 | 0.4388 | 0.3438 | 0.3855 |
| 2 | 0.6785 | 0.4816 | 0.5633 | 0.6361 | 0.4862 | 0.5512 | 0.516 | 0.4043 | 0.4534 |
| 3 | 0.7188 | 0.5101 | 0.5967 | 0.6619 | 0.5059 | 0.5735 | 0.54 | 0.4231 | 0.4744 |
3.2.4 Cell Content Extraction.
In Table , we evaluate the performance of ’s cell content extraction module and compare it against and . We take each pair of ground truth and predicted table and compute the performance using the edit-distance metric, as mentioned in section3.1.5. We report the scores at edit-distance 0 (exact match) and at edit-distance 2 and 3 (maximum of 2 and 3 characters can be incorrect). We can see that has a gain of in terms of F1-score at different edit-distance settings and this behaviour reflects the performance in table detection and cell detection evaluations.
3.2.5 Root Cause Analysis.
We analyzed the performance of all three systems based on the category of tables. From Table 1, we can deduce that medical documents consist of majority of borderless tables and therefore, it is important to efficiently handle the borderless table category. We have seen experimentally that is able to perform more than (and ) better than system (the second best baseline) for table detection (and cell detection respectively) in terms of F1-score.
4 Conclusion
We presented , an end to end system to extract content from tables present in medical health documents. We evaluated our system using a manually annotated real-world medical dataset consisting of images, which we would be releasing to the research community. This covers a wide variety of types in terms of appearance and table structures. We experimentally showed that outperforms Amazon’s Textract and Microsoft Azure’s Form Recognizer system on the annotated medical dataset. We scored a high absolute gain in performance in terms of F1-score, which is more than and for table detection and cell detection tasks respectively. For the cell extraction task, we reported a gain of at different edit-distance settings. We also performed root cause analysis for the under-performance of the existing pipelines for medical datasets. Our experiments showed that the existing systems are not robust against the borderless tables, which is the common use-case in medical documents.
References
- [1] Adamo, F., Attivissimo, F., Di Nisio, A., Spadavecchia, M.: An automatic document processing system for medical data extraction. Measurement 61, 88–99 (2015)
- [2] Agarwal, M., Mondal, A., Jawahar, C.: Cdec-net: Composite deformable cascade network for table detection in document images. arXiv preprint:2008.10831 (2020)
- [3] Cai, Z., Vasconcelos, N.: Cascade r-cnn: high quality object detection and instance segmentation. IEEE transactions on pattern analysis and machine intelligence (2019)
- [4] Dutta, A., Zisserman, A.: The VIA annotation software for images, audio and video. In: Proceedings of the 27th ACM International Conference on Multimedia. MM ’19, ACM, New York, NY, USA (2019). https://doi.org/10.1145/3343031.3350535, https://doi.org/10.1145/3343031.3350535
- [5] Ghanmi, N., Belaid, A.: Separator and content based approach for table extraction in handwritten chemistry documents. In: 13th ICDAR Conference. pp. 296–300. IEEE (2015)
- [6] Gilani, A., Qasim, S.R., Malik, I., Shafait, F.: Table detection using deep learning. In: 14th ICDAR Conference. vol. 1, pp. 771–776 (2017)
- [7] Hao, L., Gao, L., Yi, X., Tang, Z.: A table detection method for pdf documents based on convolutional neural networks. In: 12th IAPR Workshop on Document Analysis Systems (DAS). pp. 287–292. IEEE (2016)
- [8] Kasar, T., Barlas, P., Adam, S., Chatelain, C., Paquet, T.: Learning to detect tables in scanned document images using line information. In: 12th ICDAR Conference. pp. 1185–1189 (2013)
- [9] Khosravi, M., Schafer, R.W.: Template matching based on a grayscale hit-or-miss transform. IEEE Transactions on Image Processing 5(6), 1060–1066 (1996). https://doi.org/10.1109/83.503921
- [10] Li, M., Cui, L., Huang, S., Wei, F., Zhou, M., Li, Z.: Tablebank: A benchmark dataset for table detection and recognition (2019)
- [11] Lin, T.Y., Maire, M., Belongie, S., Hays, J., Perona, P., Ramanan, D., Dollár, P., Zitnick, C.L.: Microsoft coco: Common objects in context. In: ECCV. pp. 740–755. Springer (2014)
- [12] Long, J., Shelhamer, E., Darrell, T.: Fully convolutional networks for semantic segmentation. In: Proceedings of the IEEE conference on computer vision and pattern recognition. pp. 3431–3440 (2015)
- [13] Neubeck, A., Van Gool, L.: Efficient non-maximum suppression. In: 18th ICPR Conference. vol. 3, pp. 850–855 (2006)
- [14] Padilla, R., Netto, S.L., da Silva, E.A.: A survey on performance metrics for object-detection algorithms. In: 2020 International Conference on Systems, Signals and Image Processing (IWSSIP). pp. 237–242. IEEE (2020)
- [15] Paliwal, S.S., Vishwanath, D., Rahul, R., Sharma, M., Vig, L.: Tablenet: Deep learning model for end-to-end table detection and tabular data extraction from scanned document images. In: ICDAR Conference. pp. 128–133 (2019)
- [16] Prasad, D., Gadpal, A., Kapadni, K., Visave, M., Sultanpure, K.: Cascadetabnet: An approach for end to end table detection and structure recognition from image-based documents. In: Proceedings of IEEE CVPR Workshops. pp. 572–573 (2020)
- [17] Ren, S., He, K., Girshick, R., Sun, J.: Faster r-cnn: Towards real-time object detection with region proposal networks. arXiv :1506.01497 (2015)
- [18] Schreiber, S., Agne, S., Wolf, I., Dengel, A., Ahmed, S.: Deepdesrt: Deep learning for detection and structure recognition of tables in document images. In: 14th ICDAR Conference. vol. 1, pp. 1162–1167. IEEE (2017)
- [19] Shi, Z., Setlur, S., Govindaraju, V.: A model based framework for table processing in degraded document images. In: 12th ICDAR Conference. pp. 963–967. IEEE (2013)
- [20] Smith, R.: An overview of the tesseract ocr engine. In: 9th ICDAR. vol. 2, pp. 629–633 (2007)
- [21] Xie, S., Girshick, R.B., Dollár, P., Tu, Z., He, K.: Aggregated residual transformations for deep neural networks. corr abs/1611.05431 (2016). arXiv preprint arXiv:1611.05431 (2016)
- [22] Xue, W., Li, Q., Zhang, Z., Zhao, Y., Wang, H.: Table analysis and information extraction for medical laboratory reports. In: 2018 IEEE 16th Intl Conf on Dependable, Autonomic and Secure Computing, 16th Intl Conf on Pervasive Intelligence and Computing, 4th Intl Conf on Big Data Intelligence and Computing and Cyber Science and Technology Congress (DASC/PiCom/DataCom/CyberSciTech). pp. 193–199. IEEE (2018)