Stimulated-Raman-scattering amplification of attosecond XUV pulses
with
pulse-train pumps and application to local in-depth
plasma-density measurement
Abstract
We present a scheme for amplifying an extreme-ultraviolet (XUV) seed
isolated attosecond pulse via stimulated Raman scattering of a
pulse-train pump. At sufficient seed and pump intensity, the
amplification is nonlinear, and the amplitude of the seed pulse can
reach that of the pump, one order of magnitude higher than the initial
seed amplitude. In the linear amplification regime, we find that the
spectral signature of the pump pulse train is imprinted on the
spectrum of the amplified seed pulse. Since the spectral signature is
imprinted with its frequency downshifted by the plasma frequency, it
is possible to deduce the electron density in the region of
interaction. This region can be of micrometer length scale
longitudinally. By varying the delay between the seed and the pump,
this scheme provides a local electron-density measurement inside
solid-density plasmas that cannot be probed with optical frequencies,
with micrometer resolution.
DOI:10.1103/PhysRevE.106.045208
I Introduction
With high-order harmonic generation in gas targets (gas-HHG) Ferray et al. (1988); Paul et al. (2001), it is possible to generate isolated attosecond pulses (IAPs) in the extreme-ultraviolet (XUV) regime Christov et al. (1997); Hentschel et al. (2001); Itatani et al. (2002); Xue et al. (2020). Such pulses can be used as probes to study processes on the attosecond timescale Calegari et al. (2016), e.g., electron wave-function dynamics in atoms and molecules Kling and Vrakking (2008); Calegari et al. (2014); Nisoli et al. (2017), as well as plasma diagnostics Hergott et al. (2001); Dobosz et al. (2005); Williams et al. (2013); Koliyadu et al. (2017); Sundström et al. (2022). However, these pulses are relatively low energy and will, in general, not be able to significantly drive a plasma in an XUV-pump–XUV-probe experiment Tzallas et al. (2011); Takahashi et al. (2013).
Another XUV source is high-order harmonic generation in laser–solid interactions Gordienko et al. (2004) (solid-HHG), via either surface plasma waves an der Brügge et al. (2012); Fedeli et al. (2017), coherent synchrotron emission an der Brügge and Pukhov (2010); Mikhailova et al. (2012); Dromey et al. (2012), the relativistic electronic spring Gonoskov et al. (2011); Blackburn et al. (2018), or the relativistically oscillating mirror mechanism Gibbon (1996); Teubner and Gibbon (2009); Thaury and Quéré (2010); Vincenti (2019); Fedeli et al. (2021); Yi (2021). The latter has the potential to provide XUV pulses with very high intensities, potentially up to Vincenti (2019). With these methods, a train of high-intensity attosecond XUV pulses can be generated with sufficiently high field strength to significantly affect the electrons and drive collective processes in a plasma. There are also methods for generating IAPs with solid-HHG Wheeler et al. (2012); Vincenti and Quéré (2012); Hammond et al. (2016); Mikhailova et al. (2012); Heissler et al. (2012); Kando et al. (2018); Jahn et al. (2019).
In this paper we propose the use of stimulated Raman back-scattering (SRS) Maier et al. (1966); Ping et al. (2000); Cheng et al. (2005); Ren et al. (2007); Trines et al. (2011a, 2020) to amplify an IAP seed pulse with a pulse-train pump. While the three-wave-coupling system of equations for SRS is fairly well understood for pseudo-monochromatic pulses, its applicability to the broad-spectrum IAP seeds and pulse-train pumps considered here is not obvious. We therefore explore the possibility of this approach via particle-in-cell (PIC) simulations, and present parametric studies of the SRS amplification with respect to initial pump and seed amplitudes as well as pulse-train length, plasma temperature, and the effect of Coulomb collisions. The use of a pulse-train pump can be of interest for smaller laser laboratories to produce high-intensity IAPs, as the other pump-pulse alternative would be x-ray free-electron lasers (XFELs), which are only found at a limited number of large-scale facilities.
Since SRS relies on the presence of electron-plasma waves induced by the pump and seed laser pulses, the efficacy of the amplification is highly dependent on both the pump and seed normalized amplitudes Trines et al. (2020), and , respectively. Our simulations indicate that efficient nonlinear amplification, without severe temporal stretching of the seed pulse, requires , which is almost within reach for gas-HHG, with reported amplitudes of Xue et al. (2020).
An interesting application of this XUV–SRS scheme is for in-depth, local electron-density diagnostics. Because high-density plasmas are opaque to optical frequencies, light-based probing methods have to be in the XUV or x-ray range of wavelengths. Previous experiments have utilized XUV transmission Hergott et al. (2001); Dobosz et al. (2005) to determine electron densities on timescales. Furthermore, XUV wave-front sensing Williams et al. (2013) and dispersion of XUV pulses Sundström et al. (2022) have been proposed to diagnose solid-density laser-generated plasmas on the timescale of the XUV pulse. However, these techniques all produce line-integrated measurements along the path of the probe pulse. By instead utilizing the locality of the SRS interaction, the method proposed in this paper has the potential to probe the electron density, inside the plasma, with micrometer-scale longitudinal resolution by varying the delay between the pump and seed.
The proposed local electron-density diagnostics method is based on the spectral imprinting of the spectral fringes of the pump pulse train onto the broad-spectrum seed pulse. This technique has previously been proposed Jang et al. (2008); Cho et al. (2014); Song et al. (2016), and demonstrated experimentally Vieux et al. (2013) to probe laser-generated plasmas in gas-jet targets using SRS of infrared lasers. Besides the possibility of probing solid-density plasmas at significantly higher spatial and temporal resolution employing XUV frequencies, our proposed use of a pulse-train pump has an additional advantage through an increased spectral resolution. Since a pulse train has a spectrum consisting of several prominent peaks (depending on the separation of the pulses in the train) and the SRS coupling is strongest at a frequency shift equal to the plasma frequency , these spectral peaks will be imprinted onto the spectrum of the seed pulse. The amplified seed pulse will therefore have a very distinct spectral signature, which can be compared with the original pulse-train pump to determine the local plasma frequency and thereby the electron density. Owing to the narrow spectral peaks, we estimate the uncertainty of the density measurement using our proposed setup to be as small as . Note that this spectral imprinting is most efficient in the linear SRS amplification regime, i.e., for , which is currently realizable.
II Interaction regimes
Consider a pump and a counterpropagating seed in a plasma with frequencies and , respectively, fulfilling the phase matching condition , where is the plasma frequency; the pulses have normalized amplitudes (for ) with and where is the elementary charge, is the electron mass, is the speed of light, is the permittivity of free space, and is the intensity of the respective beams. Following Edwards et al. (2017), the linear-regime SRS growth rate for the seed pulse inside a plasma with electron density is given by
| (1) |
where
| (2) |
is the undamped SRS growth rate with pump and seed wavenumbers and , respectively, and is the critical density associated with ; and using the normalized collisional and Landau damping rates
| (3) |
and
| (4) |
respectively, where , and the Coulomb logarithm is taken as with the electron temperature , Debye length , and ion charge number .
In this paper we study pump amplitudes ranging from to , which results in growth rates on the order of at . As discussed by Edwards et al. (2017) for wavelengths above and for the pump amplitudes considered here, amplification by SRS should be more favorable than stimulated Brillouin scattering (SBS), or in some cases the difference will be marginal. However, this theory assumes quasimonochromatic pulses, which is not the case in our study. We have also verified, by complementary simulations (not shown here), that indeed the SBS amplification is not efficient for our setup and parameter range. As it is expected that the observed growth rates should be lower due to the “gaps” between pulses in the pump pulse train, the faster time scales associated with SRS are essential. Furthermore, due to the short pulse durations, the energy in the pump and seed pulses is spread over a broad spectral range, which is expected to differently affect the growth rates of the spectral components of the seed. To our knowledge, there is no developed fully spectral theory of the SRS with broad-band pulses, but we expect that the growth rate of each spectral component is approximately proportional to the spectral density of the pump – similar to the dependence in (2) – where is the Fourier transform of the electric field.
It has been pointed out that in order to have efficient SRS amplification, it is useful to start with a seed that has initial amplitude and duration close to the optimal condition of nonlinear amplification Trines et al. (2020), namely, , where and are the amplitude and duration, respectively, of the seed pulse once the nonlinear regime has set in, with being comparable to . Typical seed pulses in the XUV range will be only a few cycles and will interact in relatively high density plasmas, of the order of . In order to fulfill the condition above, we would need a very large initial seed amplitude , which is beyond the parameter range of interest for this paper. Nonetheless, for sufficiently large pump intensity () we do enter into a nonlinear regime of amplification as will be discussed below.
III Simulation setup
We used the \comicneueSmilei PIC code Derouillat et al. (2018) to simulate the interaction between a seed pulse and a pump pulse train in a plasma in one dimension (1D). The simulations were performed in various box sizes, all with a spatial resolution of , at least 50 times smaller than the laser wavelengths used in this study. The seed pulse considered here had a central wavelength of and the Gaussian temporal envelope with a (field-amplitude) full-width-at-half-maximum (FWHM) duration of four cycles. The plasma was chosen to be a pure hydrogen plasma at densities (Sec. IV.1) and (Sec. IV.2), where is the critical density associated with the seed central frequency . The plasma was modeled using and particles per cell for the electrons and protons, respectively. The initial electron and ion temperatures were and , respectively. The pulse trains considered had central wavelengths of (Sec. IV.1) and (Sec. IV.2); the individual pulses in the train were also of four-cycle FWHM duration – based on their own central wavelength. The distance between pulses in the train was .
We have also performed additional simulations to investigate the effect of electron temperature and Coulomb collisions on the SRS as well as on the spontaneous Raman scattering (RS) which occurs for the higher-intensity pumps. This was done through a scan in electron temperature from to , both with and without binary Coulomb collisions Pérez et al. (2012) enabled. Because the spontaneous RS is seeded by random density fluctuations, it is sensitive to numerical noise, and we have used a higher resolution in order to accurately capture the spontaneous RS 111 The spatial resolution was doubled, , and the number of particles per cell was increased to 8000 per cell and per species, i.e., in total 16 times the number of particles compared with the nominal simulations. We deemed that the simulation results of the spontaneous RS were sufficiently converged, when the energy difference between 4000 and 8000 particles per cell was smaller than 10 %.. We note, however, that the strength of the spontaneous RS in our study is relatively small compared with the SRS, and that the difference in energy contained in the spontaneous RS between the nominal and high-resolution simulation is , which amounts to of the energy in the SRS-amplified pulse in all cases. The nominal-resolution simulations therefore give a good representation of the behavior of the SRS mechanism, even if they might overestimate spontaneous RS.
We note that the use of 1D PIC simulations is well justified under these conditions. The fastest-growing transverse instability one can expect, the filamentation instability Max et al. (1974); Weber et al. (2013), grows over timescales of hundreds of femtoseconds and submicrometer transverse scales, much larger than those considered in this paper.
IV Results and discussion
We first discuss the amplification of an IAP (Sec. IV.1), considering in particular the effect of the lengths of pump pulse trains. Most efficient amplification, without severely extending the duration of the amplified seed pulse, is shown to occur in the non-linear regime. In contrast, in the linear SRS regime (Sec. IV.2), the clear spectral signature of the pump pulse train is imprinted onto the seed pulse with a frequency shift equal to the local plasma frequency. By comparing the spectra of the amplified and pump pulses, this technique can be used to deduce the electron density inside the plasma, with micrometer resolution.
IV.1 XUV-pulse amplification
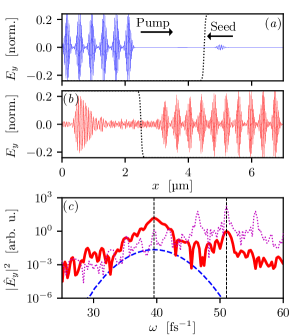
Figure 1 shows the amplification of a seed pulse with initial amplitude ; Figs. 1(a) and 1(b) show the pulse before and after, respectively, interaction with the pump pulse train consisting of pulses with wavelength . The dotted black curves in Figs. 1(a) and 1(b) indicate the spatial filtering used to obtain the spectra of the seed pulse shown in Fig. 1(c), where the dashed blue curve represents the spectrum of the initial seed pulse and the solid red curve represents that of the amplified seed pulse; the dotted magenta curve shows the spectrum of the pump after SRS has occurred. The vertical dashed lines show the spectral maxima of the pump and amplified seed pulses; the corresponding frequency downshift agrees very well with the plasma frequency associated with the electron density used here.
The quality of the amplification can broadly be captured by two parameters: the energy gain and amplified-pulse duration measured as the time span that contains 95 % of the energy in the pulse. By integrating the spatially filtered spectra in Fig. 1(c), we can calculate the energy of the seed pulse before and after amplification, which gives an energy gain of in this case. Next, we find the duration of the amplified pulse to be ; in comparison, the initial seed-pulse duration is .
In order to gauge the efficacy of the pulse-train pump compared with flat-top (constant-intensity) pulses, we run two simulations with two different flat-top pump pulses. The first such pulse was chosen to contain the same total energy as the pulse train, resulting in a duration of . The second flat-top pump had a duration of , which is the same duration as the pulse train – but containing approximately 2.9 times more energy. The energy gain and amplified-pulse duration obtained from the pulse-train pump and the two flat-top pumps are summarized in Table 1. The lower energy gain observed with the same-energy flat-top pump might indicate that the seed pulse requires some fixed time in the linear-growth regime, which makes up a larger proportion of the same-energy pump than in the pulse train. At the same time, the short duration and observed amplified-pulse spectrum (not shown here) suggest that the SRS interaction eventually reaches the nonlinear regime, with resulting pulse compression. The same-duration flat-top pump results in a significantly larger energy gain, as expected, while still having a significantly shorter duration than the pulse-train pump; both of these observations are expected since the higher energy in this pump allows for both more energy transfer and a more nonlinear interaction. It also appears that the flat-top pumps result in somewhat less spontaneous RS and other noise, which is likely due to the narrower spectrum of the flat-top pulse envelopes.
| Pump type | Energy gain | Duration (fs) |
|---|---|---|
| Pulse train | 236 | 3.0 |
| Flat top (same energy) | 83 | 0.9 |
| Flat top (same duration) | 330 | 1.5 |

We have also performed similar calculations for various pulse-train lengths with different combinations of pump and seed amplitudes, and , respectively, which are shown in Fig. 2(a). In the cases displayed, the gain rises rapidly with the number of pump pulses for small . However, at a certain point the gain saturates at approximately , which roughly corresponds to the seed pulse reaching the amplitude of the pump. Extending the pump pulse train beyond this saturation point mostly results in a broadening of the pulse envelope and an increased background of spontaneous Raman scattering (RS). The unwanted spontaneous RS is especially prominent in the cases with and – due to the stronger nonlinear effects at higher pump amplitudes. Already at , there is noticeable spontaneous RS, as seen by the noise floor on both sides of the amplified seed pulse in Fig. 1(b).
The stronger nonlinearity present at higher pump and seed amplitudes is, however, also key to producing short amplified pulses. In Fig. 2(b), we see that the shortest amplified-pulse durations are produced with (with between 5 and 10). For the case (red triangles), we also observe a decrease in starting at , which indicates the onset of pulse compression observed in strongly nonlinear SRS Trines et al. (2011b). For the same case, we also see a more irregular behavior after , which is likely due to the higher spontaneous RS in the longer simulation box used for the cases, as discussed in the previous paragraph.
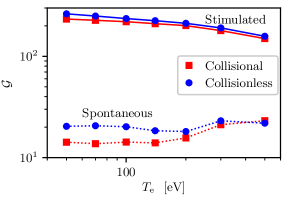
We continue by investigating the saturation of the relative energy gain by varying the initial electron temperature, which affects the strength of Landau damping, as well as using a seed pulse with , to study whether electron-wave breaking may be causing the saturation. These simulations were performed with significantly higher resolution in order to accurately resolve the spontaneous RS, as discussed in Sec. III; corresponding results are shown in fig. 3. When the electron temperature is varied between and , there is no clear trend in the strength of the spontaneous RS in the collisionless cases, while the desired stimulated RS is reduced at higher temperatures. Interestingly, including collisions reduces the spontaneous RS somewhat while at the same time only impacting the stimulated energy gain by . However, in foil targets the higher ion charge at solid density may result in more significant collisional effects Sundström et al. (2020a, b). The effect of collisions decreases with temperature, both in stimulated RS and in spontaneous RS. At , the spontaneous RS is even slightly higher with collisions than without; this is within the noise margin of the PIC simulations.
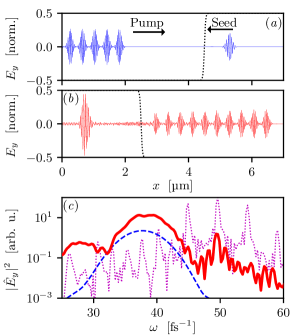
Next, in a series of simulations with , we varied the number of pulses in the pump train from to to study the effect of electron-wave breaking. The result of the case is shown in Fig. 4, where we in Fig. 4(b) see that the amplitude of the amplified pulse is almost times higher than the initial seed amplitude, without any significant increase in pulse duration – the amplified-pulse duration is , compared with the initial seed duration of . While the electron phase space (not shown) in the cases shows clear tendencies of electron-wave breaking – which occurs when the amplitude of the electron wave is sufficiently large that the fastest electrons significantly outrun the wave itself – we still find that the absolute energy gain is approximately twice that of the case. Thus, since there is no deterioration of the energy transfer for , we may conclude that electron-wave breaking is not significantly affecting the nonlinear amplification in the cases considered here.
IV.2 Linear SRS as a local density diagnostic
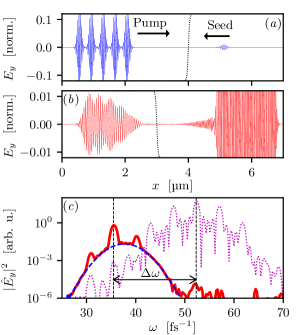
Although the relative energy gain is lower and the amplified-pulse duration is longer in the linear compared with the nonlinear regime, the same mechanism that causes these undesirable amplification properties can instead be exploited for measuring the electron density inside a plasma. Figure 5 shows the results of the interaction between an pump pulse train and an seed pulse with central wavelengths (in vacuum) of and , respectively. Figures 5(a) and 5(b) show the pulses before and after interaction, respectively. We find that the amplitude of the seed was not greatly affected by the SRS; however, the pulse duration increased to – practically to that of the full pump pulse train.
The cause for this result is elucidated by the spectra shown in Fig. 5(c). The amplified pulse has acquired three distinct peaks (solid red curve) on top of the initial spectrum (dashed blue curve). These peaks correspond to a downshift by of the three highest peaks of the pump spectrum (dotted magenta curve). Spectrally, the amplified seed pulse has become more similar to a pulse train, which is also seen in the real-space shape of the envelope [Fig. 5(b)]. Owing to the frequency shift, the spectral peaks of the amplified seed pulse are still distinguishable from reflections of the pump pulse train.
The linear nature of the low-amplitude SRS means that the amplification of each spectral component of the seed is approximately proportional to the spectral density of the pump (downshifted by ). We therefore get an imprinting of the rather distinct spectral signature of the pump pulse train onto the amplified pulse, which allows us to determine the size of the frequency shift , as indicated by the two vertical dashed lines in Fig. 5(c). We find that the downshift agrees very well with the electron density used in this simulation, which has a corresponding plasma frequency of . In practice, however, the accuracy of the measured frequency shift is limited by the width of the spectral peaks, which in this case is approximately , giving an uncertainty in the density measurement of less than . If the length, , of the pulse train is increased, the spectral width of each peak will be reduced, thus increasing the accuracy – albeit at the cost of lower spatiotemporal resolution.
Also note that the broad-spectrum nature of the seed and the pump is crucial for this density diagnostic method to be effective. Because the spectral amplification also depends on the spectral density of the seed, , the seed-pulse spectrum should be sufficiently broad to capture the imprinting of an as-wide-as-possible section of the pump spectrum, even when the central frequencies are not perfectly matched – as is the case in the simulation shown in Fig. 5. If the seed and pump had narrow spectra, then the frequency difference between the seed and the pump would have to be swept, in order to find the largest amplification, before the value of could be established, which could be challenging experimentally. Of course, the method is still limited in what plasma densities can be measured – based on which seed and pump central frequencies are available – even with a broadband seed and pump, but the range of densities that can be probed increases with the seed and pump bandwidths.
Next, because the spectral imprinting only occurs while the seed and the pump interact, the probed frequency shift corresponds to the plasma frequency only in the interaction region, the size of which is approximately half the length of the pump pulse train. While the linear regime operates with relatively low amplitude pulses, it should be noted that if the pump amplitude is below , the SRS growth rate becomes low – even if the seed amplitude is increased to – and a longer pump pulse train is needed, thus increasing the interaction region. By varying the pump–seed delay, it is possible to choose where in the plasma to probe the density. This method therefore has the potential to probe the electron density at micrometer longitudinal resolution, at depth inside the plasma. Depending on the transverse size of the focus, the probed volume can be as small as a few tens of .
V Conclusions
We have presented a scheme for amplifying isolated attosecond XUV pulses based on stimulated Raman scattering (SRS). In order to efficiently amplify the attosecond seed pulse without severely extending its duration, the seed and pump must be sufficiently strong to enter the nonlinear regime. In particular, we find that the relativistic amplitude of the seed should be with a pump of amplitude .
In the linear SRS regime, the broad spectrum of the attosecond seed is imprinted with the peaked spectrum of the pump pulse train. Because the imprinting of the pump spectrum occurs with a frequency downshift equal to the local plasma frequency , the local plasma density can be deduced by comparing the spectra of the pump and amplified seed pulses. The advantage of this in-depth density-measurement method is that, depending on the length of the pump pulse train, the longitudinal spatial resolution can be in the micrometer scale, allowing for local density diagnostics of solid-density plasmas inside the plasma.
Acknowledgements.
The authors are grateful for fruitful discussions with P. Eng-Johnsson, A. Gonoskov, and T. Fülöp. This project has received funding from the Knut and Alice Wallenberg Foundation (Grand no. KAW 2020.0111). A.S. gratefully acknowledges the support from Adlerbertska forskningsstiftelsen. The computations were enabled by resources provided by the Swedish National Infrastructure for Computing (SNIC), partially funded by the Swedish Research Council through grant agreement no. 2018-05973.References
- Ferray et al. (1988) M. Ferray, A. L’Huillier, X. F. Li, L. A. Lompre, G. Mainfray, and C. Manus, Journal of Physics B: Atomic, Molecular and Optical Physics 21, L31 (1988).
- Paul et al. (2001) P. M. Paul, E. S. Toma, P. Breger, G. Mullot, F. Augé, Balcou, Ph., H. G. Muller, and P. Agostini, Science 292, 1689 (2001).
- Christov et al. (1997) I. P. Christov, M. M. Murnane, and H. C. Kapteyn, Phys. Rev. Lett. 78, 1251 (1997).
- Hentschel et al. (2001) M. Hentschel, R. Kienberger, C. Spielmann, G. A. Reider, N. Milosevic, T. Brabec, P. Corkum, U. Heinzmann, M. Drescher, and F. Krausz, Nature 414, 509 (2001).
- Itatani et al. (2002) J. Itatani, F. Quéré, G. L. Yudin, M. Y. Ivanov, F. Krausz, and P. B. Corkum, Phys. Rev. Lett. 88, 173903 (2002).
- Xue et al. (2020) B. Xue, Y. Tamaru, Y. Fu, H. Yuan, P. Lan, O. D. Mücke, A. Suda, K. Midorikawa, and E. J. Takahashi, Science Advances 6, eaay2802 (2020).
- Calegari et al. (2016) F. Calegari, G. Sansone, S. Stagira, C. Vozzi, and M. Nisoli, Journal of Physics B: Atomic, Molecular and Optical Physics 49, 062001 (2016).
- Kling and Vrakking (2008) M. F. Kling and M. J. J. Vrakking, Annu. Rev. Phys. Chem. 59, 463 (2008).
- Calegari et al. (2014) F. Calegari, D. Ayuso, A. Trabattoni, L. Belshaw, S. De Camillis, S. Anumula, F. Frassetto, L. Poletto, A. Palacios, P. Decleva, et al., Science 346, 336 (2014).
- Nisoli et al. (2017) M. Nisoli, P. Decleva, F. Calegari, A. Palacios, and F. Martín, Chemical reviews 117, 10760 (2017).
- Hergott et al. (2001) J.-F. Hergott, P. Salières, H. Merdji, L. le Déroff, B. Carré, T. Auguste, P. Monot, P. d’Oliveira, D. Descamps, J. Norin, C. Lyngå, A. L’Huillier, C.-G. Wahlström, M. Bellini, and S. Huller, Laser and Particle Beams 19, 35–40 (2001).
- Dobosz et al. (2005) S. Dobosz, G. Doumy, H. Stabile, P. D’Oliveira, P. Monot, F. Réau, S. Hüller, and P. Martin, Phys. Rev. Lett. 95, 025001 (2005).
- Williams et al. (2013) G. O. Williams, H.-K. Chung, S. M. Vinko, S. Künzel, A. B. Sardinha, Zeitoun, Ph., and M. Fajardo, Physics of Plasmas 20, 042701 (2013).
- Koliyadu et al. (2017) J. C. P. Koliyadu, S. Künzel, T. Wodzinski, B. Keitel, J. Duarte, G. O. Williams, C. P. João, H. Pires, V. Hariton, M. Galletti, N. Gomes, G. Figueira, J. M. Dias, N. Lopes, P. Zeitoun, E. Plönjes, and M. Fajardo, Photonics 4, 25 (2017).
- Sundström et al. (2022) A. Sundström, I. Pusztai, P. Eng-Johnsson, and T. Fülöp, Journal of Plasma Physics 88, 905880211 (2022).
- Tzallas et al. (2011) P. Tzallas, E. Skantzakis, L. Nikolopoulos, G. D. Tsakiris, and D. Charalambidis, Nature Physics 7, 781 (2011).
- Takahashi et al. (2013) E. J. Takahashi, P. Lan, O. D. Mücke, Y. Nabekawa, and K. Midorikawa, Nature communications 4, 1 (2013).
- Gordienko et al. (2004) S. Gordienko, A. Pukhov, O. Shorokhov, and T. Baeva, Phys. Rev. Lett. 93, 115002 (2004).
- an der Brügge et al. (2012) D. an der Brügge, N. Kumar, A. Pukhov, and C. Rödel, Phys. Rev. Lett. 108, 125002 (2012).
- Fedeli et al. (2017) L. Fedeli, A. Sgattoni, G. Cantono, and A. Macchi, Applied Physics Letters 110, 051103 (2017).
- an der Brügge and Pukhov (2010) D. an der Brügge and A. Pukhov, Physics of Plasmas 17, 033110 (2010).
- Mikhailova et al. (2012) J. M. Mikhailova, M. V. Fedorov, N. Karpowicz, P. Gibbon, V. T. Platonenko, A. M. Zheltikov, and F. Krausz, Phys. Rev. Lett. 109, 245005 (2012).
- Dromey et al. (2012) B. Dromey, S. Rykovanov, M. Yeung, R. Hörlein, D. Jung, D. Gautier, T. Dzelzainis, D. Kiefer, S. Palaniyppan, R. Shah, et al., Nature Physics 8, 804 (2012).
- Gonoskov et al. (2011) A. A. Gonoskov, A. V. Korzhimanov, A. V. Kim, M. Marklund, and A. M. Sergeev, Phys. Rev. E 84, 046403 (2011).
- Blackburn et al. (2018) T. G. Blackburn, A. A. Gonoskov, and M. Marklund, Phys. Rev. A 98, 023421 (2018).
- Gibbon (1996) P. Gibbon, Phys. Rev. Lett. 76, 50 (1996).
- Teubner and Gibbon (2009) U. Teubner and P. Gibbon, Rev. Mod. Phys. 81, 445 (2009).
- Thaury and Quéré (2010) C. Thaury and F. Quéré, Journal of Physics B: Atomic, Molecular and Optical Physics 43, 213001 (2010).
- Vincenti (2019) H. Vincenti, Phys. Rev. Lett. 123, 105001 (2019).
- Fedeli et al. (2021) L. Fedeli, A. Sainte-Marie, N. Zaim, M. Thévenet, J. L. Vay, A. Myers, F. Quéré, and H. Vincenti, Phys. Rev. Lett. 127, 114801 (2021).
- Yi (2021) L. Yi, Phys. Rev. Lett. 126, 134801 (2021).
- Wheeler et al. (2012) J. A. Wheeler, A. Borot, S. Monchocé, H. Vincenti, A. Ricci, A. Malvache, R. Lopez-Martens, and F. Quéré, Nature Photonics 6, 829 (2012).
- Vincenti and Quéré (2012) H. Vincenti and F. Quéré, Phys. Rev. Lett. 108, 113904 (2012).
- Hammond et al. (2016) T. J. Hammond, G. G. Brown, K. T. Kim, D. M. Villeneuve, and P. B. Corkum, Nature Photonics 10, 171 (2016).
- Heissler et al. (2012) P. Heissler, R. Hörlein, J. M. Mikhailova, L. Waldecker, P. Tzallas, A. Buck, K. Schmid, C. M. S. Sears, F. Krausz, L. Veisz, M. Zepf, and G. D. Tsakiris, Phys. Rev. Lett. 108, 235003 (2012).
- Kando et al. (2018) M. Kando, T. Z. Esirkepov, J. K. Koga, A. S. Pirozhkov, and S. V. Bulanov, Quantum Beam Science 2, 9 (2018).
- Jahn et al. (2019) O. Jahn, V. E. Leshchenko, P. Tzallas, A. Kessel, M. Krüger, A. Münzer, S. A. Trushin, G. D. Tsakiris, S. Kahaly, D. Kormin, L. Veisz, V. Pervak, F. Krausz, Z. Major, and S. Karsch, Optica 6, 280 (2019).
- Maier et al. (1966) M. Maier, W. Kaiser, and J. A. Giordmaine, Phys. Rev. Lett. 17, 1275 (1966).
- Ping et al. (2000) Y. Ping, I. Geltner, N. J. Fisch, G. Shvets, and S. Suckewer, Phys. Rev. E 62, R4532 (2000).
- Cheng et al. (2005) W. Cheng, Y. Avitzour, Y. Ping, S. Suckewer, N. J. Fisch, M. S. Hur, and J. S. Wurtele, Phys. Rev. Lett. 94, 045003 (2005).
- Ren et al. (2007) J. Ren, W. Cheng, S. Li, and S. Suckewer, Nature Physics 3, 732 (2007).
- Trines et al. (2011a) R. M. G. M. Trines, F. Fiúza, R. Bingham, R. A. Fonseca, L. O. Silva, R. A. Cairns, and P. A. Norreys, Phys. Rev. Lett. 107, 105002 (2011a).
- Trines et al. (2020) R. M. G. M. Trines, E. P. Alves, E. Webb, J. Vieira, F. Fiúza, R. A. Fonseca, L. O. Silva, R. A. Cairns, and R. Bingham, Scientific reports 10, 1 (2020).
- Jang et al. (2008) H. Jang, M. S. Hur, J. M. Lee, M. H. Cho, W. Namkung, and H. Suk, Applied Physics Letters 93, 071506 (2008).
- Cho et al. (2014) M.-H. Cho, Y.-K. Kim, and M. S. Hur, Applied Physics Letters 104, 141107 (2014).
- Song et al. (2016) H. S. Song, M.-H. Cho, Y.-K. Kim, T. Kang, H. Suk, and M. S. Hur, Plasma Physics and Controlled Fusion 58, 025006 (2016).
- Vieux et al. (2013) G. Vieux, B. Ersfeld, J. P. Farmer, M. S. Hur, R. C. Issac, and D. A. Jaroszynski, Applied Physics Letters 103, 121106 (2013).
- Edwards et al. (2017) M. R. Edwards, J. M. Mikhailova, and N. J. Fisch, Phys. Rev. E 96, 023209 (2017).
- Derouillat et al. (2018) J. Derouillat, A. Beck, F. Pérez, T. Vinci, M. Chiaramello, A. Grassi, M. Flé, G. Bouchard, I. Plotnikov, N. Aunai, J. Dargent, C. Riconda, and M. Grech, Comput. Phys. Commun. 222, 351 (2018).
- Pérez et al. (2012) F. Pérez, L. Gremillet, A. Decoster, M. Drouin, and E. Lefebvre, Phys. of Plasmas 19, 083104 (2012).
- Note (1) The spatial resolution was doubled, , and the number of particles per cell was increased to 8000 per cell and per species, i.e., in total 16 times the number of particles compared with the nominal simulations. We deemed that the simulation results of the spontaneous RS were sufficiently converged, when the energy difference between 4000 and 8000 particles per cell was smaller than 10\tmspace+.1667em%.
- Max et al. (1974) C. E. Max, J. Arons, and A. B. Langdon, Phys. Rev. Lett. 33, 209 (1974).
- Weber et al. (2013) S. Weber, C. Riconda, L. Lancia, J.-R. Marquès, G. A. Mourou, and J. Fuchs, Phys. Rev. Lett. 111, 055004 (2013).
- Trines et al. (2011b) R. M. G. M. Trines, F. Fiuza, R. Bingham, R. A. Fonseca, L. O. Silva, R. A. Cairns, and P. A. Norreys, Nature Physics 7, 87 (2011b).
- Sundström et al. (2020a) A. Sundström, L. Gremillet, E. Siminos, and I. Pusztai, Journal of Plasma Physics 86, 755860201 (2020a).
- Sundström et al. (2020b) A. Sundström, L. Gremillet, E. Siminos, and I. Pusztai, Plasma Physics and Controlled Fusion 62, 085015 (2020b).