Trace anomaly as signature of conformality in neutron stars
Abstract
We discuss an interpretation that a peak in the sound velocity in neutron star matter, as suggested by the observational data, signifies strongly-coupled conformal matter. The normalized trace anomaly is a dimensionless measure of conformality leading to the derivative and the non-derivative contributions to the sound velocity. We find that the peak in the sound velocity is attributed to the derivative contribution from the trace anomaly that steeply approaches the conformal limit. Smooth continuity to the behavior of high-density QCD implies that the matter part of the trace anomaly may be positive definite. We discuss a possible implication of the positivity condition of the trace anomaly on the - relation of the neutron stars.
Introduction:
Massless quantum chromodynamics (QCD) exhibits conformal symmetry, and the expectation value of the trace of the energy-momentum tensor, , vanishes at the classical level 111For the non-Abelian gauge theories coupled to fermions scale invariance implies conformality; see Ref. Polchinski (1983). Throughout this paper conformality means . Conversely, we dub as a trace anomaly.. Conformal symmetry, however, is broken at the quantum level. This violation is quantified via the trace anomaly, which has the anomalous term proportional to the gluon condensate owing to the running of the strong coupling constant, .
At finite temperature and baryon chemical potential , the condensate should depend on and and we can decompose the trace anomaly into the vacuum and the matter parts. The matter part of the trace anomaly can be expressed in terms of thermodynamic quantities, i.e., the energy density and the pressure , as . An interesting question is how changes near the transition point. At finite and the lattice-QCD simulations provide the first-principles estimate. In Refs. Boyd et al. (1995, 1996) the normalized trace anomaly, (referred to as the interaction measure), in the pure Yang-Mills theory was found to have a sharp peak at the deconfinement temperature, , and a tail approaching zero asymptotically at high .
This enhancement is understood from the thermal modification of the condensate. The gluon condensate melts near the transition point leading to a peak in the thermal part of the trace anomaly. Lattice measurements of the trace anomaly have a striking impact on our understanding of deconfined matter. As pointed out in the section of “Discussion of Conformal Symmetry” in Ref. Miller (2007) the trace anomaly behaves like even for suggesting that a strongly-coupled gluonic system is realized in the deconfined phase.
The trace anomaly has been also calculated in full QCD with dynamical quarks (e.g., Refs. Cheng et al. (2008); Borsanyi et al. (2014); Bazavov et al. (2014)). The hard-thermal-loop perturbation theory (HTLpt) is successful in reproducing the trace anomaly with quarks already around , while the agreement between the lattice and the HTLpt results for the pure Yang-Mills theory begins only around Andersen et al. (2011).
These high- studies motivate us to investigate the trace anomaly at high baryon density. For baryon density , where is the saturation density, QCD thermodynamics is elusive because the lattice calculations are hampered by the sign problem. The only ab initio methods are: the chiral effective field theory (EFT) around (see, e.g., Ref. Drischler et al. (2021a) for a recent review), and the perturbative QCD (pQCD) at high density where is sufficiently small Freedman and McLerran (1977a); *Freedman:1976dm; *Freedman:1976ub; Kurkela et al. (2010) (see also Refs. Gorda et al. (2018, 2021a); *Gorda:2021kme; Gorda et al. (2022a); *Gorda:2022zyc; Fujimoto and Fukushima (2022); Fernandez and Kneur (2021) for recent developments).
To constrain thermodynamic quantities or the equation of state (EoS), we can also rely on the empirical knowledge from the neutron star (NS) observations; the sound velocity, , characterizes the EoS. Recently, a non-monotonicity of as a function of density has been conjectured Kojo (2021a); Altiparmak et al. (2022); Ecker and Rezzolla (2022). For instance, Quarkyonic description of dense matter McLerran and Pisarski (2007); Duarte et al. (2021); Kojo (2021b); Kojo and Suenaga (2022); Fukushima and Kojo (2016); McLerran and Reddy (2019); Jeong et al. (2020); Sen and Warrington (2021); Cao and Liao (2020); Kovensky and Schmitt (2020) in the large- limit ’t Hooft (1974); Witten (1979) leads to the rapid increase, accompanied by a peak of the sound velocity (see also Refs. Pisarski (2021); Hippert et al. (2021); Lee et al. (2022); Marczenko et al. (2022)).
At asymptotic densities where QCD recovers conformality, is expected; this limit is commonly referred to as the conformal limit, and thus serves a measure of conformality. There was a conjecture claiming at all densities Cherman et al. (2009); see also Ref. Hohler and Stephanov (2009). However, the recent analyses of NS data including the two-solar-mass pulsars Demorest et al. (2010); *Fonseca:2016tux; Antoniadis et al. (2013); Cromartie et al. (2019); *Fonseca:2021wxt; Romani et al. (2022) are in strong tension with at sufficiently high Bedaque and Steiner (2015); Tews et al. (2018); Fujimoto et al. (2018); *Fujimoto:2019hxv; *Fujimoto:2021zas; Drischler et al. (2021b, 2022), which seems to challenge the conformality in dense NS matter in deep cores.
Here we propose the trace anomaly scaled by the energy density as a new measure of conformality. The sound velocity is expressed solely in terms of the normalized trace anomaly, and the latter is a more comprehensive quantity than . Here, we extract the trace anomaly from the EoSs inferred from the NS data Fujimoto et al. (2018); *Fujimoto:2019hxv; *Fujimoto:2021zas; Al-Mamun et al. (2021); Raaijmakers et al. (2021); Gorda et al. (2022c). We discuss the conformal limits and , and clarify the difference. We show that the enhancement in the sound velocity is not in contradiction with conformality. We then discuss the possibility that the trace anomaly is positive definite at all densities. We give a number of arguments for the positivity of the trace anomaly and discuss implications for NS physics.
Trace anomaly at finite baryon density:
Scale transformations lead to the dilatation current for which Coleman (1985). For conformal theories but in QCD both quark masses and the trace anomaly explicitly break the scale invariance as Collins et al. (1977); Nielsen (1977)
| (1) |
where is the QCD beta function and is the anomalous dimension of the quark mass.
At finite and/or , the expectation value involves a matter contribution as where represents the vacuum expectation value at . In this work we will focus on the matter contribution only given by
| (2) |
It is customary to call the trace anomaly too. If thermal degrees of freedom are dominated by massless particles as is the case in the high- limit, the Stefan-Boltzmann law is saturated and at high temperature or at high density, so that . Conversely, using thermodynamic relations, one can show that implies or , respectively. Thus, is a probe for the thermodynamic content of matter.
The physical meaning of the trace anomaly is transparent from the following relations:
| (3) |
where we quantify the effective degrees freedom by and for hot matter at and dense matter at , respectively. These imply that the trace anomaly is proportional to the increasing rate of the thermal degrees of freedom as the temperature/density grows up.
Here, we propose to use
| (4) |
as a measure of the trace anomaly 222Our is equivalent to defined in Ref. Gavai et al. (2005) apart from an overall constant, .. The thermodynamic stability and the causality require and , respectively. Therefore , and in the scale-invariant limit.
We decompose the sound velocity as
| (5) |
where the derivative and the non-derivative terms are
| (6) |
Here, and is the energy density at nuclear saturation density, i.e., . From these expressions it is evident that the restoration of conformality renders and , so that in the conformal limit at asymptotically high density.
Trace anomaly from the NS observations:
In Fig. 1, we show extracted from various constrained by NS observables Fujimoto et al. (2018); *Fujimoto:2019hxv; *Fujimoto:2021zas; Al-Mamun et al. (2021); Raaijmakers et al. (2021); Gorda et al. (2022c). The error band represents the credible interval corresponding to the error in . Since is treated as an explanatory variable, the relative error in is assumed to be the same as that in .
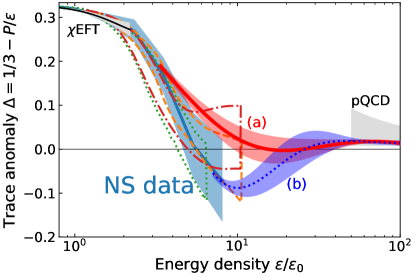
For all these data within the error at relatively low energy density. Note that the red dash-dotted curve in Fig. 1 follows from the analysis including pQCD as an input Gorda et al. (2022c), which makes the tendency more apparent.
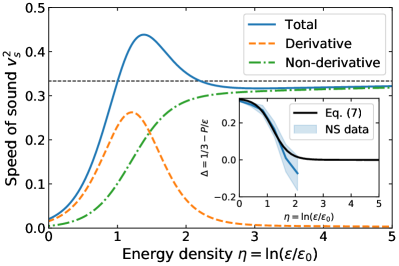
Fig. 1 shows that the (normalized) trace anomaly in the present experimental range monotonically decreases with increasing . At asymptotically high density should be eventually reached. It is nontrivial that the NS observations favor at intermediate , well below the asymptotic density. Here, we elucidate that this quick approach to conformality causes a prominent peak in . We emphasize that, even if the behavior toward is monotonic in , can be induced.
The minimal parametrization of monotonically decreasing is
| (7) |
The crossover density to conformal matter is characterized by and the width of the crossover region is . Equation (7) has the correct limit for and for . Nonzero and represent the pQCD logarithmic tails that are not well constrained from the NS data. One parameter set that fits the observational data reads,
| (8) |
The fit together with data is shown in the inset plot in Fig. 2. We show computed from Eq. (5) with the help of Eq. (7) in Fig. 2. In the high density region for , is dominated by approaching the conformal value, . At low density for , goes to zero.
The most interesting is the behavior of around . This density region corresponds to the energy scale of the transitional change from non-relativistic to relativistic degrees of freedom. There, develops a peak whose height can become larger than the conformal value.
The dashed and the dash-dotted lines in Fig. 2 show and , respectively. Because of Eq.(7) is a monotonic function, smoothly increases with increasing . Thus, exhibits the peak structure. From this decomposition we clearly recognize that the peak in is not caused by the violation of the conformal bound, but it is a signature of the steep approach to the conformal limit!
We stress that this is quite different from high- QCD where the normalized trace anomaly itself has a peak around , which causes a minimum in the sound velocity. Along the axis conformality is restored only at temperatures far above . One might have an impression that conformality in QCD should be associated with the weak coupling, but it is not necessarily the case. What we find from Fig. 1 is that conformality quantified by is quickly restored around and the peak in should be interpreted as a signature of conformality. The peak position may well be identified as the point of the slope change as observed in Ref. Annala et al. (2020). Around this peak is not yet small and the state of matter for should be regarded as “strongly-coupled conformal matter”.
We note that generally occurs at lower density than . We can illustrate this in a simple model with the vector interaction between the currents whose energy density is given by
| (9) |
where is the baryon mass, and and are the typical interaction strength and the scale of the system, respectively. This can be thought of as the generalization of the mean-field quantum hadrodynamics Serot and Walecka (1997). Note that , and . This means that and . The conformal point is reached when . The condition of is reached earlier at . So in this model the density at which surpasses the conformal limit is always lower than that for the trace anomaly.
Strongly-coupled conformal matter:
In Fig. 1 we overlay the currently available ab initio calculations of EFT Drischler et al. (2021b) and pQCD Kurkela et al. (2010) on the observational data that, however, do not constrain beyond . We utilized the Gaussian process for the interpolation using NS data from the machine learning Fujimoto et al. (2020) up to the density (a) and using all data up to (b). Details about the choice of the kernel and the noise will be reported elsewhere.
In the conservative inference in (a) stays positive or slightly negative after quickly approaching zero, which implies a possible bound, . Once the conformal limit of the trace anomaly is saturated, the underlying theory becomes approximately scale invariant and the EoS drastically simplifies. Baryons are strongly interacting, and yet the resultant EoS of strongly-coupled conformal matter is .
If the mean value from the machine learning inference is extrapolated, the Gaussian process prefers (b). In this case has a non-monotonic structure with two nodes. Accordingly, there should be a density window with (i.e., ) between the two zeros. The peak in is hardly affected, however, the maximum of is pulled up as compared to (a). If happens to be negative large, approaches zero after the peak, which causes softening of the EoS similarly to the first-order phase transition. Intuitively, the peak in is generated by EoS stiffening, but the soft pQCD EoS at high density requires EoS softening at intermediate density.
Is the trace anomaly positive in finite-density QCD?:
Let us focus on the scenario (a) and consider its implications. The smooth curve of (a) in Fig. 1 supports a hypothetical relation, (equivalently, ). The positivity condition of the QCD trace anomaly has been often assumed in the literature of finite- QCD; see, e.g., Ref. Bjorken (1983). The lattice-QCD calculations at finite give thermodynamic quantities satisfying Cheng et al. (2008); Borsanyi et al. (2014); Bazavov et al. (2014).
In general, however, the trace anomaly may not be positive definite. For example if the low-energy theory is a gauge theory governed by a free infrared (IR) fixed point such as an Abelian gauge theory with massless fermions or a non-Abelian gauge theory with many massless flavors Appelquist et al. (1999), where the function is positive at weak coupling and is known to be negative, then the trace anomaly (1) becomes negative. We also point out that some phenomenological nuclear EoSs bear a negative trace anomaly due to sudden stiffening of the EoS with Zel’dovich (1961); Serot and Walecka (1997); Akmal et al. (1998). Moreover, QCD at finite isospin chemical potential Son and Stephanov (2001a); *Son:2000by and two-color QCD at finite Cotter et al. (2013); Iida and Itou (2022) produce a negative trace anomaly.
Nevertheless, in view of the observational data in Fig. 1, QCD may well enjoy a special property that the matter part of the trace anomaly is positive definite. One supportive argument is based on the behavior of the chromoelectric field, , and the chromomagnetic field, . In the chiral limit only the gluon condensate, , contributes to the trace anomaly. Nuclear matter at low density is approximated as a gas of nucleons, and the trace anomaly is positive for each nucleon (that is the nucleon mass squared), and so the trace anomaly in dilute nuclear matter should be positive. In the nonrelativistic quark model at higher density, the interquark interaction is dominantly mediated by the chromoelectric field, and so the trace anomaly is positive. Besides, we know for sure that the direct pQCD computation at asymptotic high density gives a positive trace anomaly.
From another perspective the positivity of the trace anomaly can be motivated as follows. Eq. (3) relates the matter part of the trace anomaly to the density derivative of effective degrees of freedom . As long as more effective degrees of freedom are liberated at higher , we can conclude because of . It is an intriguing question how the above argument could be modified if color superconductivity is activated with a finite condensation of quark Cooper pairs.
To prove directly from QCD is an intriguing challenge. It is a nontrivial and profound question due to the composite operator renormalization. Here, we propose a complementary strategy to test this conjectured inequality using astronomical observations of NSs, namely, the maximum mass bound.
One-to-one correspondence is established between the EoS and (where is the NS mass as a function of the NS radius ). In order to find the maximum mass, , for a given radius . we assume a standard crust EoS up to Baym et al. (1971); Negele and Vautherin (1973). Then, for we identify by taking the maximally stiff/soft EoS parametrizations. Technical details are outlined in Refs. Rhoades and Ruffini (1974); Koranda et al. (1997) (see also Ref. Drischler et al. (2021b)).

Some maximally stiff EoS may render negative . In Fig. 4 the dotted line represents the original , while the black solid line shows for the EoS with the condition taken into account. Performing the EoS scan we find the gray shaded region that is incompatible with the condition. For completeness we overlay three current radius measurements obtained with two different methods; namely, spectral measurement of 4U 1820-30 and SAX J1748.9-2021 Özel et al. (2016), as well as the timing measurement of J0740+6620 from NICER Riley et al. (2021); Miller et al. (2021). We also plot the - relations from empirical nuclear EoSs Akmal et al. (1998); Goriely et al. (2010); Engvik et al. (1996); Müther et al. (1987); Baym et al. (2019). From Fig. 4 we can say that the condition has a phenomenological impact to tighten the allowed - region. In Fig. 4 we put a thin line at for eye guide. If the maximum mass is larger as reported in Refs. Romani et al. (2022); Linares et al. (2018), our proposed bound would exclude EoSs that lead to sufficiently heavy mass but small inside the gray shaded region. We propose further systematic comparisons of results with/without our positivity condition as well as the hypothesised conformality bound on the sound velocity for other observables such as the tidal deformability along the lines of, e.g., Refs. Annala et al. (2018, 2022). Future multimessenger observations, which are expected to pin down the maximum mass of NSs Margalit and Metzger (2017); Shibata et al. (2017); Rezzolla et al. (2018); Ruiz et al. (2018), and radius measurements together with the tidal deformability inferred from the merger will help to test our conjecture of the positive trace anomaly.
Acknowledgements.
We thank Neill Warrington for discussions. Y. F. would like to acknowledge useful conversations with Greg Jackson and Sanjay Reddy. K. F. thanks Shi Chen for illuminating discussions. The work of Y. F., L. M., and M. P. was supported by the U.S. DOE under Grant No. DE-FG02-00ER41132. K. F. was supported by JSPS KAKENHI Grant Nos. 22H01216 and 22H05118.References
- Note (1) For the non-Abelian gauge theories coupled to fermions scale invariance implies conformality; see Ref. Polchinski (1983). Throughout this paper conformality means . Conversely, we dub as a trace anomaly.
- Polchinski (1983) J. Polchinski, Phys. Rev. D 27, 1320 (1983).
- Boyd et al. (1995) G. Boyd, J. Engels, F. Karsch, E. Laermann, C. Legeland, M. Lutgemeier, and B. Petersson, Phys. Rev. Lett. 75, 4169 (1995), arXiv:hep-lat/9506025 .
- Boyd et al. (1996) G. Boyd, J. Engels, F. Karsch, E. Laermann, C. Legeland, M. Lutgemeier, and B. Petersson, Nucl. Phys. B 469, 419 (1996), arXiv:hep-lat/9602007 .
- Miller (2007) D. E. Miller, Phys. Rept. 443, 55 (2007), arXiv:hep-ph/0608234 .
- Cheng et al. (2008) M. Cheng et al., Phys. Rev. D 77, 014511 (2008), arXiv:0710.0354 [hep-lat] .
- Borsanyi et al. (2014) S. Borsanyi, Z. Fodor, C. Hoelbling, S. D. Katz, S. Krieg, and K. K. Szabo, Phys. Lett. B 730, 99 (2014), arXiv:1309.5258 [hep-lat] .
- Bazavov et al. (2014) A. Bazavov et al. (HotQCD), Phys. Rev. D 90, 094503 (2014), arXiv:1407.6387 [hep-lat] .
- Andersen et al. (2011) J. O. Andersen, L. E. Leganger, M. Strickland, and N. Su, Phys. Rev. D 84, 087703 (2011), arXiv:1106.0514 [hep-ph] .
- Drischler et al. (2021a) C. Drischler, J. W. Holt, and C. Wellenhofer, Ann. Rev. Nucl. Part. Sci. 71, 403 (2021a), arXiv:2101.01709 [nucl-th] .
- Freedman and McLerran (1977a) B. A. Freedman and L. D. McLerran, Phys. Rev. D 16, 1130 (1977a).
- Freedman and McLerran (1977b) B. A. Freedman and L. D. McLerran, Phys. Rev. D 16, 1147 (1977b).
- Freedman and McLerran (1977c) B. A. Freedman and L. D. McLerran, Phys. Rev. D 16, 1169 (1977c).
- Kurkela et al. (2010) A. Kurkela, P. Romatschke, and A. Vuorinen, Phys. Rev. D 81, 105021 (2010), arXiv:0912.1856 [hep-ph] .
- Gorda et al. (2018) T. Gorda, A. Kurkela, P. Romatschke, M. Säppi, and A. Vuorinen, Phys. Rev. Lett. 121, 202701 (2018), arXiv:1807.04120 [hep-ph] .
- Gorda et al. (2021a) T. Gorda, A. Kurkela, R. Paatelainen, S. Säppi, and A. Vuorinen, Phys. Rev. Lett. 127, 162003 (2021a), arXiv:2103.05658 [hep-ph] .
- Gorda et al. (2021b) T. Gorda, A. Kurkela, R. Paatelainen, S. Säppi, and A. Vuorinen, Phys. Rev. D 104, 074015 (2021b), arXiv:2103.07427 [hep-ph] .
- Gorda et al. (2022a) T. Gorda, A. Kurkela, J. Österman, R. Paatelainen, S. Säppi, P. Schicho, K. Seppänen, and A. Vuorinen, (2022a), arXiv:2204.11279 [hep-ph] .
- Gorda et al. (2022b) T. Gorda, A. Kurkela, J. Österman, R. Paatelainen, S. Säppi, P. Schicho, K. Seppänen, and A. Vuorinen, (2022b), arXiv:2204.11893 [hep-ph] .
- Fujimoto and Fukushima (2022) Y. Fujimoto and K. Fukushima, Phys. Rev. D 105, 014025 (2022), arXiv:2011.10891 [hep-ph] .
- Fernandez and Kneur (2021) L. Fernandez and J.-L. Kneur, (2021), arXiv:2109.02410 [hep-ph] .
- Kojo (2021a) T. Kojo, AAPPS Bull. 31, 11 (2021a), arXiv:2011.10940 [nucl-th] .
- Altiparmak et al. (2022) S. Altiparmak, C. Ecker, and L. Rezzolla, (2022), arXiv:2203.14974 [astro-ph.HE] .
- Ecker and Rezzolla (2022) C. Ecker and L. Rezzolla, (2022), arXiv:2207.04417 [gr-qc] .
- McLerran and Pisarski (2007) L. McLerran and R. D. Pisarski, Nucl. Phys. A 796, 83 (2007), arXiv:0706.2191 [hep-ph] .
- Duarte et al. (2021) D. C. Duarte, S. Hernandez-Ortiz, K. S. Jeong, and L. D. McLerran, Phys. Rev. D 104, L091901 (2021), arXiv:2103.05679 [nucl-th] .
- Kojo (2021b) T. Kojo, Phys. Rev. D 104, 074005 (2021b), arXiv:2106.06687 [nucl-th] .
- Kojo and Suenaga (2022) T. Kojo and D. Suenaga, Phys. Rev. D 105, 076001 (2022), arXiv:2110.02100 [hep-ph] .
- Fukushima and Kojo (2016) K. Fukushima and T. Kojo, Astrophys. J. 817, 180 (2016), arXiv:1509.00356 [nucl-th] .
- McLerran and Reddy (2019) L. McLerran and S. Reddy, Phys. Rev. Lett. 122, 122701 (2019), arXiv:1811.12503 [nucl-th] .
- Jeong et al. (2020) K. S. Jeong, L. McLerran, and S. Sen, Phys. Rev. C 101, 035201 (2020), arXiv:1908.04799 [nucl-th] .
- Sen and Warrington (2021) S. Sen and N. C. Warrington, Nucl. Phys. A 1006, 122059 (2021), arXiv:2002.11133 [nucl-th] .
- Cao and Liao (2020) G. Cao and J. Liao, JHEP 10, 168 (2020), arXiv:2007.02028 [nucl-th] .
- Kovensky and Schmitt (2020) N. Kovensky and A. Schmitt, JHEP 09, 112 (2020), arXiv:2006.13739 [hep-th] .
- ’t Hooft (1974) G. ’t Hooft, Nucl. Phys. B 72, 461 (1974).
- Witten (1979) E. Witten, Nucl. Phys. B 160, 57 (1979).
- Pisarski (2021) R. D. Pisarski, Phys. Rev. D 103, L071504 (2021), arXiv:2101.05813 [nucl-th] .
- Hippert et al. (2021) M. Hippert, E. S. Fraga, and J. Noronha, Phys. Rev. D 104, 034011 (2021), arXiv:2105.04535 [nucl-th] .
- Lee et al. (2022) H. K. Lee, Y.-L. Ma, W.-G. Paeng, and M. Rho, Mod. Phys. Lett. A 37, 2230003 (2022), arXiv:2107.01879 [nucl-th] .
- Marczenko et al. (2022) M. Marczenko, L. McLerran, K. Redlich, and C. Sasaki, (2022), arXiv:2207.13059 [nucl-th] .
- Cherman et al. (2009) A. Cherman, T. D. Cohen, and A. Nellore, Phys. Rev. D 80, 066003 (2009), arXiv:0905.0903 [hep-th] .
- Hohler and Stephanov (2009) P. M. Hohler and M. A. Stephanov, Phys. Rev. D 80, 066002 (2009), arXiv:0905.0900 [hep-th] .
- Demorest et al. (2010) P. Demorest, T. Pennucci, S. Ransom, M. Roberts, and J. Hessels, Nature 467, 1081 (2010), arXiv:1010.5788 [astro-ph.HE] .
- Fonseca et al. (2016) E. Fonseca et al., Astrophys. J. 832, 167 (2016), arXiv:1603.00545 [astro-ph.HE] .
- Antoniadis et al. (2013) J. Antoniadis et al., Science 340, 6131 (2013), arXiv:1304.6875 [astro-ph.HE] .
- Cromartie et al. (2019) H. T. Cromartie et al. (NANOGrav), Nature Astron. 4, 72 (2019), arXiv:1904.06759 [astro-ph.HE] .
- Fonseca et al. (2021) E. Fonseca et al., Astrophys. J. Lett. 915, L12 (2021), arXiv:2104.00880 [astro-ph.HE] .
- Romani et al. (2022) R. W. Romani, D. Kandel, A. V. Filippenko, T. G. Brink, and W. Zheng, (2022), arXiv:2207.05124 [astro-ph.HE] .
- Bedaque and Steiner (2015) P. Bedaque and A. W. Steiner, Phys. Rev. Lett. 114, 031103 (2015), arXiv:1408.5116 [nucl-th] .
- Tews et al. (2018) I. Tews, J. Carlson, S. Gandolfi, and S. Reddy, Astrophys. J. 860, 149 (2018), arXiv:1801.01923 [nucl-th] .
- Fujimoto et al. (2018) Y. Fujimoto, K. Fukushima, and K. Murase, Phys. Rev. D 98, 023019 (2018), arXiv:1711.06748 [nucl-th] .
- Fujimoto et al. (2020) Y. Fujimoto, K. Fukushima, and K. Murase, Phys. Rev. D 101, 054016 (2020), arXiv:1903.03400 [nucl-th] .
- Fujimoto et al. (2021) Y. Fujimoto, K. Fukushima, and K. Murase, JHEP 03, 273 (2021), arXiv:2101.08156 [nucl-th] .
- Drischler et al. (2021b) C. Drischler, S. Han, J. M. Lattimer, M. Prakash, S. Reddy, and T. Zhao, Phys. Rev. C 103, 045808 (2021b), arXiv:2009.06441 [nucl-th] .
- Drischler et al. (2022) C. Drischler, S. Han, and S. Reddy, Phys. Rev. C 105, 035808 (2022), arXiv:2110.14896 [nucl-th] .
- Al-Mamun et al. (2021) M. Al-Mamun, A. W. Steiner, J. Nättilä, J. Lange, R. O’Shaughnessy, I. Tews, S. Gandolfi, C. Heinke, and S. Han, Phys. Rev. Lett. 126, 061101 (2021), arXiv:2008.12817 [astro-ph.HE] .
- Raaijmakers et al. (2021) G. Raaijmakers, S. K. Greif, K. Hebeler, T. Hinderer, S. Nissanke, A. Schwenk, T. E. Riley, A. L. Watts, J. M. Lattimer, and W. C. G. Ho, Astrophys. J. Lett. 918, L29 (2021), arXiv:2105.06981 [astro-ph.HE] .
- Gorda et al. (2022c) T. Gorda, O. Komoltsev, and A. Kurkela, (2022c), arXiv:2204.11877 [nucl-th] .
- Coleman (1985) S. Coleman, Aspects of Symmetry: Selected Erice Lectures (Cambridge University Press, Cambridge, U.K., 1985).
- Collins et al. (1977) J. C. Collins, A. Duncan, and S. D. Joglekar, Phys. Rev. D 16, 438 (1977).
- Nielsen (1977) N. K. Nielsen, Nucl. Phys. B 120, 212 (1977).
- Note (2) Our is equivalent to defined in Ref. Gavai et al. (2005) apart from an overall constant, .
- Annala et al. (2020) E. Annala, T. Gorda, A. Kurkela, J. Nättilä, and A. Vuorinen, Nature Phys. 16, 907 (2020), arXiv:1903.09121 [astro-ph.HE] .
- Serot and Walecka (1997) B. D. Serot and J. D. Walecka, Int. J. Mod. Phys. E 6, 515 (1997), arXiv:nucl-th/9701058 .
- Bjorken (1983) J. D. Bjorken, Phys. Rev. D 27, 140 (1983).
- Appelquist et al. (1999) T. Appelquist, A. G. Cohen, and M. Schmaltz, Phys. Rev. D 60, 045003 (1999), arXiv:hep-th/9901109 .
- Zel’dovich (1961) Y. B. Zel’dovich, Zh. Eksp. Teor. Fiz. 41, 1609 (1961).
- Akmal et al. (1998) A. Akmal, V. R. Pandharipande, and D. G. Ravenhall, Phys. Rev. C 58, 1804 (1998), arXiv:nucl-th/9804027 .
- Son and Stephanov (2001a) D. T. Son and M. A. Stephanov, Phys. Rev. Lett. 86, 592 (2001a), arXiv:hep-ph/0005225 .
- Son and Stephanov (2001b) D. T. Son and M. A. Stephanov, Phys. Atom. Nucl. 64, 834 (2001b), arXiv:hep-ph/0011365 .
- Cotter et al. (2013) S. Cotter, P. Giudice, S. Hands, and J.-I. Skullerud, Phys. Rev. D 87, 034507 (2013), arXiv:1210.4496 [hep-lat] .
- Iida and Itou (2022) K. Iida and E. Itou, (2022), arXiv:2207.01253 [hep-ph] .
- Baym et al. (1971) G. Baym, C. Pethick, and P. Sutherland, Astrophys. J. 170, 299 (1971).
- Negele and Vautherin (1973) J. W. Negele and D. Vautherin, Nucl. Phys. A 207, 298 (1973).
- Rhoades and Ruffini (1974) C. E. Rhoades, Jr. and R. Ruffini, Phys. Rev. Lett. 32, 324 (1974).
- Koranda et al. (1997) S. Koranda, N. Stergioulas, and J. L. Friedman, Astrophys. J. 488, 799 (1997), arXiv:astro-ph/9608179 .
- Goriely et al. (2010) S. Goriely, N. Chamel, and J. M. Pearson, Phys. Rev. C 82, 035804 (2010), arXiv:1009.3840 [nucl-th] .
- Engvik et al. (1996) L. Engvik, G. Bao, M. Hjorth-Jensen, E. Osnes, and E. Ostgaard, Astrophys. J. 469, 794 (1996), arXiv:nucl-th/9509016 .
- Baym et al. (2019) G. Baym, S. Furusawa, T. Hatsuda, T. Kojo, and H. Togashi, Astrophys. J. 885, 42 (2019), arXiv:1903.08963 [astro-ph.HE] .
- Müther et al. (1987) H. Müther, M. Prakash, and T. L. Ainsworth, Phys. Lett. B 199, 469 (1987).
- Özel et al. (2016) F. Özel, D. Psaltis, T. Güver, G. Baym, C. Heinke, and S. Guillot, Astrophys. J. 820, 28 (2016), arXiv:1505.05155 [astro-ph.HE] .
- Riley et al. (2021) T. E. Riley et al., Astrophys. J. Lett. 918, L27 (2021), arXiv:2105.06980 [astro-ph.HE] .
- Miller et al. (2021) M. C. Miller et al., Astrophys. J. Lett. 918, L28 (2021), arXiv:2105.06979 [astro-ph.HE] .
- Linares et al. (2018) M. Linares, T. Shahbaz, and J. Casares, Astrophys. J. 859, 54 (2018), arXiv:1805.08799 [astro-ph.HE] .
- Annala et al. (2018) E. Annala, T. Gorda, A. Kurkela, and A. Vuorinen, Phys. Rev. Lett. 120, 172703 (2018), arXiv:1711.02644 [astro-ph.HE] .
- Annala et al. (2022) E. Annala, T. Gorda, E. Katerini, A. Kurkela, J. Nättilä, V. Paschalidis, and A. Vuorinen, Phys. Rev. X 12, 011058 (2022), arXiv:2105.05132 [astro-ph.HE] .
- Margalit and Metzger (2017) B. Margalit and B. D. Metzger, Astrophys. J. Lett. 850, L19 (2017), arXiv:1710.05938 [astro-ph.HE] .
- Shibata et al. (2017) M. Shibata, S. Fujibayashi, K. Hotokezaka, K. Kiuchi, K. Kyutoku, Y. Sekiguchi, and M. Tanaka, Phys. Rev. D 96, 123012 (2017), arXiv:1710.07579 [astro-ph.HE] .
- Rezzolla et al. (2018) L. Rezzolla, E. R. Most, and L. R. Weih, Astrophys. J. Lett. 852, L25 (2018), arXiv:1711.00314 [astro-ph.HE] .
- Ruiz et al. (2018) M. Ruiz, S. L. Shapiro, and A. Tsokaros, Phys. Rev. D 97, 021501 (2018), arXiv:1711.00473 [astro-ph.HE] .
- Gavai et al. (2005) R. V. Gavai, S. Gupta, and S. Mukherjee, Phys. Rev. D 71, 074013 (2005), arXiv:hep-lat/0412036 .