NGC 1358 monitoring
Compton-Thick AGN in the NuSTAR era VIII: A joint NuSTAR-XMM-Newton monitoring of the changing-look Compton-thick AGN NGC 1358
Abstract
We present the multi-epoch monitoring with NuSTAR and XMM-Newton of NGC 1358, a nearby Seyfert 2 galaxy whose properties made it a promising candidate X-ray changing-look active galactic nucleus (AGN), i.e., a source whose column density could transition from its 2017 Compton-thick (CT–, having line-of-sight Hydrogen column density N1024 cm-2) state to a Compton-thin (N1024 cm-2) one. The multi-epoch X-ray monitoring confirmed the presence of significant NH,los variability over time-scales from weeks to years, and allowed us to confirm the “changing-look” nature of NGC 1358, which has most recently been observed in a Compton-thin status. Multi-epoch monitoring with NuSTAR and XMM-Newton is demonstrated to be highly effective in simultaneously constraining three otherwise highly degenerate parameters: the torus average column density and covering factor, and the inclination angle between the torus axis and the observer. We find a tentative anti-correlation between column density and luminosity, which can be understood in the framework of Chaotic Cold Accretion clouds driving recursive AGN feedback. The monitoring campaign of NGC 1358 has proven the efficiency of our newly developed method to select candidate NH,los–variable, heavily obscured AGN, which we plan to soon extend to a larger sample to better characterize the properties of the obscuring material surrounding accreting supermassive black holes, as well as constrain AGN feeding models.
[0.45em]0.2em0.2em\thefootnotemark
1 Introduction
Obscuration in active galactic nuclei (AGNs) has been largely studied over the electromagnetic spectrum, from the optical (e.g., Lawrence, 1991; Simpson, 2005), to the infrared (e.g., Jaffe et al., 2004; Nenkova et al., 2008a; Feltre et al., 2012), and to the X-rays (Gilli et al., 2007; Ricci et al., 2015; Hickox & Alexander, 2018). It is commonly accepted that the obscuration is mostly caused by a “dusty torus”, i.e., a distribution of molecular gas and dust located at 1–10 pc from the accreting supermassive black hole (SMBH). While the existence of this obscuring material is universally accepted, its geometrical distribution and chemical composition are still a matter of debate. Several works reported observational evidence favoring a “clumpy torus” scenario, where the obscuring material is distributed in clumps formed by optically thick clouds (e.g., Jaffe et al., 2004; Nenkova et al., 2008a; Elitzur & Shlosman, 2006; Risaliti et al., 2007; Hönig & Beckert, 2007; Burtscher et al., 2013). Theoretical/numerical models of accretion onto SMBHs also predict a highly clumpy and chaotic multi–phase medium (Gaspari et al. 2013, 2017, 2020 for a review), in particular within 100 pc of the AGN, where Chaotic Cold Accretion (CCA) is expected to boost the feeding rates. Such CCA ‘rain’ has been now observationally probed in many systems and bands spanning from X-ray to optical/IR and radio (e.g., Rose et al. 2019; Gaspari et al. 2019; Maccagni et al. 2021; McKinley et al. 2022; Olivares et al. 2022; Temi et al. 2022).
If the obscuring environment is indeed inhomogeneous, one would expect to observe significant variability in the obscuring material line-of-sight (l.o.s.) column density (NH,los) and even, in some cases, a transition from a Compton-thick (CT-) scenario (where NH,los1024 cm-2) to a Compton-thin one (where NH,los1024 cm-2). This transition should occur in a period of time as short as a day and as long as several months, assuming a typical range of obscuring clouds filling factors, velocities and distances from the accreting BH (e.g, Nenkova et al., 2008a). However, the number of bona fide CT-AGN with high-quality X-ray data is limited (35 sources, see, e.g., Arévalo et al., 2014; Baloković et al., 2014; Koss et al., 2015; Masini et al., 2016; Oda et al., 2017; Marchesi et al., 2018, 2019; Torres-Albà et al., 2021; Traina et al., 2021; Zhao et al., 2021), and only a small fraction of these objects have multi-epoch observations on time-scales that vary from weeks to years, which are key to properly assess any variation in NH,los and/or flux. Consequently, only a few sources have been observed to transition from Compton-thick to Compton-thin: NGC 1365 (Risaliti et al., 2005); NGC 7582 (Bianchi et al., 2009; Rivers et al., 2015); Mrk 3 (Guainazzi et al., 2012); NGC 454 (Marchese et al., 2012), ESO 323-G77 (Miniutti et al., 2014); IC 751 (Ricci et al., 2016).
This class of “X-ray changing-look sources” is the ideal NH,los–variable sample to study the properties of the obscuring material in a complete, self-consistent way. In fact, Compton-thick to Compton-thick NH,los transitions are difficult to reliably measure with small enough uncertainties to enable the estimate of the SMBH-cloud distance from NH,los, since at column densities above 2–31024 cm-2 almost all photons at energies 10–20 keV are absorbed by the obscuring material (see, e.g., Koss et al., 2016). In less obscured AGN (NH,los1023 cm-2), instead, the NH,los variability can be measured with excellent precision. However, in this class of objects the overall X-ray emission is dominated by the transmitted main component: consequently, it is difficult to accurately measure the obscuring material properties linked to the reprocessed emission, such as the covering factor and the average column density. Consequently, the limited sample size of currently available X-ray changing-look AGNs prevents us from getting a complete picture of the properties of the obscuring material surrounding accreting SMBHs.
In this paper, we present the result of a multi-epoch monitoring of the nearby CT-AGN NGC 1358, a Seyfert 2 galaxy whose properties make it a promising “changing-look” candidate and an ideal pilot source to start the X-ray characterization of the obscuring material in nearby accreting SMBHs. The work is organized as follows: in Section 2 we present the source, with a particular focus on previous X-ray works. In Section 3 we present the data analysis and results of the joint spectral fitting for the new and old NuSTAR and XMM-Newton observations. We then discuss in Section 4 how the results of the X-ray monitoring can be explained in the framework of a “clumpy obscuration” model. Finally, we summarize the results of our work in Section 5.
Through the rest of the work, we assume a flat CDM cosmology with H0=69.6 km s-1 Mpc-1, =0.29 and =0.71 (Bennett et al., 2014). Errors are quoted at the 90 % confidence level, unless otherwise stated.
2 NGC 1358
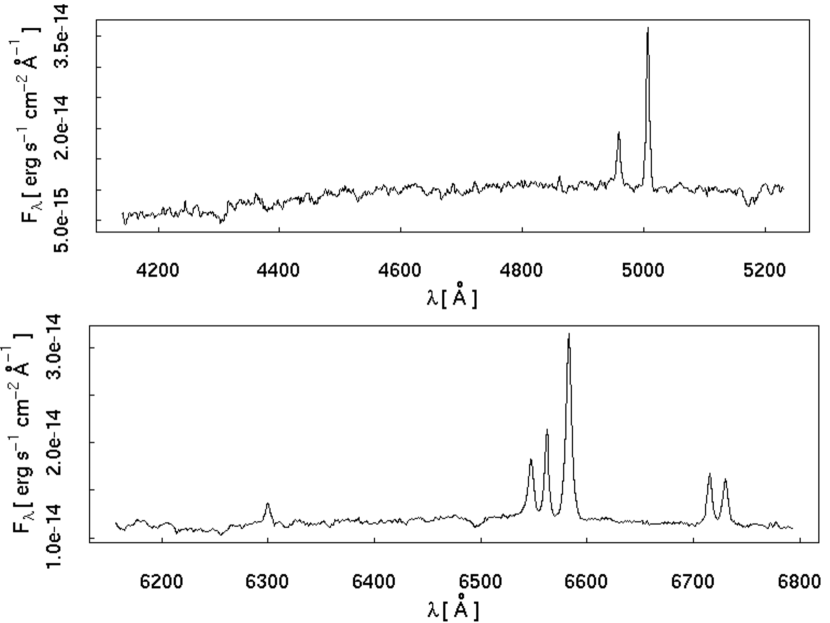
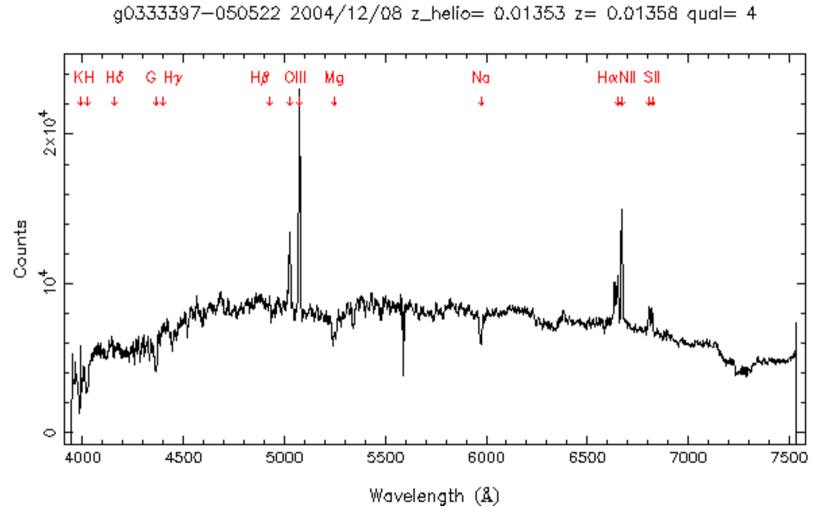
NGC 1358 is a nearby (=0.01344 Theureau et al., 1998), X-ray bright (having 15–150 keV observed flux f510-12 erg s-1 cm-2) Seyfert 2 galaxy. The source was originally classified as a narrow-line (NL) Seyfert 2 source in Filippenko & Sargent (1985) using the Double Spectrograph mounted on the Palomar 200-inch Hale Telescope. A new optical spectrum of NGC 1358 was then taken in 2004 within the 6dF Galaxy Survey, using the multi-object spectrograph mounted on the 1.2 m UK Schmidt Telescope (Jones et al., 2009), and no evidence for optical variability with respect to the Filippenko & Sargent (1985) spectrum is observed, thus confirming the NL nature of the source. We report both optical spectra in Figure 1. More recently, Mason et al. (2015) reported that the NIR spectrum of NGC 1358, obtained using the GNIRS spectrograph mounted on the Gemini North 8m telescope “only contain[ed] a handful of weak emission lines” (see Fig. Figure 1, bottom panel). No evidence for a significant optical “changing-look” behavior has therefore ever been observed in NGC 1358.

In the X-rays, NGC 1358 is detected in the Swift (Gehrels et al., 2004) Burst Alert Telescope (BAT Barthelmy et al., 2005) 150-month catalog (K. Iman et al. in prep111An online version of the catalog is available at https://science.clemson.edu/ctagn/bat-150-month-catalog/.) and has been targeted several times by X-ray telescopes222While NGC 1358 has been observed multiple times by Swift-XRT, none of the observations has enough counts to perform a spectral fit. We therefore do not include the Swift-XRT observations in this work.. A first 10 ks XMM-Newton observation was taken in 2005 and analyzed in Marinucci et al. (2012). They determined that NGC 1358 is heavily obscured, and potentially a Compton-thick AGN, but the low data quality made their l.o.s. column density poorly constrained (NH,los=1.3 1024 cm-2). A second observation was performed by Chandra in November 2015: the joint fit of the Chandra spectrum with the Swift-BAT 100-month one is reported in Marchesi et al. (2017). The source was once again found to be heavily obscured, having NH,los=1.0 1024 cm-2. However, while a physically self-consistent spectral model such as MYTorus (Murphy & Yaqoob, 2009) was used to perform the fit, the limited count statistic (100 net counts in the 0.5–7 keV band) of the Chandra spectrum did not allow for a reliable characterization of the obscuring material’s physical and geometrical properties.
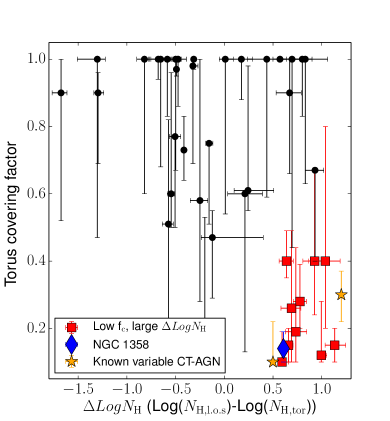
For this reason, NGC 1358 was subsequently targeted by a joint NuSTAR and XMM-Newton observation performed in August 2017, whose results are reported in Zhao et al. (2019). The high count statistic in the 0.5–70 keV band obtained in this deep observation (4500 net counts, 50 % of which detected by NuSTAR in the 3–50 keV band) made it possible to use models that self-consistently characterize AGN obscuration in X-ray spectra, such as MYTorus (Murphy & Yaqoob, 2009; Yaqoob, 2012; Yaqoob et al., 2015) and borus02 (Baloković et al., 2018). In particular, borus02 measures important physical and geometric parameters such as the obscuring material l.o.s. column density, its average column density (see Section 3.2.1 for more details on this quantity), and its covering factor, among others. NGC 1358 was found to have: ) l.o.s. column density, NH,los=2.41024 cm-2, well above the CT threshold, at a 3 confidence level; ) Compton-thin average column density, NH,tor=6.51023 cm-2, i.e., 4 times smaller than the l.o.s. column density; ) low covering factor (0.15). The large NH ((NH,los)-(NH,tor)0.6) measured in NGC 1358, combined with its low suggests that this source is a promising candidate “clumpy-torus” CT-AGN, where the obscuring material is distributed in clumps at the micro- to meso-scale (i.e., within a few pc from the SMBH, Gaspari et al., 2020), rather than uniformly. Notably, the large NH measured using borus02 was independently confirmed using MYTorus in its “decoupled” configuration (Yaqoob, 2012; Yaqoob et al., 2015), which allows one to independently measure NH,los and NH,tor.
Based on the above-mentioned observational evidence, NGC 1358 is likely to have been observed through an over-dense region embedded in a significantly less dense environment. In such a scenario, the small covering factor measured with borus02 would imply that the overall cloud volume filling factor is small, and the obscuring clouds occupy only a fractional part of the pc-scale region that surrounds the accreting SMBH where the obscuration is expected to take place. Sources with this type of “low covering factor” obscurer are ideal candidate X-ray changing-look AGN. In objects with large , instead, the number of clouds between the observer and the SMBH is expected to always be 1, thus significantly reducing the chance of observing a significant change in NH,los. Notably, at least two CT-AGN fulfill the proposed selection criteria and are known to be variable. NGC 4945 has been shown to vary significantly even above 10 keV, likely because of a combination of intrinsic luminosity and l.o.s. column density variability (Puccetti et al., 2014), while the l.o.s. column density of the material surrounding MRK 3 has been measured at both CT and Compton-thin levels in the past years (see, e.g., Guainazzi et al., 2012; Yaqoob et al., 2015). We highlight both these sources in Figure 2.
To confirm the clumpy nature of its circumnuclear material, NGC 1358 has been selected for a long-term monitoring campaign with NuSTAR and XMM-Newton, aimed at detecting significant flux and variability. A joint NuSTAR–XMM-Newton monitoring campaign is the best (if not the only) possible approach to constrain the properties of the obscuring material surrounding accreting SMBHs. XMM-Newton alone would not be able to detect potential variability above 10 keV, which can be linked to a variation in the covering factor (see, e.g., Puccetti et al., 2014; Zaino et al., 2020, on the variability above 10 keV observed in the nearby CT sources NGC 4945 and NGC 1068, respectively). Furthermore, high-quality data at E10 keV are key to break the NH,los-photon index degeneracy in heavily obscured sources (see, e.g., Marchesi et al., 2019). NuSTAR, however, has a 4 times lower energy resolution than XMM-Newton at 6.4 keV, around the Fe K line region, and does not cover the energy range 3 keV which is required to tightly constrain NH,l.o.s. and, consequently, the AGN intrinsic luminosity.
Among the promising changing-look candidates with low- and large reported in Marchesi et al. (2019, see also the red points in Figure 2), the tentative evidence for l.o.s. column density variability between the 2015 and 2017 observations further strengthens a “clumpy obscuration” scenario for NGC 1358. This makes it an ideal pilot source to start the X-ray characterization of a whole class of “clumpy obscuration” CT-AGNs.
| Instrument | Sequence | Start Time | End Time | Exposure | Net count rate |
|---|---|---|---|---|---|
| ObsID | (UTC) | (UTC) | ks | 10-2 counts s-1 | |
| XMM-Newton | 0795680101 | 2017-08-01T17:05:27 | 2017-08-02T06:03:10 | 48; 48; 48 | 0.980.05; 0.910.05; 3.680.15 |
| NuSTAR | 60301026002 | 2017-08-01T03:41:09 | 2017-08-02T06:36:09 | 50 | 2.320.07; 2.280.07 |
| XMM-Newton | 0862980101 | 2021-02-25T00:25:39 | 2021-02-25T10:30:39 | 33; 33; 24 | 1.260.06; 1.490.07; 7.340.18 |
| XMM-Newton | 0890700101 | 2021-08-02T17:10:55 | 2021-08-03T01:19:15 | 24; 24; 17 | 1.800.09; 1.510.08; 9.970.25 |
| NuSTAR | 60702044002 | 2021-08-02T16:21:09 | 2021-08-03T09:31:09 | 31 | 12.760.22; 11.780.22 |
| XMM-Newton | 0890700201 | 2022-01-21T05:11:06 | 2022-01-21T14:06:32 | 32; 32; 26 | 2.390.09; 2.520.09; 11.640.22 |
| NuSTAR | 60702044004 | 2022-01-21T06:46:09 | 2022-01-22T00:16:09 | 32 | 16.560.24; 15.760.23 |
| XMM-Newton | 0890700301 | 2022-02-04T10:20:38 | 2022-02-04T18:07:18 | 25; 25; 18 | 1.910.09; 2.080.09; 9.430.23 |
| NuSTAR | 60702044006 | 2022-02-03T07:21:09 | 2022-02-03T21:31:09 | 28 | 16.720.26; 16.240.26 |
3 Data analysis and spectral fitting results
In this work, we analyze four XMM-Newton and three NuSTAR observations that were taken between February 2021 and February 2022. The first XMM-Newton observation (nominal length: 36 ks) was taken as part of the XMM-Newton proposal 086298 (PI: S. Marchesi), while the remaining three XMM-Newton observations (nominal length: 30 ks) and the NuSTAR ones (30 ks) are part of a NuSTAR observing program (proposal ID: 07192; PI: S. Marchesi). We report a summary of these observations in Table 1. In the rest of the paper, all the quoted errors are computed at the 90 % confidence level for a single parameter of interest.
3.1 Data reduction
The NuSTAR data are obtained from both focal plane modules, FPMA and FPMB. We calibrated, cleaned, and screened the raw files using the NuSTAR nupipeline script version 2.1.1. The NuSTAR calibration database (CALDB) used in this work is the version 20210210. We then generated the ARF, RMF, and light-curve files with the nuproducts script. Both source and background spectra were extracted from a 60′′–radius circle: this choice of radius was found to maximize the signal-to-noise ratio in the source spectra. The background spectra are extracted from a region nearby the source which is not affected by emission from NGC 1358 or other bright objects. Finally, the spectra are binned with a minimum of 15 counts per bin using the grppha task.
The XMM-Newton observations taken in August 2021 and January 2022 were performed quasi-simultaneously to the NuSTAR ones, the start– and end–times of each pair observations being always less than 12 hours apart (see Table 1). The February 2022 one has instead been taken 1 day after the NuSTAR one, thus allowing us to perform a further variability study (as discussed in Section A.4). We reduced the XMM-Newton data using the Science Analysis System (SAS Jansen et al., 2001) version 19.1. The August 2021 and February 2022 observations were affected by strong flares, so the net exposure time is 10–20 % (30–50 %) shorter than the nominal one for the MOS (pn) cameras. The MOS (pn) source spectra were extracted from a 10′′ (15′′) –radius circle, while the background spectra are extracted from a 45′′–radius circle located nearby NGC 1358 and in a region with no significant contamination from other sources.
3.2 Spectral modeling
To avoid possible model–dependent effects, we analyze the NuSTAR and XMM-Newton spectra using three different physically motivated models which have been developed specifically to treat the X-ray spectra of heavily obscured AGN: we report a summary of their properties in Table 2. Two of these models assume that the obscuring material is uniformly distributed in a toroidal shape, while the third one works under the assumption that the obscuring material is distributed in clumps.
| Model | Reference(s) | Material distribution | Morphology | Free parameters |
|---|---|---|---|---|
| MYTorus | Murphy & Yaqoob (2009) | Uniform | Toroidal | , NH,los NH,tor, |
| Yaqoob (2012) | ||||
| Yaqoob et al. (2015) | ||||
| borus02 | Baloković et al. (2018) | Uniform | Sphere with | , NH,los , NH,tor, |
| biconical cutout | ||||
| UXCLUMPY | Buchner et al. (2019) | Clumpy | As proposed in | , NH,los , TOR, CTK |
| Nenkova et al. (2008a) |
3.2.1 Uniform torus models
The first model we use in our analysis is MYTorus (Murphy & Yaqoob, 2009; Yaqoob, 2012; Yaqoob et al., 2015), which we use in its so-called “decoupled” configuration, where the line-of-sight column density, NH,los, can in principle be different from the (volume) average column density, NH,tor. MYTorus works under the assumption that the obscuration in AGN is caused by a torus with circular cross section, having half-opening angle =60, where is computed starting from the torus axis. This means that in MYTorus the torus covering factor is not a free parameter and is fixed to =cos()=0.5.
MYTorus is made of three separate components. In XSpec (Arnaud, 1996) the model is written as follows:
| (1) | |||
where is the absorption due to our own Galaxy, =3.831020 cm-2 (Kalberla et al., 2005). The first MYTorus component, , is an absorber applied to the direct continuum (modeled with a power law, ) and is used to model the line-of-sight absorption NH,los, the one caused by the material between the observer and the accreting SMBH. The second component, , models the so-called reprocessed (or scattered) emission, those photons that end up in the observer line of sight after being up-scattered by the gas surrounding the AGN. Consequently, the column density of this component can be treated as a good approximation of the average torus column density, NH,tor. Finally, the third component, , models two typical fluorescence lines observed in AGN spectra, the Iron K and K lines at 6.4 keV and 7.06 keV, respectively. The relative intensity of the reprocessed component and of the fluorescence lines with respect to the main power law is described by a constant, AS. This constant takes into account the time delay between the main component intrinsic emission and the reprocessed one, which can therefore vary in intensity due to the well known AGN variability. Furthermore, AS can give some loose indication on the actual torus covering factor, since at higher covering factors corresponds a larger intensity of the reprocessed component at energies 6 keV (see, e.g., Figure A1 in Zhao et al., 2020).
In MYTorus decoupled the inclination angle of the reprocessed component and the fluorescence lines can be fixed to one of two values: 90° or 0°. The 90° scenario is one where most of the reprocessed emission comes from material which is located between the accreting SMBH and the observer, while the 0° scenario is a “back–reflection” one, where most of the reprocessed emission is coming from the material located on the back side of the torus with respect to the observer perspective. In this paper, we test both the configurations separately.
The second model we adopt for our analysis is borus02 (Baloković et al., 2018). borus02 works under the assumption that the shape of the obscuring material responsible for the reprocessed emission (including the Iron K line) is a uniform-density sphere with two conical polar cutouts. The opening angle of these cutouts is a free parameter of the model.
In XSpec the model is written as follows:
| (2) | |||
The torus covering factor varies in the range =[0.1–1] (i.e., in a range of opening angles =[0–84]°). borus02 also includes as a free parameter the torus inclination angle , which is the angle between the observer and the torus axis. The l.o.s. column density is modelled using the and components.
Finally, as shown in Equations 1 and 2, our modelling includes three further components for both the MYTorus and the borus02 analysis. The first one is a cross-normalization constant between the XMM-Newton and the NuSTAR observations, , to model possible calibration offsets between the two instruments. Indeed, in all observations and with all models we find a cross-normalization 1.1–1.15, in agreement with previous results reported in the literature (e.g., Madsen et al., 2017; Osorio-Clavijo et al., 2020; Baloković et al., 2021). In principle, there can be variability even between different cameras on the same instrument (MOS versus pn in XMM-Newton; FPMA versus FPMB in NuSTAR). However, we find that no additional cross-instrument components are required in our analysis, since when included in our fit they are always consistent with 1.
The second component is a secondary power law, , that treats the fraction of emission which is not affected by obscuration: this fractional value is parameterized with the constant . Finally, NGC 1358 presents diffuse X-ray emission below 1 keV, which we model with a phenomenological thermal component mekal, where both the gas temperature and metallicity are left free to vary.
3.2.2 Clumpy torus model
Buchner et al. (2019) presented UXCLUMPY333Which can be downloaded at the following link: https://github.com/JohannesBuchner/xars/blob/master/doc/uxclumpy.rst, an X-ray spectral model which assumes that the AGN obscuration is caused by a clumpy distribution of material. More in detail, in UXCLUMPY the obscuring material is axi-symmetric, and the number of clouds between the observer and the accreting SMBH is
| (3) |
where is the number of clouds on the equatorial plane, is the inclination angle towards the torus pole, and TOR is the obscuring material angular width, which models the torus scale height and is a free parameter in the model. The clouds angular size distribution is exponential and centered at =1, and the size of a single cloud is =sin(), where is the distance between the cloud and the SMBH (Nenkova et al., 2008a, b). Notably, UXCLUMPY (and more in general models where the obscuring material is assumed to be clumpy) allows one to set up a varying NH,los scenario while keeping the obscurer geometry self-consistent.
Finally, UXCLUMPY includes an inner ring of Compton-thick material, whose covering factor CTK is a free parameter in the model. This additional component mimics a “reflection mirror” which is needed to model an excess of reprocessed emission observed in some low–, heavily obscured AGNs (Buchner et al., 2019) and can be linked, for example, to a “warped disk” obscurer (Buchner et al., 2021). In XSpec, the model is written as follows:
| (4) |
where models both the transmitted and the reflected component (including the fluorescent lines), while models the so-called “warm mirror emission”, which is the emission scattered, rather than absorbed by the obscuring material. The parameters of and are linked. , , and are the same components described in Section 3.2.1.
3.3 Evolution with time of the torus properties
For consistency with previous works, and to test how joint multi-epoch spectral fitting can tighten the constraints on the spectral parameters, we performed a single-epoch spectral fit for each of the new observations reported in Table 1. We report a detailed description of these fits in Appendix A.
As discussed in Baloković et al. (2018, 2021) and, more recently, in Saha et al. (2022), however, the simultaneous fit of multi-epoch X-ray spectra is the most efficient way to reduce the uncertainties on the different spectral parameters and break degeneracies between them. In particular, the multi-epoch fitting approach is key to put tight constraints on the torus covering factor, its average column density, and the inclination angle between the torus axis and the observer, three parameters that can be highly degenerate in single-epoch observations.
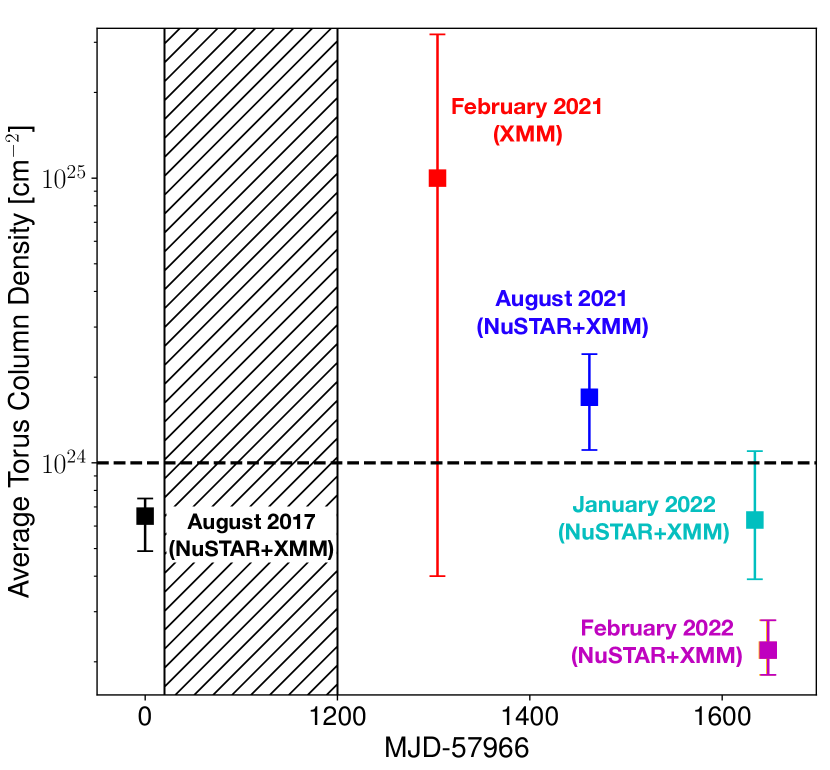
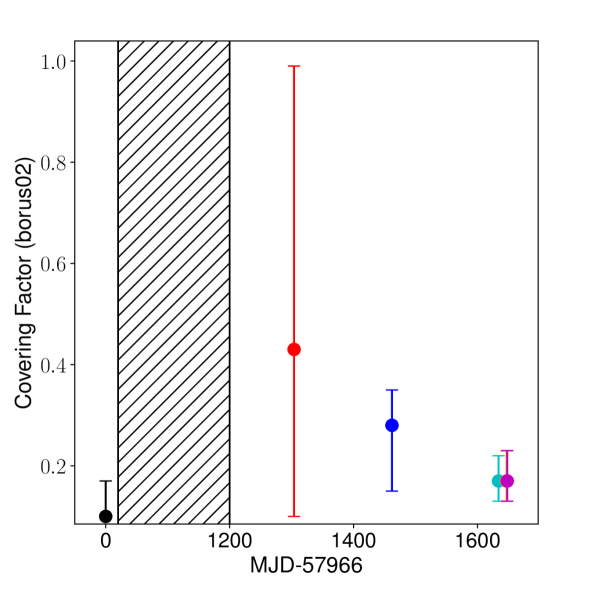
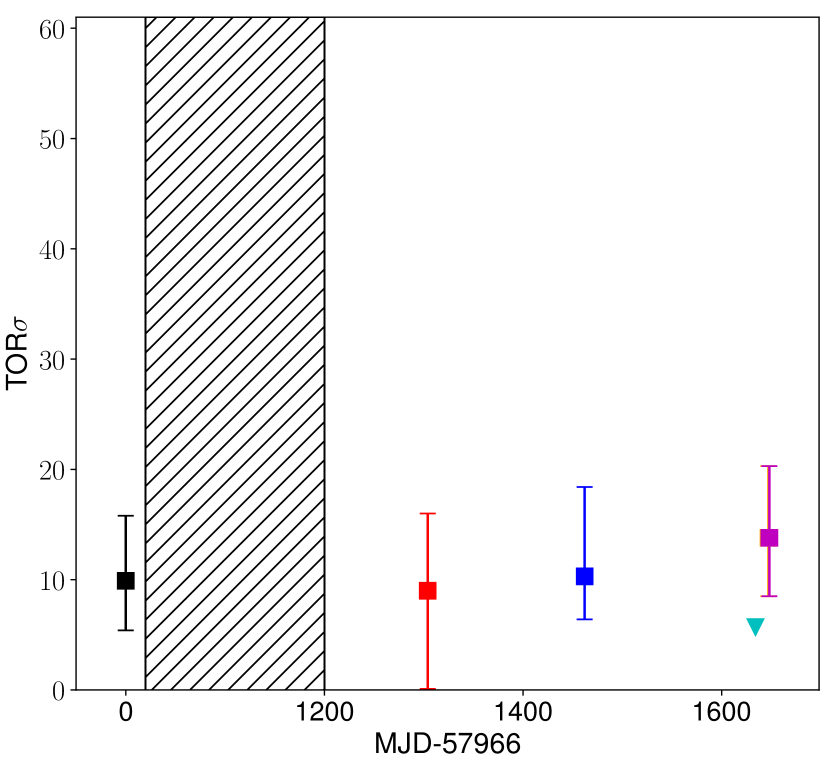
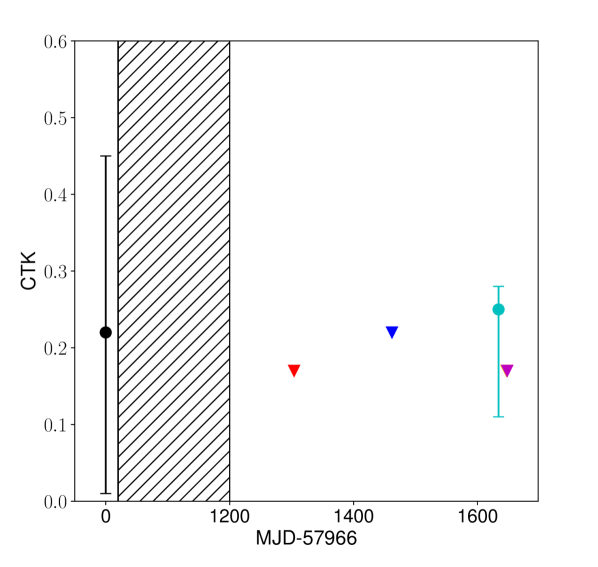
To further clarify the importance of multi-epoch observations, we report in Figure 3 four spectral parameters computed in each of the five single-epoch observations performed between August 2017 and February 2022. We also note that the inclination angle between the observer and the torus axis is loosely constrained, if not fully unconstrained, in all single-epoch observations. Two of the parameters shown in the Figure are computed using borus02: the torus average column density (top left) and covering factor (top right). The other two are computed using UXCLUMPY: the obscuring material scale height (bottom left) and the covering factor of the inner reflector (bottom right).
A first clear evidence is that XMM-Newton observations alone are not effective in reliably constraining these parameters. More importantly, while both UXCLUMPY parameters are consistent, within the uncertainties, in each of the five epochs, both borus02 parameters show evidence for variability. In particular, the variability in NH,tor is found to be fairly large, varying in the range logNH,tor=[23.3–24.2]. Such a disagreement between the single-epoch measurements should not be treated physically, given that the overall amount of material in the obscurer is not expected to vary in time-scales of months. Rather, this result suggests that a uniform torus model is less efficient than a clumpy torus one in modelling the X-ray emission of NGC 1358, a result consistent with the idea that in this source the obscuring material surrounding the accreting SMBH is distributed in highly inhomogeneous clumps.
| MYTorus | MYTorus | borus02 | UXCLUMPY | |||||
|---|---|---|---|---|---|---|---|---|
| decoupled, 0 | decoupled, 90 | |||||||
| Best-fit | % ErrM-S | Best-fit | % ErrM-S | Best-fit | % ErrM-S | Best-fit | % ErrM-S | |
| /dof | 2520.7/2457 | – | 2513.8/2457 | – | 2518.2/2457 | – | 2547.7/2457 | – |
| 1.54 | 50 % | 1.54 | 50 % | 1.45 | 75 % | 1.58 | 55 % | |
| NH,los 2017–08–01 [1024 cm-2] | 1.68 | 45 % | 1.87 | 60 % | 1.64 | 70 % | 1.49 | 60 % |
| NH,los 2021–02–25 [1024 cm-2] | 1.21 | 60 % | 1.26 | 65 % | 1.34 | 60 % | 1.02 | 50 % |
| NH,los 2021–08–02 [1024 cm-2] | 0.87 | 20 % | 0.88 | 50 % | 0.87 | 60 % | 0.85 | 30 % |
| NH,los 2022–01–21 [1024 cm-2] | 0.71 | 30 % | 0.71 | 40 % | 0.70 | 60 % | 0.70 | 30 % |
| NH,los 2022–02–03 [1024 cm-2] | 0.74 | 30 % | 0.75 | 40 % | 0.73 | 60 % | 0.72 | 25 % |
| NH,los 2022–02–04 [1024 cm-2] | 0.76 | 40 % | 0.77 | 55 % | 0.80 | 55 % | 0.74 | 10 % |
| NH,tor [1024 cm-2] | 0.56 | 80 % | 0.36 | 75 % | 0.35 | 85 % | … | |
| AS | 0.21 | 50 % | 0.40 | 85 % | … | … | … | … |
| … | … | … | … | 0.17 | 70 % | … | … | |
| [∘] | … | … | … | … | 87f | – | 90f | – |
| TOR [∘] | … | … | … | … | … | … | 15.3 | 60 % |
| CTK | … | … | … | … | … | … | 0.10 | 30 % |
| 10-2 | 0.10 | 55 % | 0.16 | 60 % | 0.12 | 75 % | 0.28 | 20 % |
| [keV] | 0.63 | 75 % | 0.61 | 70 % | 0.65 | 45 % | 0.65 | 70 % |
| / | 0.05 | 80 % | 0.08 | 95 % | 0.05 | 95 % | 0.05 | 60 % |
| log(L2-10) 2017–08–01 [erg s-1] | 42.90 | – | 42.93 | – | 42.74 | – | 42.75 | – |
| log(L10-40) 2017–08–01 [erg s-1] | 43.74 | – | 43.38 | – | 43.11 | – | 42.93 | – |
| log(L2-10) 2021–02–25 [erg s-1] | 43.04 | – | 42.89 | – | 43.02 | – | 42.77 | – |
| log(L2-10) 2021–08–02 [erg s-1] | 42.96 | – | 42.96 | – | 42.93 | – | 42.91 | – |
| log(L10-40) 2021–08–02 [erg s-1] | 43.79 | – | 43.67 | – | 43.77 | – | 43.15 | – |
| log(L2-10) 2022–01–21 [erg s-1] | 42.99 | – | 42.98 | – | 42.91 | – | 42.95 | – |
| log(L10-40) 2022–01–21 [erg s-1] | 43.86 | – | 43.63 | – | 43.64 | – | 43.18 | – |
| log(L10-40) 2022–02–03 [erg s-1] | 43.55 | – | 43.45 | – | 43.53 | – | 43.21 | – |
| log(L2-10) 2022–02–04 [erg s-1] | 42.94 | – | 42.93 | – | 42.93 | – | 42.89 | – |
.
3.4 Joint multi-epoch fit
Given the limitations of a single-epoch fitting that we highlighted in the previous section, we performed a simultaneous fit of the NuSTAR and XMM-Newton spectra derived from the observations taken between August, 2017, and February, 2022, with the goal of reducing the parameters uncertainties and breaking cross-parameter degeneracies. We included in our models a cross-observation normalization to account for any flux variability not related to NH,los, and left the l.o.s. column density free to vary in each of the six epochs: we assumed two independent NH,los and normalization values for the NuSTAR and XMM-Newton observations taken on February 3 and 4. We then fit the spectra assuming no intra-epoch variability for all the other parameters: the power law photon index , the scattered fraction , the average torus column density (in MYTorus and borus02), the torus covering factor (in borus02 and UXCLUMPY).

We report in Table 3 the results of the multi-epoch fit, as well as the fractional variation of the uncertainties on the parameters with respect to the single-epoch results. The increase in count statistics and the use of multi-epoch data strongly reduce the uncertainties on all parameters. For example, the errors on the NH,los values measured in the different epochs decrease by 10–50 % in MYTorus and UXCLUMPY and up to 80 % in borus02. We also measure significant reductions on the uncertainties of the average torus column density (10-50 % in MYTorus; 80 % in borus02) and in the torus covering factor (30-50 % in UXCLUMPY; 70 % in borus02). Finally, the uncertainties on the power law photon index decrease by 30–70 %. We note that the borus02 best-fit photon index (=1.45) is close to the model lower boundary (=1.4), another possible indirect evidence for the limitations of a uniform torus model to describe the NGC 1358 obscurer.
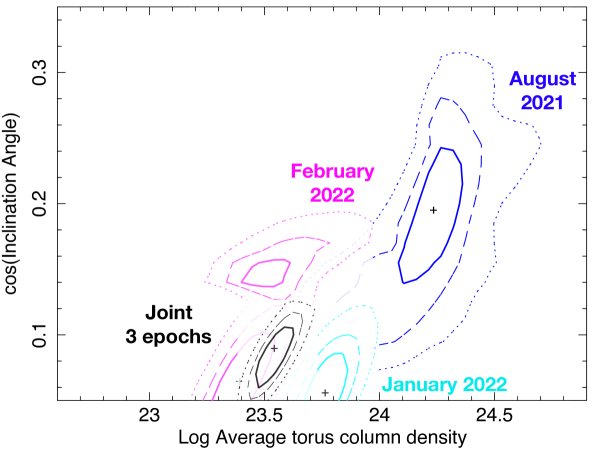
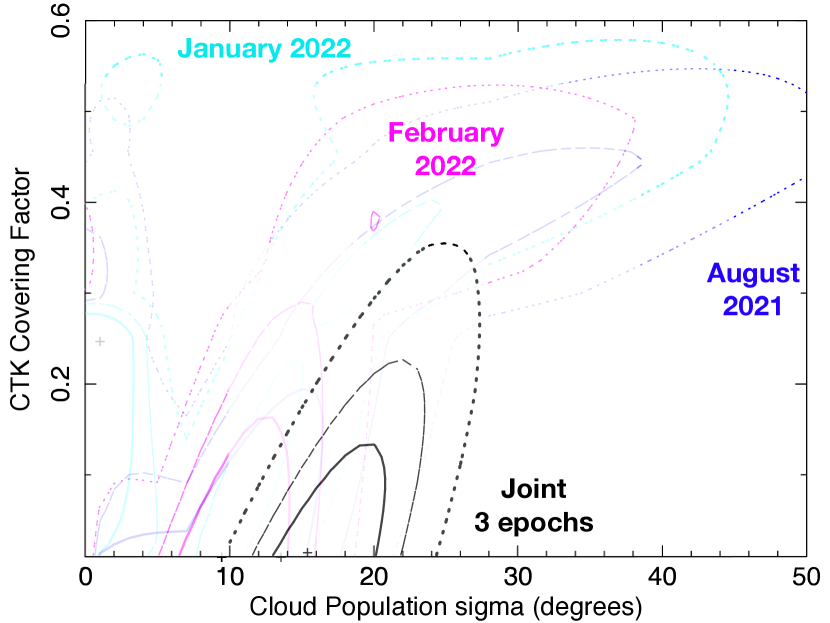
In Figure 4 we report the comparison between single– and multi–epoch 68–90–99 % confidence contours of the torus covering factor and inclination angle as function of the average torus column density, as measured using borus02, and of the torus vertical extent and inner ring covering factor, as measured with UXCLUMPY. For computational reasons, the multi-epoch contours have been computed using only the joint NuSTAR and XMM-Newton observations taken between August, 2021, and February, 2022 (i.e., the February, 2021, and August, 2017 observations are not included in the computation of the multi–epoch contours). For consistency, we thus compare these multi-epoch contours with the single-epoch ones obtained in the three set of observations.
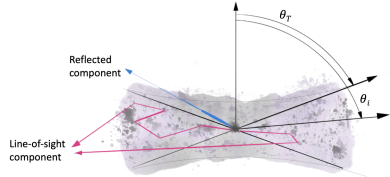
For all three pairs of parameters, the multi–epoch fit allows one to break infra-parameter degeneracies and reliably confirm the “low covering factor, Compton-thin average torus column density” scenario. Furthermore, the left and central plots once again highlight how single-epoch observations with borus02 can produce inconsistent NH,tor measurements, as we discussed in the previous section. In the multi-epoch fit, instead, we measure with borus02 a Compton-thin average column density, logNH,tor=23.50.1 and a covering factor =0.170.02; the inclination angle is consistent with an “edge on view” scenario, being 83. We measure the same average torus column density using MYTorus decoupled in its 90 configuration: when using the 0 configuration, we measure a slightly larger average column density, but the uncertainties are also significantly larger (logNH,tor=24.0). Finally, with UXCLUMPY we measure a cloud vertical extent TOR=15.3 and an upper limit on the covering factor of the inner CT ring CTK0.10, once again confirming the low– scenario. We report in Figure 5 a sketch of the NGC 1358 obscuring torus, based on this best-fit results.
4 Characterizing the obscuring material in NGC 1358
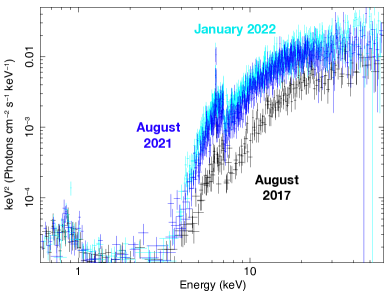
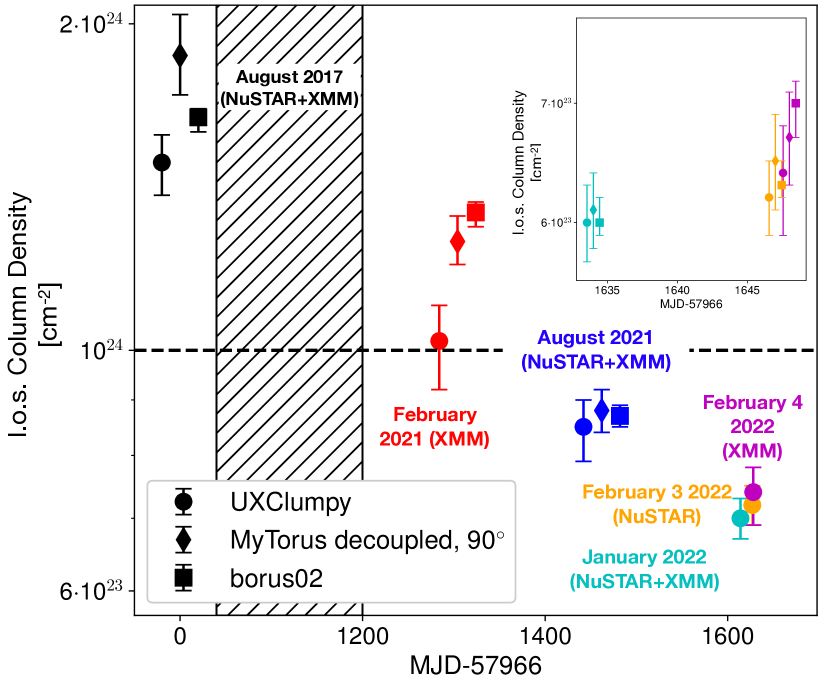
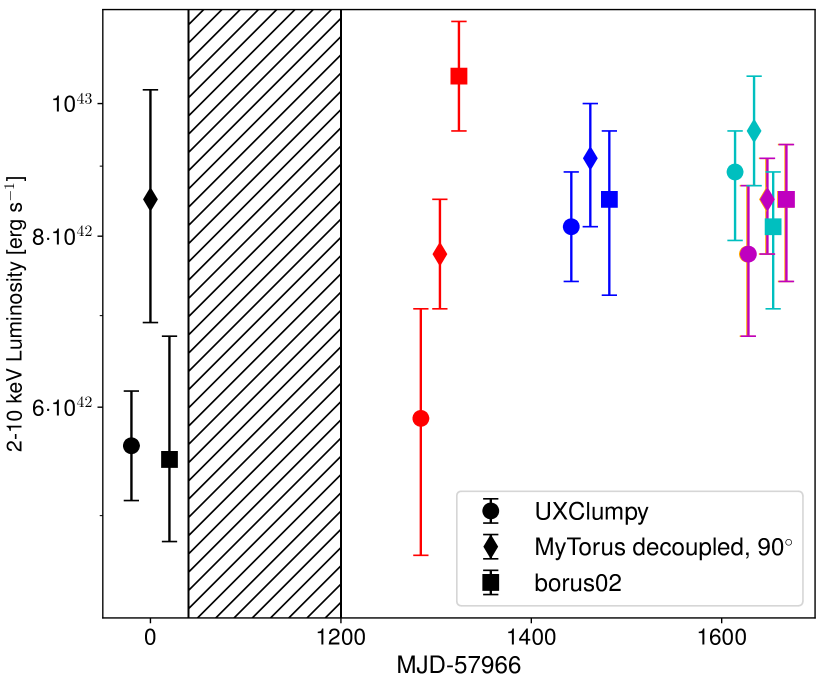
We report in Figure 6 the joint NuSTAR and XMM-Newton spectra of NGC 1358 taken in August 2017, August 2021 and January 2022. The August 2017 spectrum is significantly fainter than the other two over the 2–60 keV range. A minor, but still notable difference is also observed between the August 2021 and the January 2022 observation, the second being brighter. To better quantify this variability between observations, and break the NH,los–luminosity degeneracy, we report in Figure 7 the evolution with time of two main parameters: the line-of-sight column density (left) and the AGN 2–10 keV intrinsic, absorption–corrected luminosity (right). The best-fit values and uncertainties are those obtained jointly fitting the observations.
As it can be seen, the l.o.s. column density of the material surrounding the accreting SMBH in NGC 1358 is highly variable over different time scales. The first and most significant change in NH,los is the one observed between the 2017 observation and the February 2021 one. In a time-span of 4 years we observe a drop in NH,los by 30 % (from 1.5–1.91024 cm-2 to 1.0–1.31023 cm-2). We then observe a further 15–30 % reduction in a time-span of about five months (from 1.0–1.31023 cm-2 on February 25, 2021, to 8–91023 cm-2 on August 2, 2021), with a consequent transition from a Compton thick to a Compton thin state; a further 20 % decrease, down to 71023 cm-2 is then observed between August 2021 and January 2022. Finally, as shown in the inset of Figure 7, we measure a tentative, intriguing new increase in the two-weeks time-span between our two most recent observations, although this last result is not confirmed by all models (in particular, this trend is stronger when fitting with borus02). Furthermore, we find some tentative evidence for 1 day variability thanks to the non-simultaneity of the NuSTAR and XMM-Newton February 2022 observations. We note that this evidence, while marginal, strengthens the “new NH,los uprise” scenario (i.e., the NH,los measured with XMM-Newton on February 4, 2022, is larger than the one measured with NuSTAR on February 3, 2022).
To better quantify the reliability of this NH,los variability, one needs to check for potential degeneracies between parameters. In particular, it is essential do understand if the AGN intrinsic luminosity experienced any significant change in the time-span covered by our X-ray observations. For this reason, we report in Figure 7, the evolution with time of the 2–10 keV luminosity as computed from our best-fit models. No significant trend with luminosity is detected, regardless of the model used to fit the data. We note that the 2–10 keV luminosity value for the 2017 observation decreased by a factor 2.5 with respect to the one reported in Zhao et al. (2019), and it is now consistent with the values measured in 2021-2022. Such a result suggests that single-epoch measurements are reliable when measuring parameters such as the l.o.s. column density and (provided there is enough statistic above 10 keV) the torus average column density and covering factor. Single-epoch observations, however, are much less efficient in disentangling the contribution of the primary and reprocessed component to the overall emission, which consequently can lead to incorrect luminosity estimates.
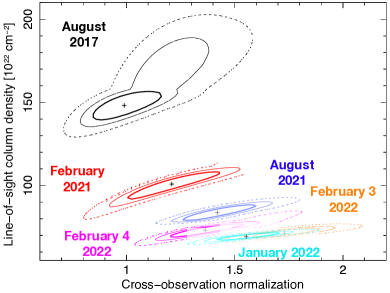
To further underline that the high-quality NuSTAR and XMM-Newton data make it possible to break any NH,los–luminosity degeneracy, we show in Figure 8 the confidence contours of the l.o.s. column density as a function of the cross-observation flux normalization444In all contours, the cross-observation normalizations are the XMM-Newton ones: the only exception being the February 3 contours, which are computed using the NuSTAR normalization for consistency with the fact that NH,los is also measured from the NuSTAR data alone.. This parameter takes into account any flux variability which is not related to NH,los variability, and is therefore a good proxy of the 2–10 keV luminosity. As it can be seen, the NH,los trend is still present and is therefore not significantly affected by AGN luminosity–related degeneracies.
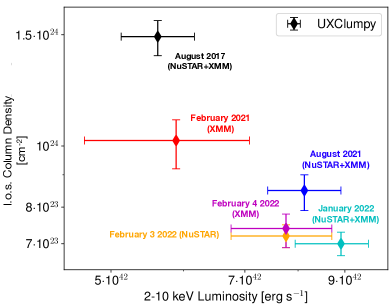
In Figure 9, left panel, we plot the 2–10 keV luminosity as a function of NH,los, as computed using UXCLUMPY, to better underline the correlation between these two quantities.
A possible, qualitative explanation for the observed NH,los and X-ray luminosity variability is a self-regulated “AGN feedback” scenario (see, e.g., Gaspari et al. 2020 for a review). We work under the assumption that the 2–10 keV luminosity can be used to estimate the AGN bolometric luminosity and can therefore be a proxy for the SMBH Eddington ratio, =/. We remark that there are several caveats to take into account with respect to this approach. In particular, there is observational evidence, particularly in Type I AGN, of a lack of correlation between variability in the X-ray continuum and variability in the bolometric luminosity. This suggests that the observed X-ray luminosity variability might be linked to changes in the X-ray corona, particularly on short timescales like those sampled here.
We use Equation 21 from Marconi et al. (2004) to convert the 2–10 keV luminosities into bolometric luminosities. We then adopt the correlation between SMBH mass and stellar velocity dispersion reported in Gaspari et al. (2019) to compute the NGC 1358 SMBH mass, using the stellar velocity dispersion measured by Nelson & Whittle (1995), =17314 km s-1. The SMBH mass is therefore log(MBH/M)=8.220.15: this value is slightly larger than the one reported by Woo & Urry (2002) using the Tremaine et al. (2002) correlation (log(MBH/M)=7.88). Based on these values, we find that the Eddington ratio might have only marginally varied from 410-3 in 2017 to 510-3 in 2021–2022. We note that the uncertainties on the Eddington ratio measurements can be fairly large, given that the intrinsic scatter in the MBH– we used is =0.360.02 (Gaspari et al., 2019). Indeed, when using the MBH–M∗ relation from Suh et al. (2020), where M∗ is computed from =17314 km s-1 using the Zahid et al. (2016) relation, we obtain log(MBH/M)=7.510.75. In a scenario where log(MBH/M)=7.51, the Eddington ratio of NGC 1358 would have been 2(4)10-2 in 2017 (2021–2022).
Keeping in mind the above caveats, it is still helpful for the interested reader to discuss at least a qualitative physical interpretation of the retrieved obscuration, in particular in the currently accepted framework of self-regulated AGN feeding/feedback (e.g. Gaspari et al. 2020 for a review).Indeed, the AGN loop experiences a flickering alternation of feeding and feedback events on micro and macro scales over the several Gyr evolution. Specifically, higher obscuration phases are associated with stronger CCA rain (e.g., Gaspari et al., 2013, 2017), in which the feeding-dominated stage is driven by condensing cool clouds that rain down toward the meso– and ultimately the micro-scale, thus inducing higher NH,los and lower luminosity (as found in Figure 9 during 2017). Given the AGN self-regulation, such a process is expected to quickly trigger a feedback event (with higher AGN luminosities and lower NH,los) as soon as CCA has driven a critical mass inflow near the SMBH horizon. Given the uncertainties associated with our measurements, a definitive answer will be achieved by extending the X-ray monitoring campaign.
4.1 Modeling of the obscuring clouds geometry through l.o.s. column density variability
Following Risaliti et al. (2002, 2005), the distance between the obscuring clouds and the SMBH can be computed with the equation
| (5) |
where t100 is the variability time in units of 100 ks, is the cloud density in units of 1010 cm-3 and NH,24 is the column density of a cloud in units of 1024 cm-2. As mentioned above, based on the correlation between SMBH mass and stellar velocity dispersion, we measured a SMBH mass log(MBH/M)=8.220.15, so the Schwarzschild radius is ==4.91013 cm. We then work under the assumption that the variability observed between two consecutive observations is due to a single cloud having column density =|-|/1024 passing between the observer and the X-ray emitter corona. Finally, it has been shown using a variety of methods that the X-ray corona size varies in the range =3–15 (e.g., McHardy et al., 2005; Fabian et al., 2009, 2015; Chartas et al., 2016; Kamraj et al., 2018), so that the cloud density can be computed as =.
We report in Table 4 the range of SMBH-cloud distances we obtain using the NH,los variability and time separation between observations for the five consecutive pair of observations taken between August, 2017, and February, 2022. For consistency with the “clumpy torus scenario” that is suggested by our data, we use the NH,los values obtained using UXCLUMPY: the results do not however change significantly when using the borus02 or MYTorus l.o.s. column density measurements.
Sampling different time separations allows us to sample different SMBH-cloud distances and/or cloud sizes. For example, the tentative NH,los variability observed between the NuSTAR February 3, 2022 observation and the XMM-Newton February 4, 2022 one, if real, would be caused by material located at only a few hundred gravitational radii from the SMBH. Notably, this is the scale of the accretion disk itself for a SMBH with M108 M⊙, as measured through reverberation mapping (e.g., Jha et al., 2022). Time-scales of 15 days like the one between our January 2022 and February 2022 observations, instead, sample clouds which are located at distances typically associated with the broad line region and the obscuring torus, which is from 0.02 pc (for a coronal size =15 ) to 1 pc (assuming =3 ). This is the so-called meso-scale for self-regulated AGN feeding/feedback (Gaspari et al. 2020), which is the crucial transitional regime linking the tiny SMBH physics to the macro properties of the host halo. We also note that 10-2 pc is the scale of the dust sublimation radius (i.e., the lower limit on the dusty torus inner boundary) for an AGN with 2–10 keV luminosity 1043erg s-1 (see, e.g., Netzer, 2015). We note, however, that the best-fit results for these last three epochs are consistent with a no-variability scenario.
Finally, observations taken a few months apart (such as our February 2021 and August 2021 ones, pair 2, or the latter and the January 2022 one, pair 3) probe distances of 1–102 pc, once again the looser constraint being associated with the more compact coronal size. We also note that the four-year time separation between the 2017 Compton-thick observation and the August 2021 one prevents us from reliably locating the material responsible for the high obscuration reported in Zhao et al. (2019), or even determining if this high-obscuration status was due to a single cloud or to a combination of clouds randomly interjecting our line of sight.
| Obs. range | t100 | |||
|---|---|---|---|---|
| MM/YYYY–MM/YYYY | 100 ks | 1024 cm-2 | pc | pc |
| 08/2017–02/2021 | 1126.7 | 0.610.35 | 5.6103 | 224 |
| 02/2021–08/2021 | 136.5 | 0.380.15 | 82.2 | 3.3 |
| 08/2021–01/2022 | 148.6 | 0.170.10 | 97.5 | 3.9 |
| 01/2022–02/2022 | 11.2 | 0.14 | 0.56 | 0.02 |
| 02/2022–02/2022 | 0.9 | 0.13 | 3.310-3 | 1.310-4 |
5 Conclusions
In this paper, we presented the multi-epoch, NuSTAR and XMM-Newton 0.6–70 keV monitoring campaign of NGC 1358 which took place between February 2021 and february 2022. The l.o.s. column density of the target was predicted to be highly variable based on the properties of the obscuring material: namely, a small covering factor and a large offset between the CT l.o.s. column density measured in August 2017 and the Compton-thin average torus column density. This evidence made the source an ideal candidate changing-look CT-AGN. We summarize the main results of this work.
-
1.
The selection method we proposed to select candidate changing-look CT-AGNs turned out to be highly effective. We find that in 2021–2022 the l.o.s. column density of the material surrounding the AGN in NGC 1358 decreased by a factor 3 with respect to the 2017 observation, and the source transitioned from Compton-thick to Compton-thin. This result opens the way for a more extended NuSTAR–XMM-Newton campaign to target the rest of the candidate changing-look CT-AGNs population and further characterize the properties of the obscuring material surrounding accreting SMBHs.
-
2.
We found NGC 1358 to be l.o.s. column density-variable over a wide range of time-scales: these results suggest that the obscuring material is distributed in clouds of different NH,los located at distances from the accreting SMBH as small as a few hundreds of gravitational radii and as a large as tens to hundreds of pc (depending on the cloud sizes). In such a scenario, a clumpy torus model offers a more self-consistent explanation to the NH,los variability than a uniform torus one.
-
3.
Multi-epoch X-ray observations with NuSTAR and XMM-Newton are, as of today, one of the most efficient methods to reliably measure geometrical properties of the torus such as its covering factor and clumpiness (i.e., difference between average and l.o.s. column density). The 3-epoch fit we performed led to a reduction on the fit parameters uncertainties, with respect to the single-epoch fits, which vary from 20 to 80 %.
-
4.
The high spectral data quality of the NuSTAR and XMM-Newton observations enables simultaneous measurements of NH,los and 2–10 keV intrinsic luminosity (and therefore derive an estimate of the SMBH Eddington ratio) in each of the epochs we analyzed.
-
5.
The anti-correlation between column density and luminosity (Fig. 9) can be understood in the framework of a self-regulated AGN feeding and feedback cycle driven via CCA raining clouds (e.g., Gaspari et al. 2020). However, only by continuing to monitor with NuSTAR and XMM-Newton such a remarkable AGN, we will able to better constrain the current variability/obscuration trends and probe the detailed self-regulation in NGC 1358.
Acknowledgments
We thank the referee for the useful suggestions, which helped us in improving the paper. We thank Mauro Dadina for granting us access to the Sbuccia cluster to compute the multi-epoch confidence contours. This research has made use of the NuSTAR Data Analysis Software (NuSTARDAS) jointly developed by the ASI Space Science Data Center (SSDC, Italy) and the California Institute of Technology (Caltech, USA). SM acknowledges funding from the INAF “Progetti di Ricerca di Rilevante Interesse Nazionale” (PRIN), Bando 2019 (project: “Piercing through the clouds: a multiwavelength study of obscured accretion in nearby supermassive black holes”). MG acknowledges partial support by NASA Chandra GO9-20114X and HST GO-15890.020/023-A, and the BlackHoleWeather program. FS acknowledges funding from the INAF mainstream 2018 program “Gas-DustPedia: A definitive view of the ISM in the Local Universe”. This work makes use of Matplotlib (Hunter, 2007) and NumPy (Harris et al., 2020).
References
- Arévalo et al. (2014) Arévalo, P., Bauer, F. E., Puccetti, S., et al. 2014, ApJ, 791, 81
- Arnaud (1996) Arnaud, K. A. 1996, in Astronomical Society of the Pacific Conference Series, Vol. 101, Astronomical Data Analysis Software and Systems V, ed. G. H. Jacoby & J. Barnes, 17
- Baloković et al. (2021) Baloković, M., Cabral, S. E., Brenneman, L., & Urry, C. M. 2021, ApJ, 916, 90
- Baloković et al. (2014) Baloković, M., Comastri, A., Harrison, F. A., et al. 2014, ApJ, 794, 111
- Baloković et al. (2018) Baloković, M., Brightman, M., Harrison, F. A., et al. 2018, ApJ, 854, 42
- Barthelmy et al. (2005) Barthelmy, S. D., Barbier, L. M., Cummings, J. R., et al. 2005, Space Sci. Rev., 120, 143
- Bennett et al. (2014) Bennett, C. L., Larson, D., Weiland, J. L., & Hinshaw, G. 2014, ApJ, 794, 135
- Bianchi et al. (2009) Bianchi, S., Piconcelli, E., Chiaberge, M., et al. 2009, ApJ, 695, 781
- Buchner et al. (2021) Buchner, J., Brightman, M., Baloković, M., et al. 2021, A&A, 651, A58
- Buchner et al. (2019) Buchner, J., Brightman, M., Nandra, K., Nikutta, R., & Bauer, F. E. 2019, A&A, 629, A16
- Burtscher et al. (2013) Burtscher, L., Meisenheimer, K., Tristram, K. R. W., et al. 2013, A&A, 558, A149
- Chartas et al. (2016) Chartas, G., Rhea, C., Kochanek, C., et al. 2016, Astronomische Nachrichten, 337, 356
- Elitzur & Shlosman (2006) Elitzur, M., & Shlosman, I. 2006, ApJL, 648, L101
- Fabian et al. (2015) Fabian, A. C., Lohfink, A., Kara, E., et al. 2015, MNRAS, 451, 4375
- Fabian et al. (2009) Fabian, A. C., Zoghbi, A., Ross, R. R., et al. 2009, Nature, 459, 540
- Feltre et al. (2012) Feltre, A., Hatziminaoglou, E., Fritz, J., & Franceschini, A. 2012, MNRAS, 426, 120
- Filippenko & Sargent (1985) Filippenko, A. V., & Sargent, W. L. W. 1985, ApJS, 57, 503
- Gaspari et al. (2013) Gaspari, M., Ruszkowski, M., & Oh, S. P. 2013, MNRAS, 432, 3401
- Gaspari et al. (2017) Gaspari, M., Temi, P., & Brighenti, F. 2017, MNRAS, 466, 677
- Gaspari et al. (2020) Gaspari, M., Tombesi, F., & Cappi, M. 2020, Nature Astronomy, 4, 10
- Gaspari et al. (2019) Gaspari, M., Eckert, D., Ettori, S., et al. 2019, ApJ, 884, 169
- Gehrels et al. (2004) Gehrels, N., Chincarini, G., Giommi, P., et al. 2004, ApJ, 611, 1005
- Gilli et al. (2007) Gilli, R., Comastri, A., & Hasinger, G. 2007, A&A, 463, 79
- Guainazzi et al. (2012) Guainazzi, M., La Parola, V., Miniutti, G., Segreto, A., & Longinotti, A. L. 2012, A&A, 547, A31
- Harris et al. (2020) Harris, C. R., Millman, K. J., van der Walt, S. J., et al. 2020, Nature, 585, 357
- Hickox & Alexander (2018) Hickox, R. C., & Alexander, D. M. 2018, ARA&A, 56, 625
- Hönig & Beckert (2007) Hönig, S. F., & Beckert, T. 2007, MNRAS, 380, 1172
- Hunter (2007) Hunter, J. D. 2007, Computing in Science and Engineering, 9, 90
- Jaffe et al. (2004) Jaffe, W., Meisenheimer, K., Röttgering, H. J. A., et al. 2004, Nature, 429, 47
- Jansen et al. (2001) Jansen, F., Lumb, D., Altieri, B., et al. 2001, A&A, 365, L1
- Jha et al. (2022) Jha, V. K., Joshi, R., Chand, H., et al. 2022, MNRAS, 511, 3005
- Jones et al. (2009) Jones, D. H., Read, M. A., Saunders, W., et al. 2009, MNRAS, 399, 683
- Kalberla et al. (2005) Kalberla, P. M. W., Burton, W. B., Hartmann, D., et al. 2005, A&A, 440, 775
- Kamraj et al. (2018) Kamraj, N., Harrison, F. A., Baloković, M., Lohfink, A., & Brightman, M. 2018, ApJ, 866, 124
- Koss et al. (2015) Koss, M. J., Romero-Cañizales, C., Baronchelli, L., et al. 2015, ApJ, 807, 149
- Koss et al. (2016) Koss, M. J., Assef, R., Baloković, M., et al. 2016, ApJ, 825, 85
- Lawrence (1991) Lawrence, A. 1991, MNRAS, 252, 586
- Maccagni et al. (2021) Maccagni, F. M., Serra, P., Gaspari, M., et al. 2021, A&A, 656, A45
- Madsen et al. (2017) Madsen, K. K., Beardmore, A. P., Forster, K., et al. 2017, AJ, 153, 2
- Marchese et al. (2012) Marchese, E., Braito, V., Della Ceca, R., Caccianiga, A., & Severgnini, P. 2012, MNRAS, 421, 1803
- Marchesi et al. (2017) Marchesi, S., Ajello, M., Comastri, A., et al. 2017, ApJ, 836, 116
- Marchesi et al. (2018) Marchesi, S., Ajello, M., Marcotulli, L., et al. 2018, ApJ, 854, 49
- Marchesi et al. (2019) Marchesi, S., Ajello, M., Zhao, X., et al. 2019, ApJ, 872, 8
- Marconi et al. (2004) Marconi, A., Risaliti, G., Gilli, R., et al. 2004, MNRAS, 351, 169
- Marinucci et al. (2012) Marinucci, A., Bianchi, S., Nicastro, F., Matt, G., & Goulding, A. D. 2012, ApJ, 748, 130
- Masini et al. (2016) Masini, A., Comastri, A., Baloković, M., et al. 2016, A&A, 589, A59
- Mason et al. (2015) Mason, R. E., Rodríguez-Ardila, A., Martins, L., et al. 2015, ApJS, 217, 13
- McHardy et al. (2005) McHardy, I. M., Gunn, K. F., Uttley, P., & Goad, M. R. 2005, MNRAS, 359, 1469
- McKinley et al. (2022) McKinley, B., Tingay, S. J., Gaspari, M., et al. 2022, Nature Astronomy, 6, 109
- Miniutti et al. (2014) Miniutti, G., Sanfrutos, M., Beuchert, T., et al. 2014, MNRAS, 437, 1776
- Murphy & Yaqoob (2009) Murphy, K. D., & Yaqoob, T. 2009, MNRAS, 397, 1549
- Nelson & Whittle (1995) Nelson, C. H., & Whittle, M. 1995, ApJS, 99, 67
- Nenkova et al. (2008a) Nenkova, M., Sirocky, M. M., Ivezić, Ž., & Elitzur, M. 2008a, ApJ, 685, 147
- Nenkova et al. (2008b) Nenkova, M., Sirocky, M. M., Nikutta, R., Ivezić, Ž., & Elitzur, M. 2008b, ApJ, 685, 160
- Netzer (2015) Netzer, H. 2015, ARA&A, 53, 365
- Oda et al. (2017) Oda, S., Tanimoto, A., Ueda, Y., et al. 2017, ApJ, 835, 179
- Olivares et al. (2022) Olivares, V., Salome, P., Hamer, S. L., et al. 2022, arXiv e-prints, arXiv:2201.07838
- Osorio-Clavijo et al. (2020) Osorio-Clavijo, N., González-Martín, O., Papadakis, I. E., Masegosa, J., & Hernández-García, L. 2020, MNRAS, 491, 29
- Puccetti et al. (2014) Puccetti, S., Comastri, A., Fiore, F., et al. 2014, ApJ, 793, 26
- Ricci et al. (2015) Ricci, C., Ueda, Y., Koss, M. J., et al. 2015, ApJL, 815, L13
- Ricci et al. (2016) Ricci, C., Bauer, F. E., Treister, E., et al. 2016, ApJ, 819, 4
- Risaliti et al. (2005) Risaliti, G., Elvis, M., Fabbiano, G., Baldi, A., & Zezas, A. 2005, ApJL, 623, L93
- Risaliti et al. (2007) Risaliti, G., Elvis, M., Fabbiano, G., et al. 2007, ApJL, 659, L111
- Risaliti et al. (2002) Risaliti, G., Elvis, M., & Nicastro, F. 2002, ApJ, 571, 234
- Rivers et al. (2015) Rivers, E., Baloković, M., Arévalo, P., et al. 2015, ApJ, 815, 55
- Rose et al. (2019) Rose, T., Edge, A. C., Combes, F., et al. 2019, MNRAS, 489, 349
- Saha et al. (2022) Saha, T., Markowitz, A. G., & Buchner, J. 2022, MNRAS, 509, 5485
- Simpson (2005) Simpson, C. 2005, MNRAS, 360, 565
- Suh et al. (2020) Suh, H., Civano, F., Trakhtenbrot, B., et al. 2020, ApJ, 889, 32
- Temi et al. (2022) Temi, P., Gaspari, M., Brighenti, F., et al. 2022, ApJ, 928, 150
- Theureau et al. (1998) Theureau, G., Bottinelli, L., Coudreau-Durand, N., et al. 1998, A&AS, 130, 333
- Torres-Albà et al. (2021) Torres-Albà, N., Marchesi, S., Zhao, X., et al. 2021, ApJ, 922, 252
- Traina et al. (2021) Traina, A., Marchesi, S., Vignali, C., et al. 2021, ApJ, 922, 159
- Tremaine et al. (2002) Tremaine, S., Gebhardt, K., Bender, R., et al. 2002, ApJ, 574, 740
- Woo & Urry (2002) Woo, J.-H., & Urry, C. M. 2002, ApJ, 579, 530
- Yaqoob (2012) Yaqoob, T. 2012, MNRAS, 423, 3360
- Yaqoob et al. (2015) Yaqoob, T., Tatum, M. M., Scholtes, A., Gottlieb, A., & Turner, T. J. 2015, MNRAS, 454, 973
- Zahid et al. (2016) Zahid, H. J., Geller, M. J., Fabricant, D. G., & Hwang, H. S. 2016, ApJ, 832, 203
- Zaino et al. (2020) Zaino, A., Bianchi, S., Marinucci, A., et al. 2020, MNRAS, 492, 3872
- Zhao et al. (2020) Zhao, X., Marchesi, S., Ajello, M., Baloković, M., & Fischer, T. 2020, ApJ, 894, 71
- Zhao et al. (2021) Zhao, X., Marchesi, S., Ajello, M., et al. 2021, A&A, 650, A57
- Zhao et al. (2019) —. 2019, ApJ, 870, 60
Appendix A Single-epoch spectral fits of the NuSTAR and XMM-Newton observations analyzed in this work
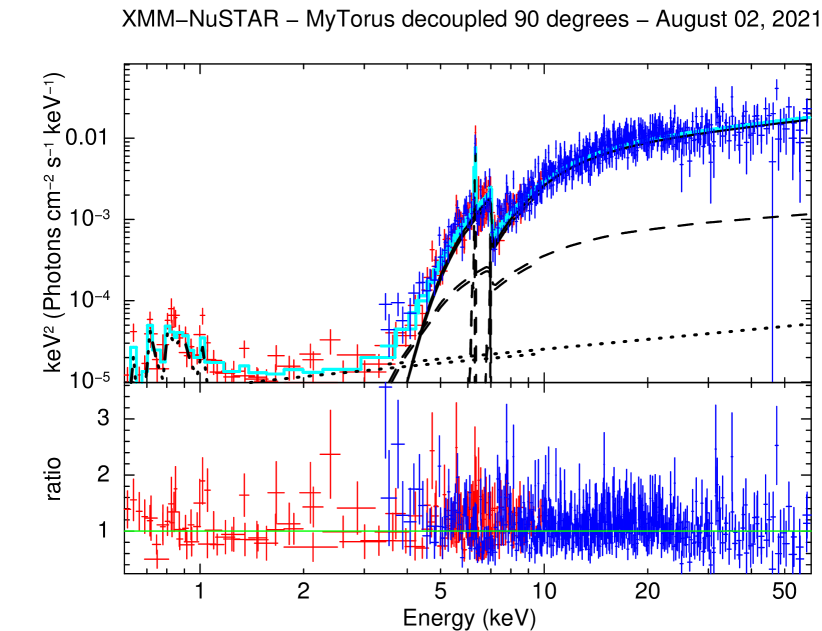
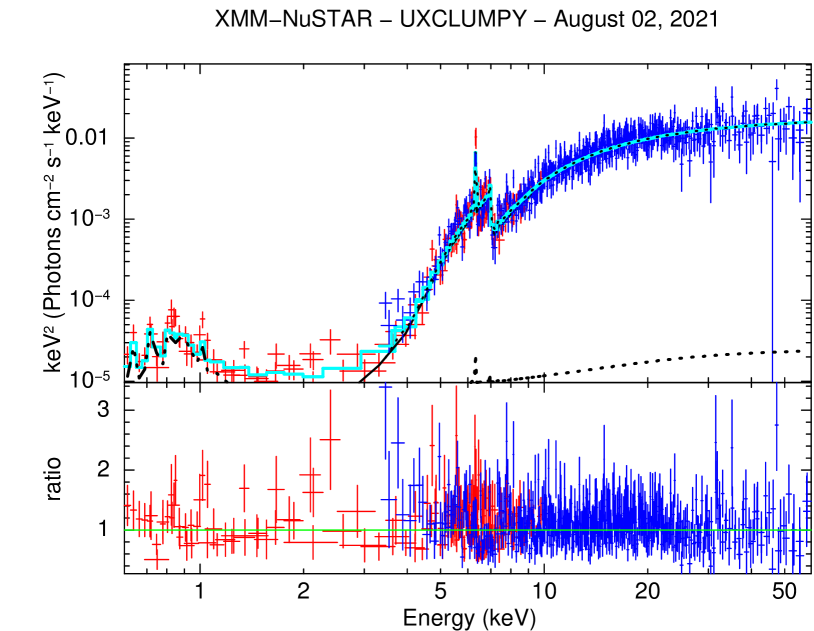
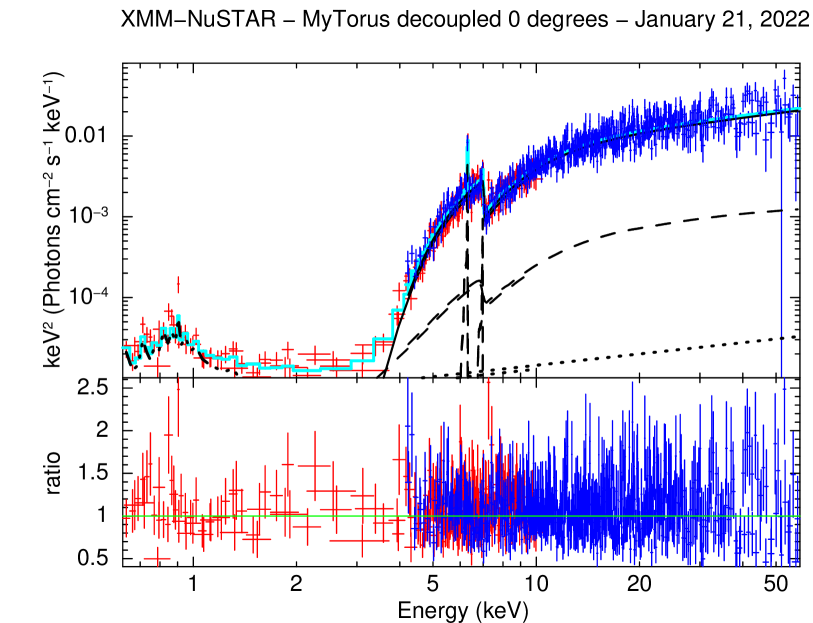
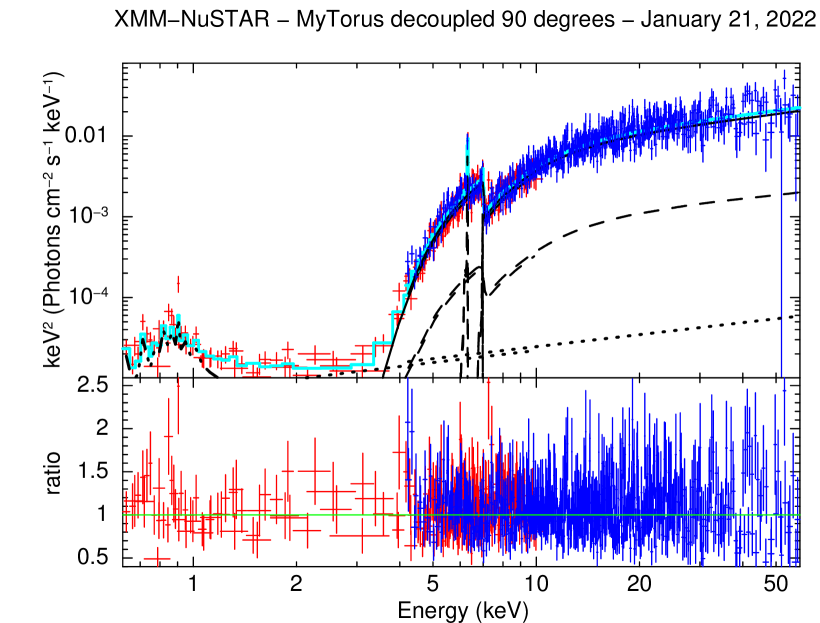
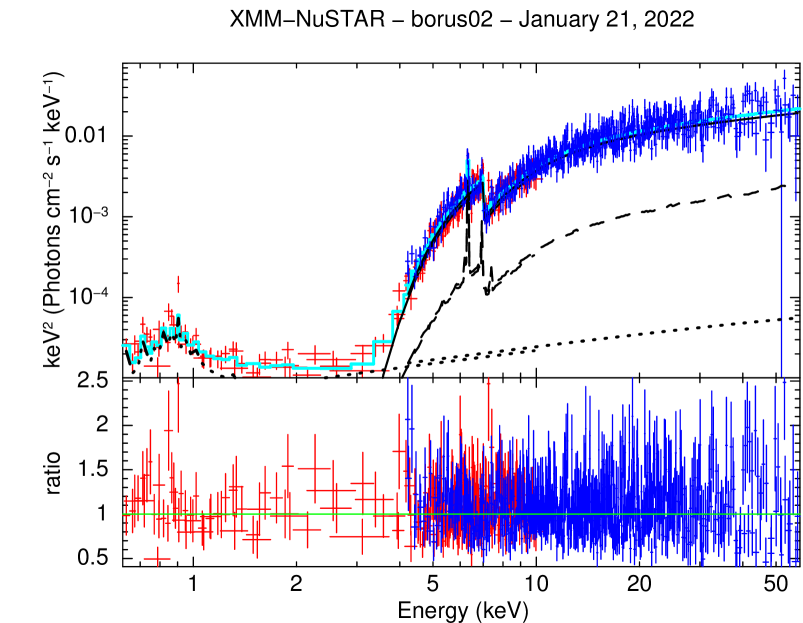
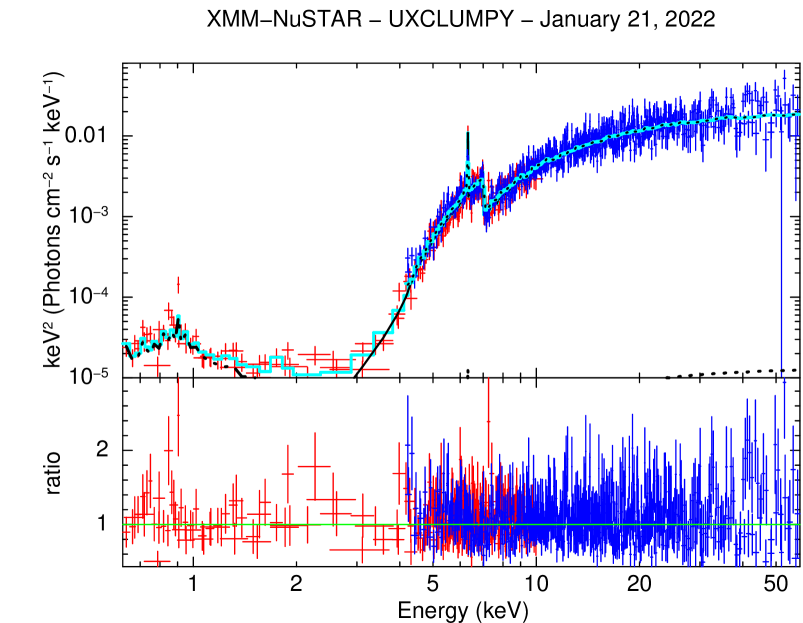
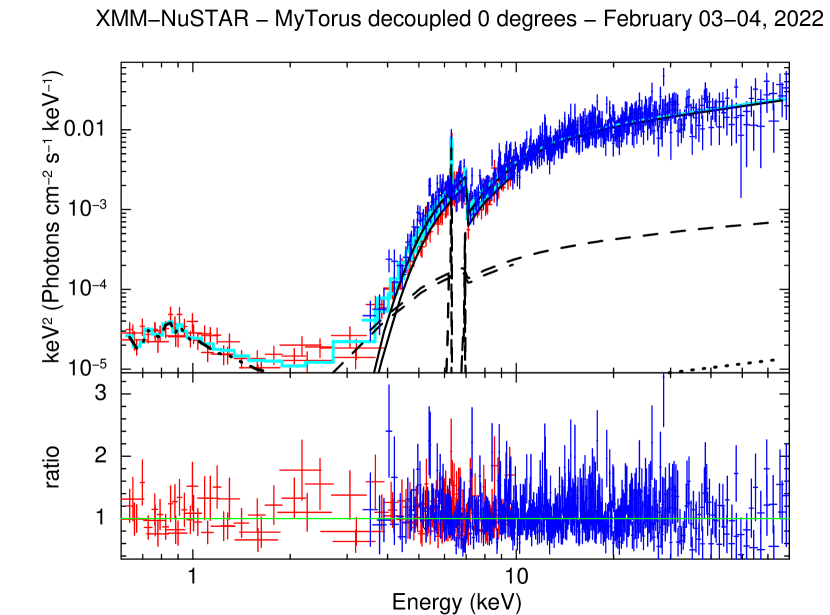
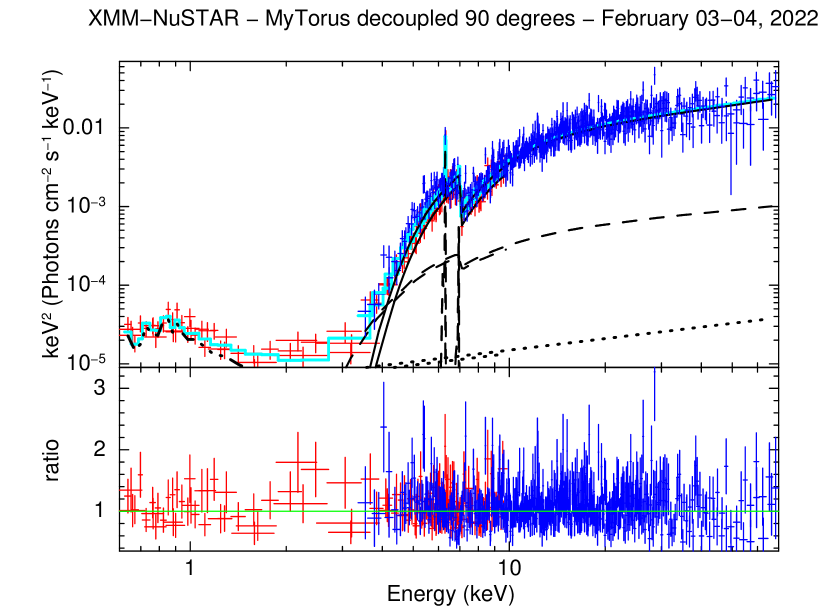
In this Appendix we report the results of the single-epoch spectral fits performed on the NuSTAR and XMM-Newton observations taken between February, 2021, and February, 2022. We also report here the images of the best-fit models obtained using MYTorus, borus02 and UXCLUMPY for the four sets of observations analyzed in this paper.
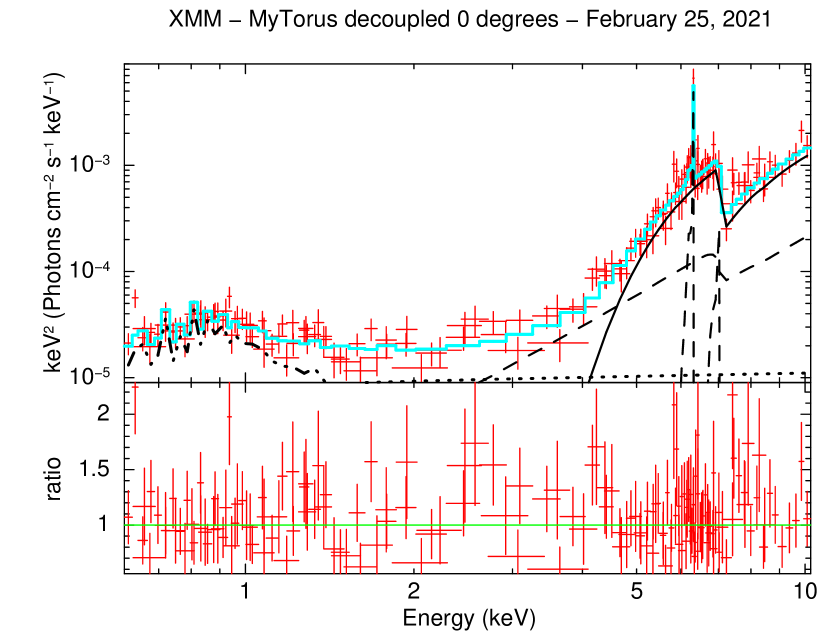
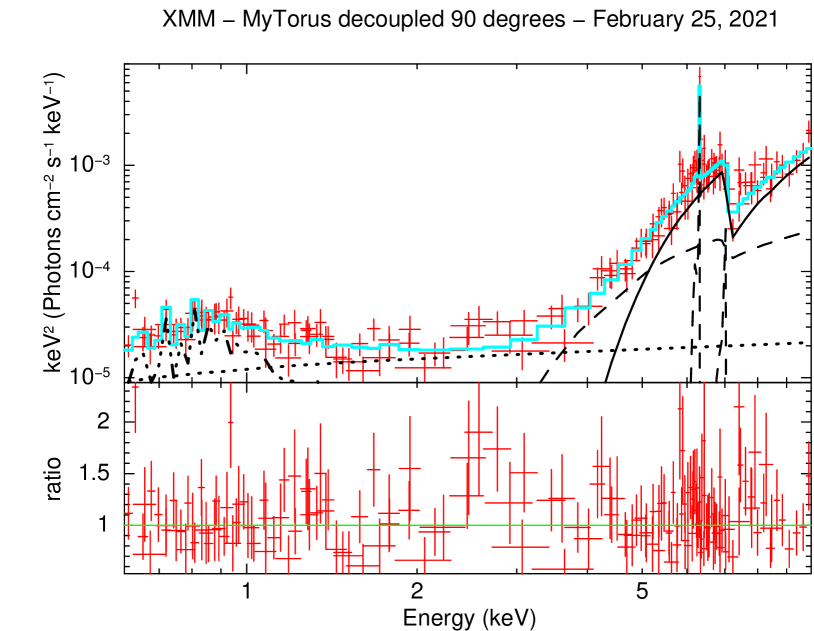
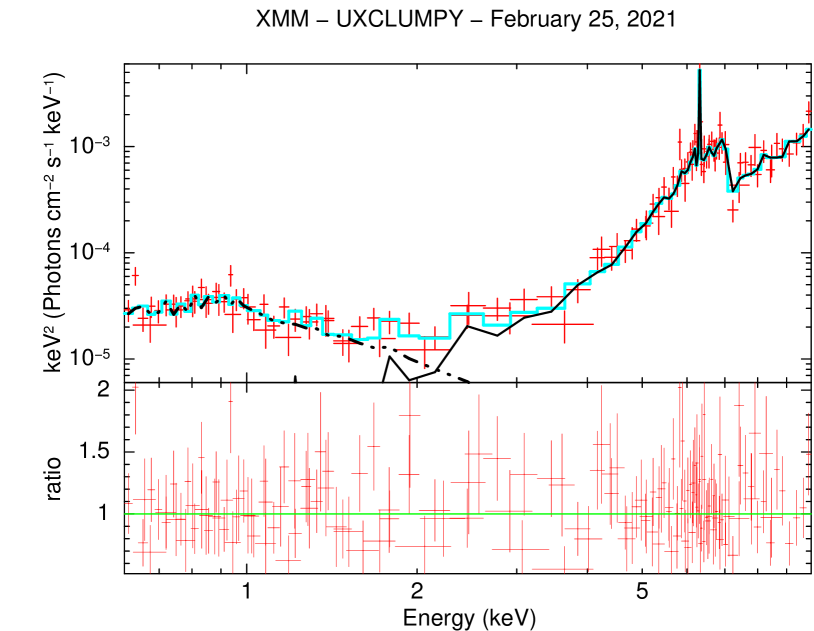
A.1 XMM-Newton observation, 2021-02-25
The first observation we analyze is the only one without simultaneous NuSTAR data and was taken by XMM-Newton on February 25, 2021. We report the results of our analysis in Table 5 and the best-fit spectra obtained with MYTorus and borus02 in Figure 10. There is a general good agreement between the results obtained with MYTorus (either assuming =90 or =0), borus02 and UXCLUMPY. In particular, we measure a typical AGN photon index =1.8–1.9 (although with fairly large uncertainties, 0.4) and a line-of-sight column density around the Compton-thick threshold, NH,los1024 cm-2.
The lack of NuSTAR data prevented us from constraining other parameters, such as the average column density and the covering factor, when fitting the data with MYTorus in one of its two configurations or with borus02. This is due to the fact that variations of NH,tor or mostly affect the 5–10 keV spectrum (see, e.g., Figure A1 in Zhao et al., 2020). The UXCLUMPY fit, which is also the one with the best reduced (/d.o.f.=123.7/148; as a reference, the borus02 fit has /d.o.f.=130.3/149), supports instead the “low covering factor” scenario. Indeed, we measure a cloud vertical dispersion TOR=9.0 and a covering factor of the inner ring CTK0.17.
| Date | 2021-02-25 (XMM-Newton only) | 2021-08-02 (NuSTAR + XMM-Newton) | ||||||
| Model | MYTorus | MYTorus | borus02 | UXCLUMPY | MYTorus | MYTorus | borus02 | UXCLUMPY |
| decoupled, 0 | decoupled, 90 | decoupled, 0 | decoupled, 90 | |||||
| /dof | 132.1/150 | 136.6/150 | 130.3/149 | 123.7/148 | 660.5/599 | 662.0/599 | 659.9/598 | 658.1/598 |
| N/A | N/A | N/A | N/A | 1.13 | 1.12 | 1.13 | 1.11 | |
| 1.90 | 1.79 | 1.75 | 1.94 | 1.61 | 1.60 | 1.60 | 1.63 | |
| 10-2 | 0.59 | 0.64 | 0.40 | 0.80 | 0.51 | 0.56 | 0.45 | 0.68 |
| NH,los [1024 cm-2] | 0.94 | 1.10 | 0.92 | 1.09 | 0.86 | 0.94 | 0.83 | 0.91 |
| NH,tor [1024 cm-2] | 10.00 | 0.28 | 10.05 | … | 1.98 | 0.37 | 1.74 | … |
| AS | 0.59 | 0.47 | … | … | 0.24 | 0.40 | … | … |
| … | … | 0.43 | … | … | … | 0.28 | … | |
| [∘] | … | … | 67.3 | 65.9 | … | … | 78.7 | 87.8 |
| TOR [∘] | … | … | … | 9.0 | … | … | … | 10.3 |
| CTK | … | … | … | 0.17 | … | … | … | 0.22 |
| 10-2 | 0.15 | 0.21 | 0.19 | 0.28 | 0.13 | 0.16 | 0.15 | 0.12 |
| [keV] | 0.64 | 0.63 | 0.68 | 0.74 | 0.59 | 0.58 | 0.60 | 0.62 |
| / | 0.05 | 0.08 | 0.04 | 0.02 | 0.18 | 0.44 | 0.14 | 0.08 |
| log(F2-10) [erg s-1 cm-2] | –12.06 | –12.05 | –12.05 | –12.05 | –11.83 | –11.83 | –11.83 | –11.83 |
| log(F10-40) [erg s-1 cm-2] | N/A | N/A | N/A | N/A | –10.68 | –10.68 | –10.68 | –10.68 |
| log(L2-10) [erg s-1] | 42.84 | 42.95 | 42.80 | 42.85 | 42.97 | 43.02 | 42.92 | 42.99 |
| log(L10-40) [erg s-1] | N/A | N/A | N/A | N/A | 43.17 | 43.22 | 43.10 | 43.16 |
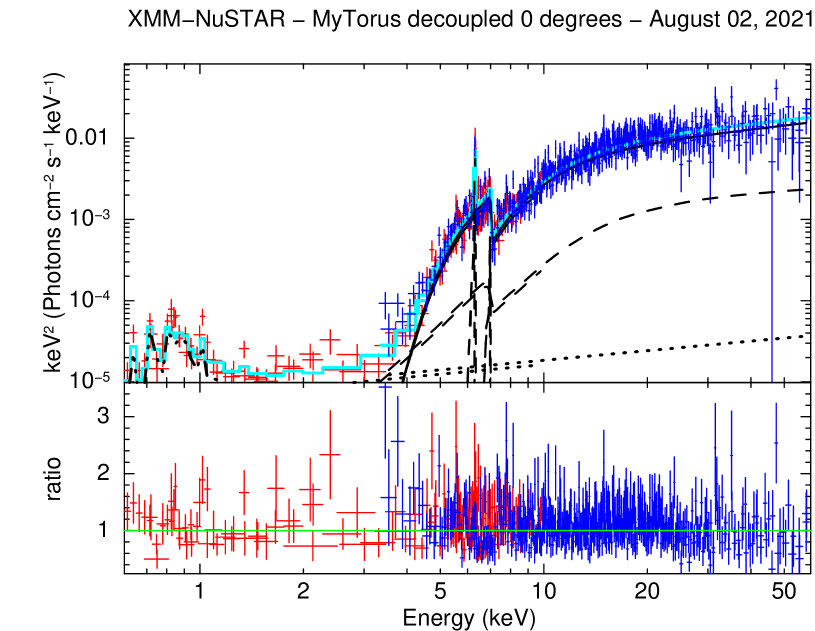
A.2 NuSTAR and XMM-Newton observations, 2021-08-02
The second observation analyzed in this work was taken quasi-simultaneously by NuSTAR and XMM-Newton on August 02, 2021. We report the results in Table 5, while the best-fit spectra are shown in Figure 11. There is a general excellent agreement between the results obtained with MYTorus (either assuming =90 or =0), borus02 and UXCLUMPY, and all four models have almost identical reduced . We measure a typical AGN photon index 1.60.1 (slightly harder, although consistent within the uncertainties, than the one measured in the February 2021 observation) and a line-of-sight column density just below the Compton-thick threshold, NH,los8–91023 cm-2.
As for the other properties of the obscuring material, the average column density measured using MYTorus decoupled in its “0” configuration is consistent with the one we measure with borus02, logNH,tor24.2–24.3. Such a value is slightly larger than the one found by Zhao et al. (2019, logNH,tor23.8), although the 2017 measurement is in agreement with the August 2021 one at the 90 % confidence level. We also note that the NH,tor obtained using MYTorus decoupled in its “90” configuration is much lower (logNH,tor=23.60.2) and in even closer agreement with the Zhao et al. (2019) one. Finally, the covering factor we measure using borus02 (=0.28) is in agreement with the one reported by Zhao et al. (2019, 0.17), and a similarly low covering factor is found when using UXCLUMPY (TOR=10.3 and CTK0.22).
A.3 NuSTAR and XMM-Newton observations, 2022-01-21
The third set of observations of NGC 1358 was performed quasi-simultaneously by NuSTAR and XMM-Newton on January 21, 2022. The results of the spectral analysis are reported in Table 6, while the spectra are shown in Figure 12. The line-of-sight column density further decreased by 20 % with respect to the observations performed 5.5 months earlier, being 71023 cm-2; such a result is model-independent.
The agreement between the four models extends to all the other spectral parameters. In particular, both borus02 (=0.17) and UXCLUMPY (TOR<5.7∘ and CTK=0.26) once again favor a low–covering factor scenario, in agreement with our previous findings. The average torus column density is found to be logNH,tor23.8 using both borus02 and MYTorus decoupled in its 90 configuration. As mentioned before, such a value is the same reported in (Zhao et al., 2019): furthermore, in this observation NH,los is basically identical to NH,tor.
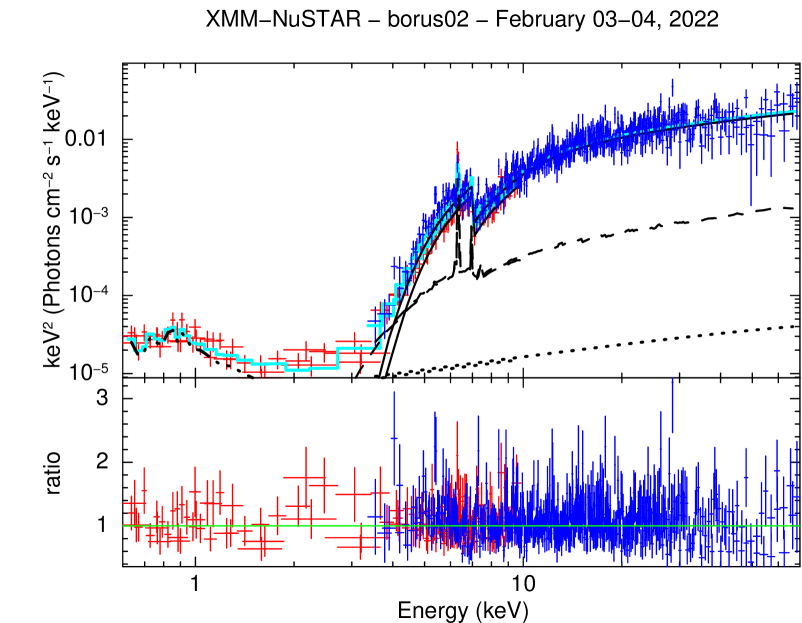
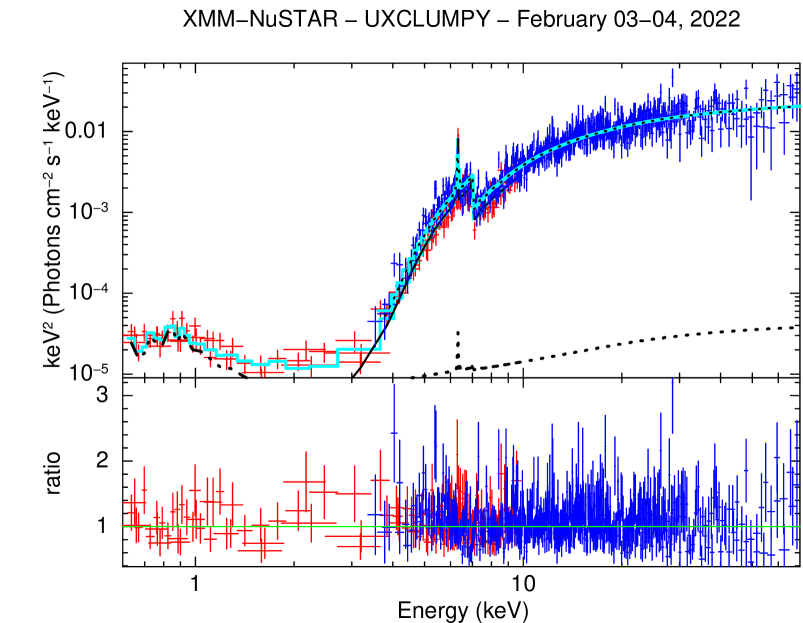
A.4 NuSTAR and XMM-Newton observations, 2022-02-03/04
The fourth and final set of NuSTAR and XMM-Newton observations was taken on February 3 and 4, 2022. As reported in Table 1, the NuSTAR observation ended 13 hours before the start of the XMM-Newton observation. This small temporal offset allowed us to search for short-time scale variability. We first assumed that no NH,los variability occurred between the two observations, and only allowed for flux variability which we parameterize with the usual cross-instrument constant . For all models, we find =1.31–1.320.07; as a comparison, in both the August 2021 and January 2022 observations we measure a cross-normalization 1.1. For this reason, we decided to leave NH,los free to vary between the NuSTAR and XMM-Newton observations: with this new model, we obtain a cross-normalization 1.1, in close agreement with the values obtained in the other epochs. Furthermore, all models favor a scenario where NH,los increased by 4–91022 cm-2 between the February 3 NuSTAR observation and the XMM-Newton observation taken half a day later. We also note, however, that the two NH,los values are always in agreement within their 90 % confidence uncertainties.
Regardless of the model we used to perform the spectral fit, the NH,los variability scenario was always statistically favored with respect to the normalization–luminosity variability one, therefore we report in Table 6 the results obtained with the double–NH,los model. As mentioned above, there is a tentative evidence for an increase in NH,los within the two observations, and with respect to the January observation, particularly in the MYTorus and borus02 models (NH,los1023 cm-2), while the discrepancy is milder when fitting the data with UXCLUMPY.
As for the average torus properties, all models support a low– scenario with an average column density NH,tor2–3 1023 cm-2.
| Date | 2022-01-21 (NuSTAR + XMM-Newton) | 2022-02-04 (NuSTAR + XMM-Newton) | ||||||
| Model | MYTorus | MYTorus | borus02 | UXCLUMPY | MYTorus | MYTorus | borus02 | UXCLUMPY |
| decoupled, 0 | decoupled, 90 | decoupled, 0 | decoupled, 90 | |||||
| /dof | 796.9/792 | 796.2/792 | 795.1/792 | 795.6/792 | 634.7/650 | 634.9/650 | 631.8/650 | 634.6/650 |
| 1.12 | 1.11 | 1.11 | 1.11 | 1.14 | 1.10 | 1.07 | 1.20 | |
| 1.53 | 1.51 | 1.44 | 1.59 | 1.50 | 1.51 | 1.43 | 1.55 | |
| 10-2 | 0.46 | 0.40 | 0.34 | 0.64 | 0.42 | 0.44 | 0.36 | 0.46 |
| NH,los J [1024 cm-2] | 0.69 | 0.67 | 0.67 | 0.70 | … | … | … | … |
| NH,los X [1024 cm-2] | … | … | … | … | 0.79 | 0.83 | 0.81 | 0.73 |
| NH,los N [1024 cm-2] | … | … | … | … | 0.73 | 0.75 | 0.72 | 0.69 |
| NH,tor [1024 cm-2] | 1.00 | 0.60 | 0.63 | … | 0.30 | 0.21 | 0.22 | … |
| AS | 0.18 | 0.47 | … | … | 0.28 | 0.48 | … | … |
| … | … | 0.17 | … | … | … | 0.17 | … | |
| [∘] | … | … | 87f | 90f | … | … | 87f | 90f |
| TOR [∘] | … | … | … | 5.7 | … | … | … | 13.8 |
| CTK | … | … | … | 0.25 | … | … | … | 0.17 |
| 10-2 | 0.10 | 0.18 | 0.19 | 0.14 | 0.20 | 0.10 | 0.12 | 0.19 |
| [keV] | 0.68 | 0.66 | 0.68 | 0.71 | 0.64 | 0.63 | 0.65 | 0.65 |
| / | 0.07 | 0.10 | 0.08 | 0.05 | 0.03 | 0.04 | 0.04 | 0.04 |
| log(F2-10) [erg s-1 cm-2] | –11.66 | –11.66 | –11.66 | –11.65 | –11.75 | –11.75 | –11.75 | –11.75 |
| log(F10-40) [erg s-1 cm-2] | –10.60 | –10.60 | –10.60 | –10.60 | –10.61 | –10.61 | –10.61 | –10.61 |
| log(L2-10) [erg s-1] | 42.98 | 42.93 | 42.92 | 42.98 | 42.94 | 42.97 | 42.95 | 42.88 |
| log(L10-40) [erg s-1] | 43.21 | 43.19 | 43.18 | 43.20 | 43.22 | 43.23 | 43.23 | 43.18 |