- AGN
- Active Galactic Nuclei
- ATCA
- Australia Telescope Compact Array
- ASKAP
- Australian Square Kilometre Array Pathfinder
- EMU
- Evolutionary Map of the Universe
- FWHM
- Full Width at Half-Maximum power
- HST
- Hubble Space Telescope
- ISM
- Interstellar Medium
- HIPASS
- H i Parkes All Sky Survey
- MIRIAD
- Multichannel Image Reconstruction, Image Analysis and Display
- MWA
- Murchison Widefield Array
- NRAO
- National Radio Astronomy Observatory
- NVSS
- NRAO VLA Sky Survey
- pc
- parsec: 1 pc m
- RFI
- Radio-Frequency Interference
- Spectral Index,
- SMBH
- Super Massive Black Hole
- BH
- Black Hole
- WISE
- Wide-Field Infrared Survey Explorer
- VLBI
- Very Long Baseline Interferometry
- VLBA
- Very Long Baseline Array
Collimation of the kiloparsec-scale radio jets in NGC 2663
Abstract
We present the discovery of highly-collimated radio jets spanning a total of 355 kpc around the nearby elliptical galaxy NGC 2663, and the possible first detection of recollimation on kiloparsec scales. The small distance to the galaxy (28.5 Mpc) allows us to resolve portions of the jets to examine their structure. We combine multiwavelength data: radio observations by the Murchison Widefield Array (MWA), the Australian Square Kilometre Array Pathfinder (ASKAP) and the Australia Telescope Compact Array (ATCA), and X-ray data from Chandra, Swift and SRG/eROSITA. We present intensity, rotation measure, polarisation, spectral index and X-ray environment maps. Regions of the southern jet show simultaneous narrowing and brightening, which can be interpreted as a signature of the recollimation of the jet by external, environmental pressure, though it is also consistent with an intermittent Active Galactic Nuclei (AGN) or complex internal jet structure. X-ray data suggest that the environment is extremely poor; if the jet is indeed recollimating, the large recollimation scale (40 kpc) is consistent with a slow jet in a low-density environment.
keywords:
galaxies: active – galaxies: jets – radio continuum: general1 Introduction
AGN jets are highly-collimated outflows of relativistic plasma, generated from the accretion of material onto a Super Massive Black Hole (SMBH) in a galactic centre. SMBHs are believed to exist in all elliptical galaxies and spiral galaxy bulges (Kormendy & Richstone, 1995; Magorrian et al., 1998). Relativistic jets launched from SMBHs have been observed on scales from parsecs to megaparsecs, interacting with cosmic environments from the immediate neighbourhood of the accretion disk to the intracluster and intergalactic medium.
Understanding AGN jets is crucial for characterising the effect of Black Holes on the formation of structure in the Universe, especially the high-mass end of the stellar-mass function. For galaxies in dark matter haloes more massive than M⊙, heat and outflowing material from AGN is believed to be the most important form of feedback against baryon collapse and star formation (Nelson et al., 2019; Croton et al., 2006).
How do AGN jets interact with their cosmic environment? A range of physical processes affect the jet’s dynamics and stability. As the initially over-pressured jet streams away from the centre of the galaxy, its pressure decreases with distance from the jet base. Eventually it reaches the critical point where the jet pressure falls below the pressure of the external environment. The pressure mismatch can drive an oscillation in the width of the jet, causing it to narrow and brighten with a characteristic length scale. This phenomenon is called recollimation (see, e.g. Mizuno et al., 2015; Gómez et al., 1997; Komissarov & Falle, 1997). A parsec-scale jet recollimation is suggested in both, distant () blazar PSO J030947.49+271757.31 (Spingola et al., 2020) as well as in nearby galaxies M 87 (Asada et al., 2014) and 1H 0323+342 (Hada et al., 2018).
The study of recollimation phenomena, then, can shed light on both the origin of jets, and the impact of AGN on galaxy formation. There are (at least) two scenarios that could produce recollimation. The first involves an under-pressured jet, relative to the surrounding medium. The second scenario involves a steep drop in the ambient pressure (Daly & Marscher, 1988).
NGC 2663 is an elliptical galaxy at a distance of 28.5 Mpc (, Willick et al., 1997), whose jets span 355 kpc from one end to the other. This makes it one of the largest radio galaxies (in projected angular size) in the nearby Universe ( Mpc), with absolute optical magnitude of . NGC 2663 contains a gaseous disc, but does not have an obvious stellar disc. NGC 2663 has a compact central radio source (see, e.g. Danziger & Goss, 1983; Sadler et al., 1989). The velocity of gas rotation is very low, and stellar rotation is not detected (Ricci et al., 2014a). Using the optical spectral classification from Veilleux & Osterbrock (1987), we find that optical spectral emission line ratios obtained by Ricci et al. (2014b) strongly suggest that NGC 2663 contains an AGN. It exhibits a large metallicity gradient, and the derived (Mg/Fe) abundance ratio is higher than Solar. Na D lines have not been detected, which indicates that the light from its nucleus is not significantly affected by the Interstellar Medium (ISM) (Ricci et al., 2014a).
Here, we present a multi-wavelength study of NGC 2663 from radio to X-ray, seeking to understand the jet and its effect on its galactic environment. Section 2 describes the instruments and data. In Section 3 we present our observational results, divided into six subsections: jet structure, polarisation, spectral index, environment, host galaxy, and X-ray emission. In Section 4 we discuss theoretical models that can explain our observations of NGC 2663. Section 5, in anticipation of future recollimation candidates in the Evolutionary Map of the Universe (EMU) survey, discusses how NGC 2663 would appear if it were observed at larger distances.
2 Observations and Data
In this section, we present observations of NGC 2663 at radio wavelengths from MWA at 200 MHz, ASKAP at 1520 MHz, ATCA at 1384 MHz and 2368 MHz, the H i Parkes All Sky Survey (HIPASS), and the Very Long Baseline Array (VLBA) at 2300 MHz and 8400 MHz. We also present data at infrared wavelengths from the Wide-Field Infrared Survey Explorer (WISE), at optical wavelengths from the Hubble Space Telescope (HST), at UV wavelengths from Swift, and in the X-ray regime from Chandra, eROSITA and Swift. A summary of the observations is given in Table LABEL:Obs_Summary.
2.1 Murchison Widefield Array
Observations were carried out using the MWA (Tingay et al., 2013), located at the Murchison Radio-astronomy Observatory, as part of the GaLactic and Extragalactic All-sky MWA eXtended (GLEAM-X) survey (Hurley-Walker et al. in prep). At the time of these observations, the telescope had 128 dipole tiles (110 online during observations), spread across 5.5 km (Phase II; Wayth et al. 2018), with a primary beam of 30 degrees Full Width at Half-Maximum power (FWHM) and a synthesized beam of 1 arcmin FWHM at 200 MHz.
The MWA uses a two-stage polyphase filter bank to channelize the data. The first stage separates the 30.72 MHz bandwidth into 241.28 MHz coarse channels while the second stage breaks up each coarse channel into 12810 kHz fine channels. GLEAM-X observed in a series of drift scans, one per night, iterating through each 30.72-MHz channel between 72–231 MHz, changing every two minutes. For this work, we used observations taken over UTC2018-02-04 15:30–16:38, UTC2018-02-20 14:27–15:35, and UTC2018-05-03 10:04–10:52 at 170–200 and 200–231 MHz, comprising 112 minutes of integration, but at heterogeneous sensitivity with the source appearing in different regions of the primary beam.
The data were calibrated on a sky model based on GLEAM ExGal (Hurley-Walker et al., 2017), and further refined by using one round of self-calibration on an initial clean using WSClean (Offringa et al., 2014). The final imaging was performed with a Briggs’ ”robust” weighting of 0.0 (Briggs, 1995), forming a mask at the local root-mean-square noise of the residuals , then cleaning down to inside the mask, and producing a multi-frequency synthesis image across each 30.72 MHz band. The 200–231 MHz images were convolved to the same angular resolution as the 170–200 MHz images () and combined using the mosaicking software swarp (Bertin et al., 2002). The final flux density scale was tested against that of GLEAM ExGal for sources with signal-to-noise, and the median integrated flux density ratio was found to be .
2.2 The Australian Square Kilometre Array Pathfinder
The ASKAP (Johnston et al., 2008; Hotan et al., 2021) is located at the Murchison Radio-astronomy Observatory in Western Australia. Each of the 36 antennas is equipped with a Phased Array Feed (PAF) (Schinckel et al., 2012) giving it a field of view of deg2. Our data were taken with the Square 66 footprint, a pitch of 0.9, and a footprint rotation of 45 degrees. They were observed on 10th April 2019 at a central frequency of 1520.5 MHz with 288 MHz of bandwidth in continuum mode (1 MHz channel widths) using a mosaic of four dithered exposures around NGC 2663 with resolution of arcsec. All data were processed using ASKAPsoft (Guzman et al., 2019) for calibration and imaging.
The observations were taken as part of the commissioning of the high-band of ASKAP (McConnell et al., 2016) and 23 antennas were online with a maximum baseline of 6 km. They were taken in full polarisation, and observations of PKS B1934–638 were performed immediately adjacent in time to the target field for purposes of instrumental calibration. The calibration observation contained one calibrator scan of duration five minutes at the centre of each of the 36 PAF beams.
We performed a first order image-plane correction for the leakage in all Stokes parameters. After that correction on top of mosaicking on the basis of the brightest unpolarised source near NGC 2663, it appears that the Stokes I leakage can be constrained to 0.70.2 per cent. This is consistent with results from other ASKAP imaging work done within the POSSUM project (i.e. Anderson et al. 2021). We rejected the mid-band channels affected by Radio-Frequency Interference (RFI) and then created a rotation measure (RM) synthesis map (Brentjens & de Bruyn, 2005).
2.3 Australia Telescope Compact Array
We used ATCA observational data from project C3370 that were taken on the 30th September 2020 in the 6B array configuration, with the shortest baseline between two antennas of m. These observations used a bandwidth of 2048 MHz centred at frequencies of 5500 MHz and 9000 MHz, for which the largest well-imaged structure have the angular sizes of arcsec and arcsec respectively.
The observations totalled 12 hours of integration time in each band. PKS B1934–638 was used as the primary (absolute flux density and bandpass) calibrator, and PKS B0826–373 was used as the secondary (time-varying gains) calibrator. The miriad111http://www.atnf.csiro.au/computing/software/miriad/ (Sault et al., 1995) and karma222http://www.atnf.csiro.au/computing/software/karma/ (Gooch, 1995) software packages were used to reduce and analyze the data. Images were formed using miriad and the multi-frequency synthesis tasks (Sault & Wieringa, 1994) with a Briggs weighting of robust (R=0) parameter for both the 5500 and 9000 MHz images. Both images were deconvolved using mfclean and primary beam correction was applied afterwards. The 5000 MHz image has a resolution of arcsec, while the 9000 MHz image has a resolution of arcsec. We also note an effect of the primary beam correction and the limitation in the outer region the ATCA images.
| Radio Observatory | Date | Frequency (MHz) | Bandwidth (MHz) | FoV (degrees) | Resolution (arcsec) | P.A. (degrees) |
| ASKAP | 2019 Apr 10 | |||||
| ATCA | 2020 Sep 30 | |||||
| ATCA | 2020 Sep 30 | |||||
| MWA | 2018 Feb 4, 20; Mar 5 | |||||
| VLBA | & | |||||
| X-ray observatory | Date | Observing time (Sec) | Energy band (keV) | FoV (arcmin) | Resolution (arcsec) | |
| Chandra | 2011 Jul 12 | |||||
| eROSITA / | 2020 May 11-18 | |||||
| Swift | 2018 Sep 2,16 | , |
2.4 Very Long Baseline Array
The galaxy NGC 2663 has been observed by the VLBA operated by the National Radio Astronomical Observatory (NRAO). The VLBA is a network of ten 25-meter radio telescopes located across the United States (Napier et al., 1994). This network regularly participates in the observing program organised by the International Very Long Baseline Interferometry (VLBI) Service (IVS) (Schuh & Behrend, 2012). The goal of this project is to measure high-precision absolute positions of weak radio sources. Observations are done in dual-frequency mode (S-band, 2300 MHz, and X-band, 8400 MHz), but S-band is used only to calibrate very fast fluctuations of the ionosphere. There are five IVS experiments between 2009 and 2018 in which the galaxy NGC 2663 was successfully detected as IERS B0843–336 (Table LABEL:table_VLBI_obs) – RDV75 (2009 May 13), UF001H (1st May 2017), UF001S (9th October 2017), UF001T (21st October 2017), UG002F (29th April 2018). Where RDV stands for “Research and Development VLBI”, while the other letters (UF and UG) are internal designations for VLBA experiments. Numbers 001, 002 stand for proposal term, and the following letters (A, B, …, H) are the serial number of an experiment. Correlated VLBI observations available at the IVS data were processed by the OCCAM software (Titov et al., 2004) using the standard procedure of the VLBI data reduction recommended by the International Earth Rotation Service (IERS) (Petit & Luzum, 2010).
The positions of 303 so-called ICRF3 defining radio sources were fixed (Charlot et al., 2020), and positions of all other sources were estimated in each of these five experiments separately. The coordinate estimates for the peak brightness position of NGC 2663 vary within 4 mas over these five epochs, while the formal error is between 0.7 and 1.7 mas in RA, and between 2 and 5 mas in Dec. We thus conclude that the observed positional variations are below the threshold, so the radio source NGC 2663 is astrometrically stable.
2.5 Hubble Space Telescope
We have also accessed HST observations from the Hubble Legacy Archive (Proposal ID 11219). These observations are from 30th October 2007 and the total exposure time is 1151.84 seconds. The wide-field camera 3 is used with the IR Wide-Band (W) Filter F160W that covers 1400–1700 nm range and effective resolution is 0.3 arcsec.
| Date | RA (J2000) (h m s) | (sec) | Dec. (J2000) (∘ ′ ″) | (″) |
| 2009 May 13 | ||||
| 2017 May 1 | ||||
| 2017 Oct 9 | ||||
| 2017 Oct 21 | ||||
| 2018 Apr 29 |
2.6 Chandra X-Ray Observatory
NGC 2663 was the target of a pointed observation made with the Chandra X-ray Observatory on 12th July 2011. The observation was made using the ACIS-S3 chip in very faint mode. The archival dataset was downloaded from the Chandra data archive333http://cda.harvard.edu and processed using the CIAO Interactive Analysis of Observations (CIAO) software package (Fruscione et al., 2006) Version 4.12 (CALDB Version 4.9.1). The CIAO tool chandra_repro was used to reprocess the dataset with the latest calibration: in addition, standard light curve filtering to address the effects of any background flares was applied to the dataset. After this processing, the effective exposure time of the observation was 7.5 kiloseconds. The CIAO tool dmxtract was used to extract a spectrum and a light curve of the central nuclear source while the CIAO tool fluximage was used to produce exposure-corrected images of the central source. The results of our imaging and spectroscopic analysis of this observation are presented in Subsection 3.5.1.
2.7 Neil Gehrels Swift Observatory
The Neil Gehrels Gamma-Ray Burst Explorer Mission Swift (Gehrels et al., 2004) observed NGC 2663 on 2nd and 16th September 2018 for 750 and 483 sec, respectively (target ID 3109192). The observations with the Swift X-ray Telescope (Burrows et al., 2005, XRT,) were obtained in photon counting mode (pc mode, Hill et al., 2004). Source counts were extracted with xselect in a circular region with a radius of 47 arcsec, and background counts in a nearby source-free region with a radius of 236 arcsec. Due to the small number of counts (16 in total) we combined the data of two observations into one source and background spectrum. The auxiliary response files were created from each source spectrum with xrtmkarf and combined into one with the ftool addarf. For the spectral analysis we use Cash statistics (Cash, 1979) within XSPEC version 12.10.1f (Arnaud, 1996).
Swift also observed the field of NGC 2663 with its UV-Optical Telescope (UVOT, Roming et al., 2005) in its u and uvw1 filters during each observation (central wavelengths are 3465Å and 2600Å, respectively). The magnitudes and fluxes were determined with the UVOT tool uvotsource with a source extraction radius of 3 arcsec and the aperture was corrected by the aperture parameter set to apercorr=curveofgrowth. The most recent calibration files were used as described in Poole et al. (2008) and Breeveld et al. (2010). The magnitudes were corrected for Galactic reddening () following equation (2) in Roming et al. (2009) using the reddening curves by Cardelli et al. (1989). The results of Swift observations are presented in Subsection 3.5.2.
2.8 eROSITA
NGC 2663 was observed with eROSITA (Merloni et al. 2012; Predehl et al. 2021), the primary instrument onboard the Russian Spektrum-Röntgen-Gamma (SRG) mission as part of the first all-sky survey (eRASS1). The observation took place between 11th and 18th May 2020, and all seven cameras (TM1-TM7) were operational. Version c946 of the standard eROSITA data processing (Brunner et al., 2021) was used to retrieve prepared event lists. Source photons were extracted from a 60 arcsec region centred on the source, while background photons were extracted from an annulus with an inner radius of 140 arcsec and an outer radius of 240 arcsec. There are 48 counts from the source detected in the energy range. The source and background spectra were grouped to a minimum of one count per bin, and Cash statistics (Cash, 1979) are used in spectral analysis. The background has been modelled, rather than subtracted from the source. Complete analysis and results from eROSITA are presented in Subsection 3.5.4.
3 Results
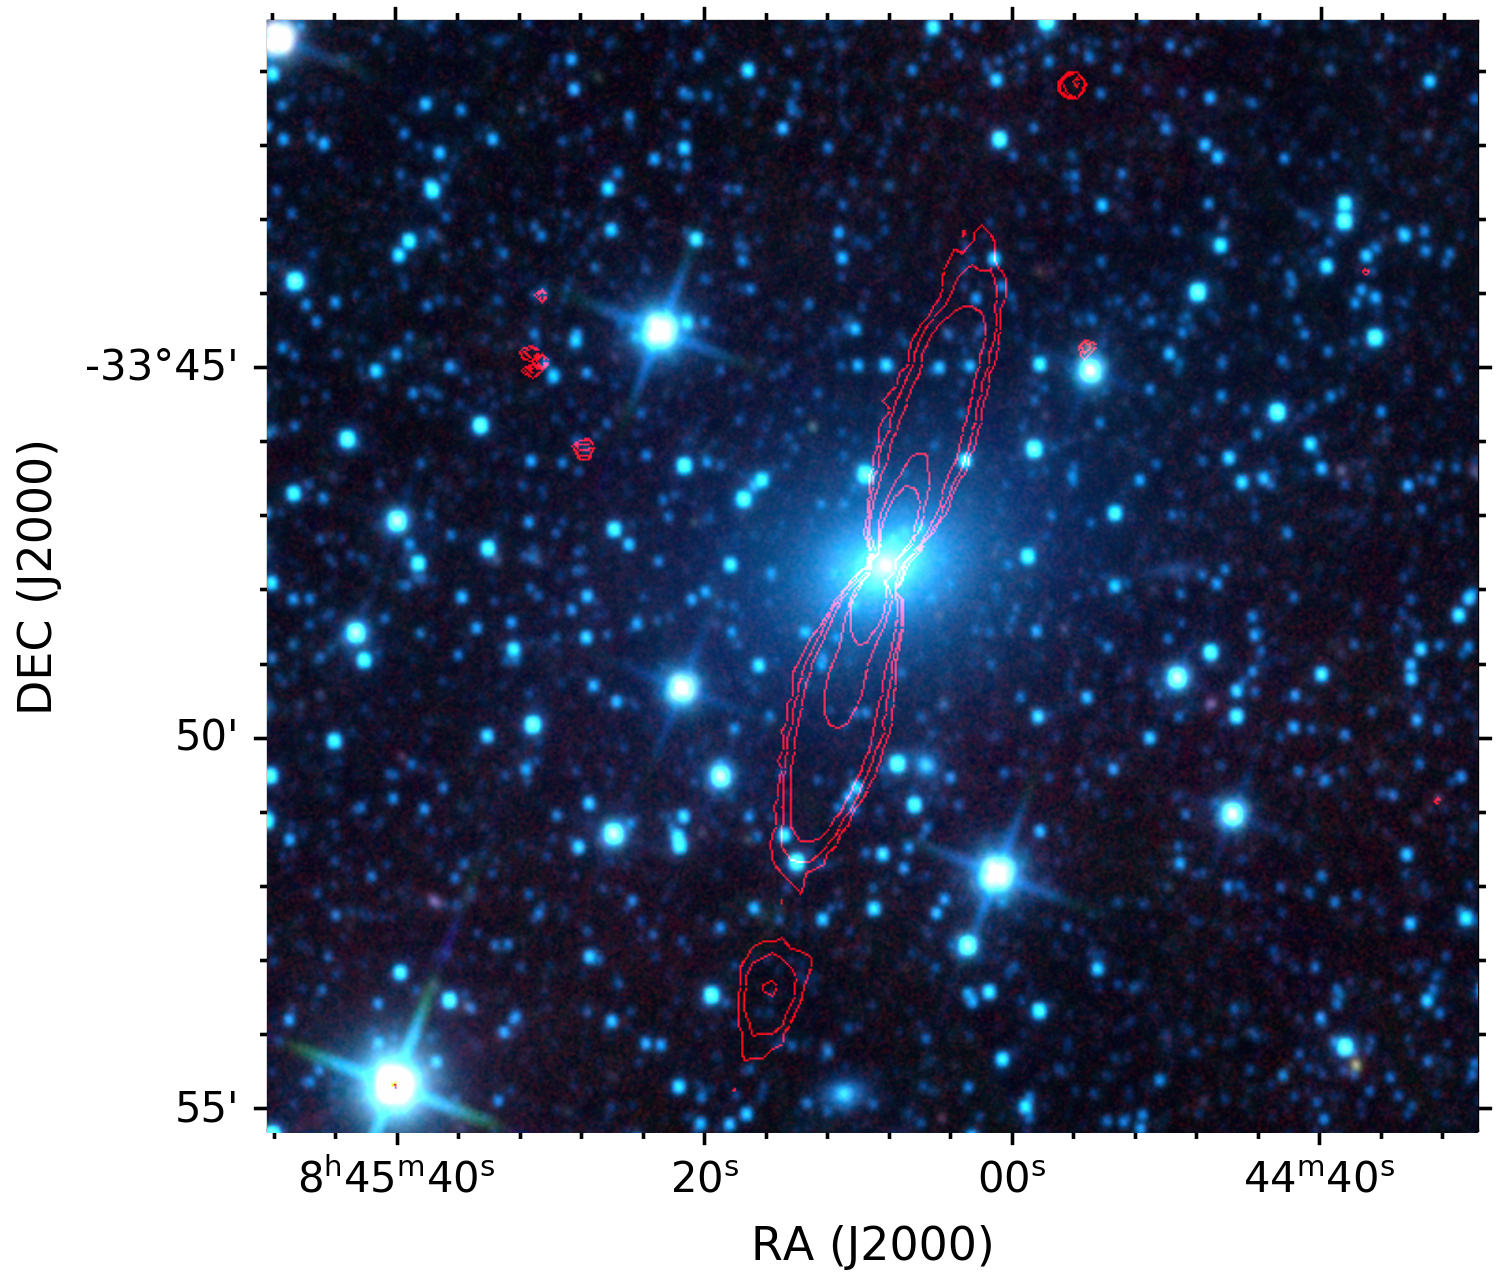
NGC 2663 is a large and massive elliptical galaxy with stellar mass of (Jarrett et al., 2013) and radio jets that extend over 43 arcmin across the sky. Assuming a distance to the galaxy of 28.5 Mpc its size corresponds to 355 kpc. To study the distribution of cold neutral hydrogen in and around the galaxy NGC 2663 we used HIPASS data (Barnes et al., 2001) which did not show H i emission nor absorption associated with NGC 2663.
In this section, we present our observational results, and analyse the properties of the jet and its environment.
3.1 Jet structure
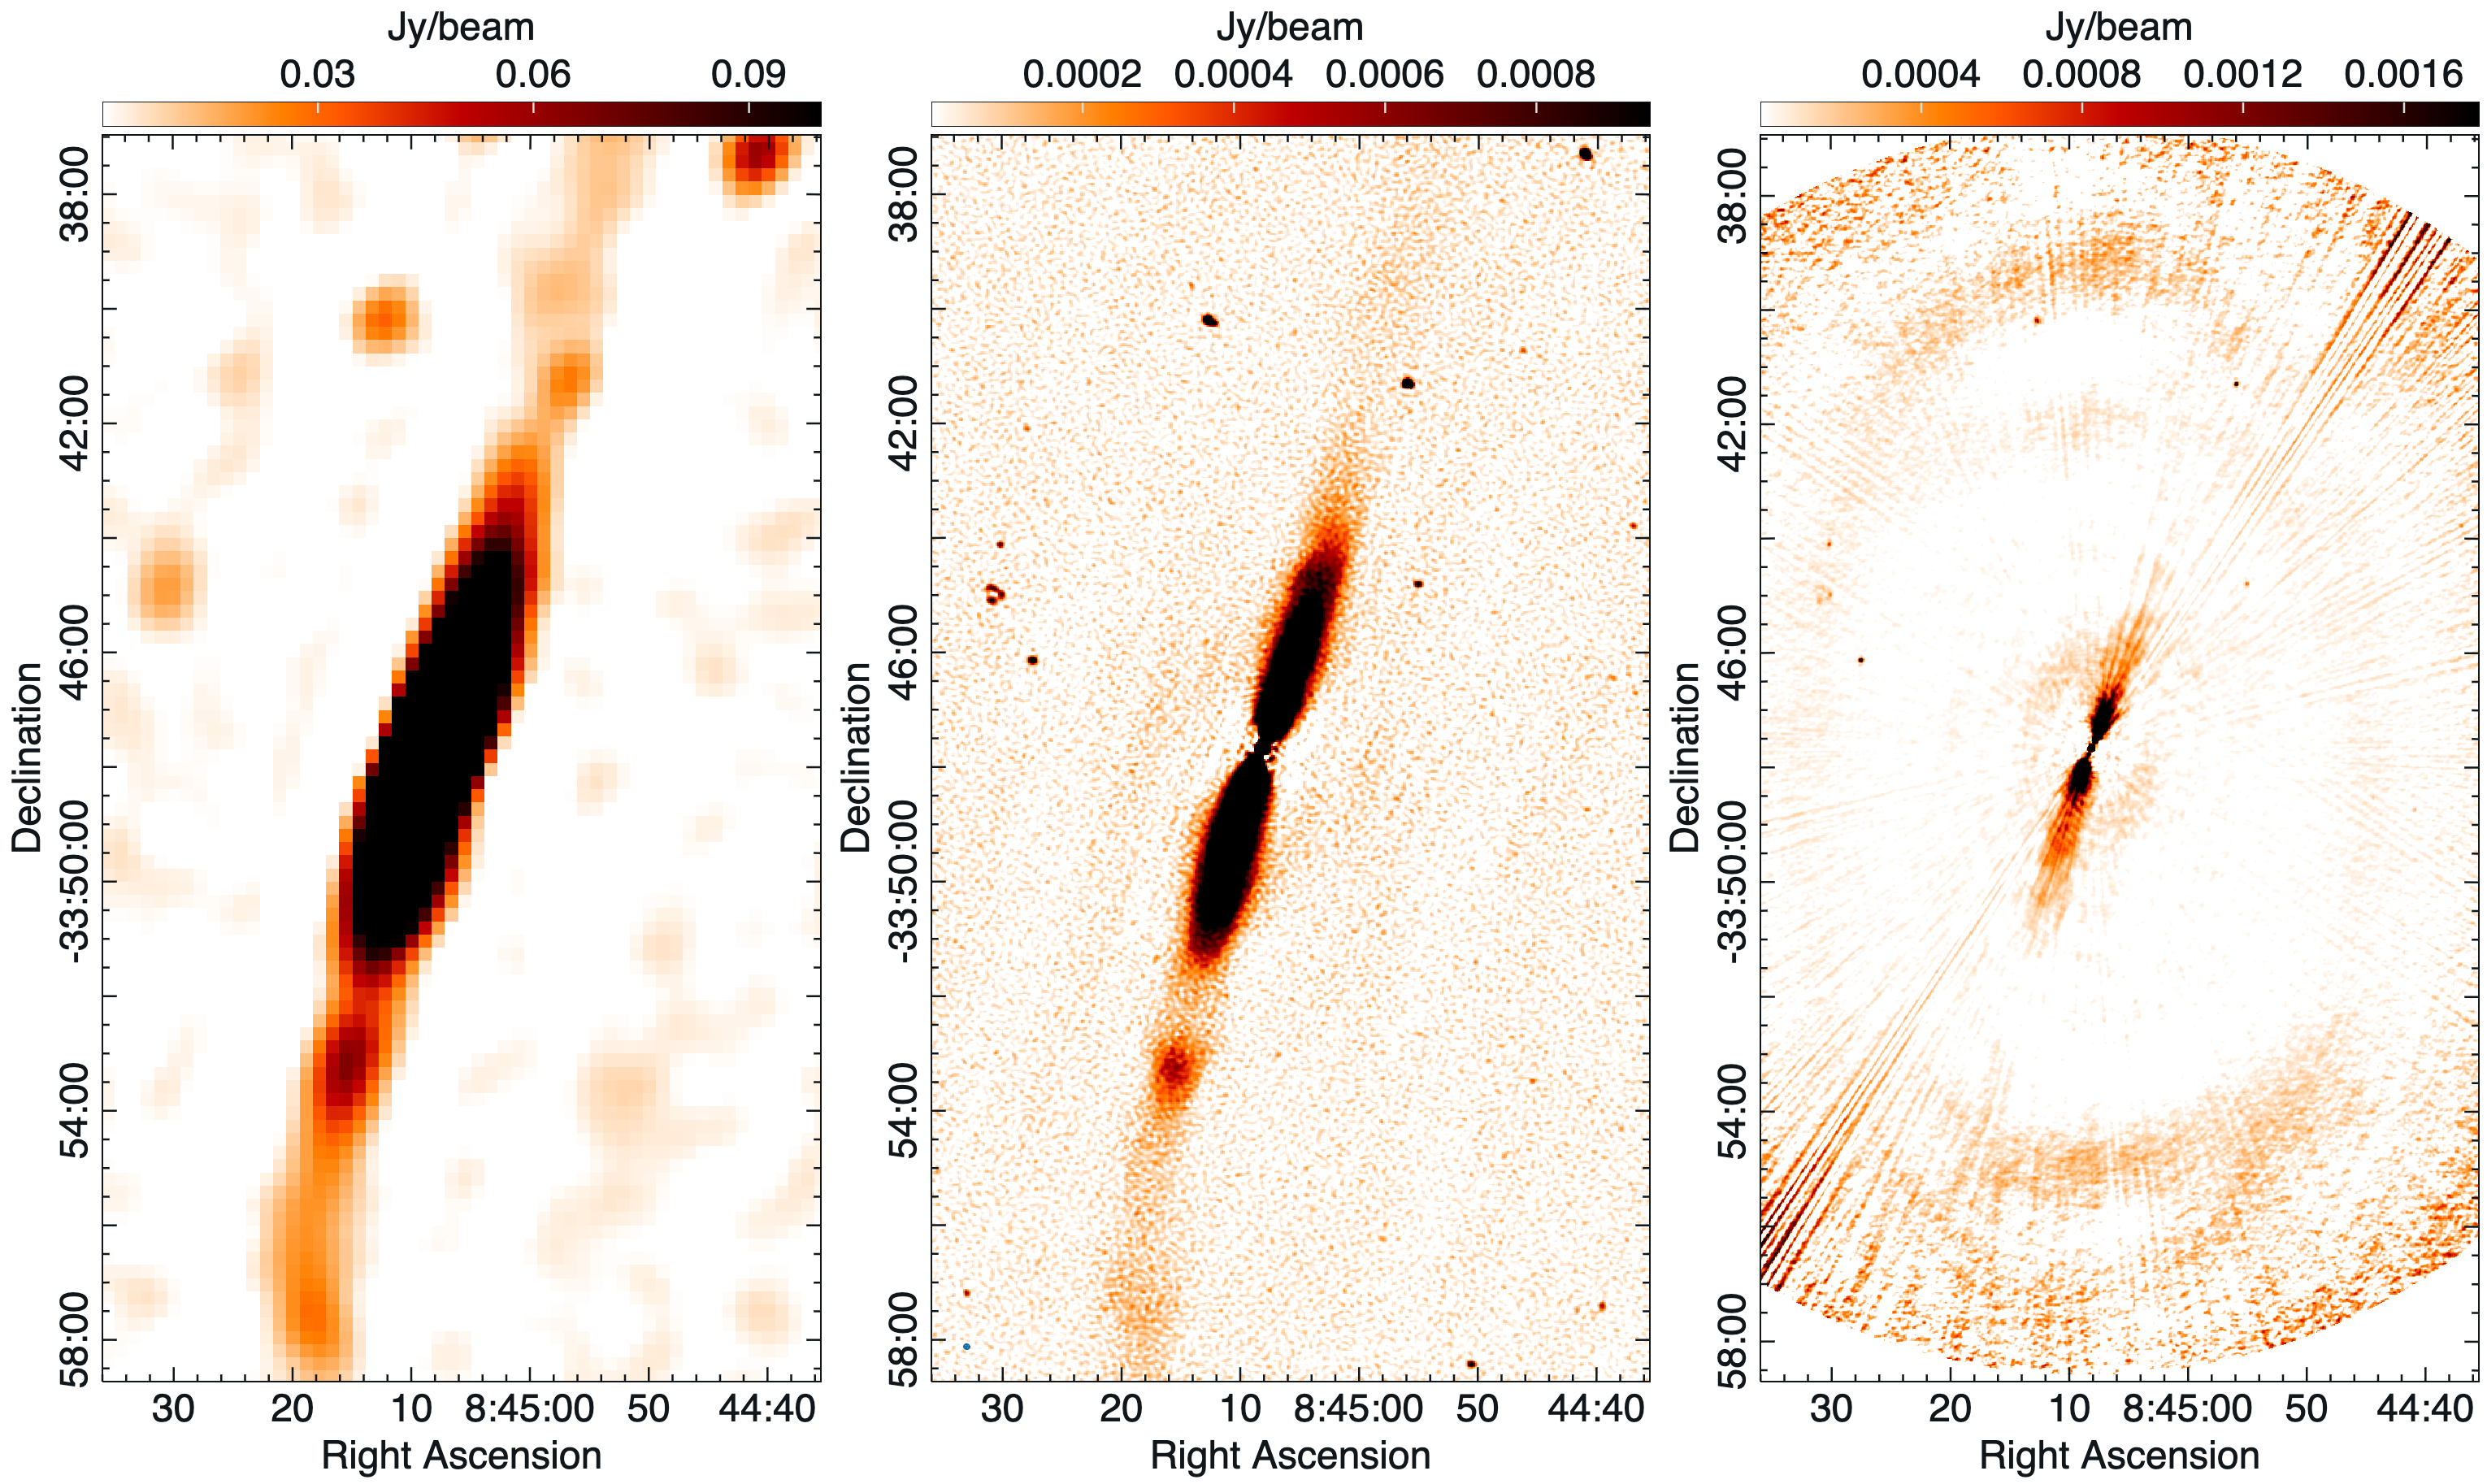
Fig. 1 shows detection of NGC 2663 with ASKAP, MWA and ATCA at three different frequencies, MHz, MHz and MHz respectively. The southern jet has an initial flare as it leaves its host galaxy, at arcsec from the core. The radio jets of NGC 2663 have an opening angle of in the innermost region. After this initial increase in width, the jet maintains a roughly constant width to the outer regions of the jet. Similar jet expansion profiles of 15 other AGN jets have been reported by Boccardi et al. (2021).
In the southern jet (left in Figure 2), we see at least one and plausibly three regions (knots) in which the jet increases significantly in brightness. These are located at 295, 530 and 690 arcsec (41, 73 and 95 kpc) from the core. They resemble similar features as in other AGN jets that are identified as (re)collimation shocks on pc scales. Recollimation is characterised by a simultaneous narrowing and brightening of the flow, as the flow lines converge, followed by a broadening and fading of the jet. We will examine this scenario further in the next section.
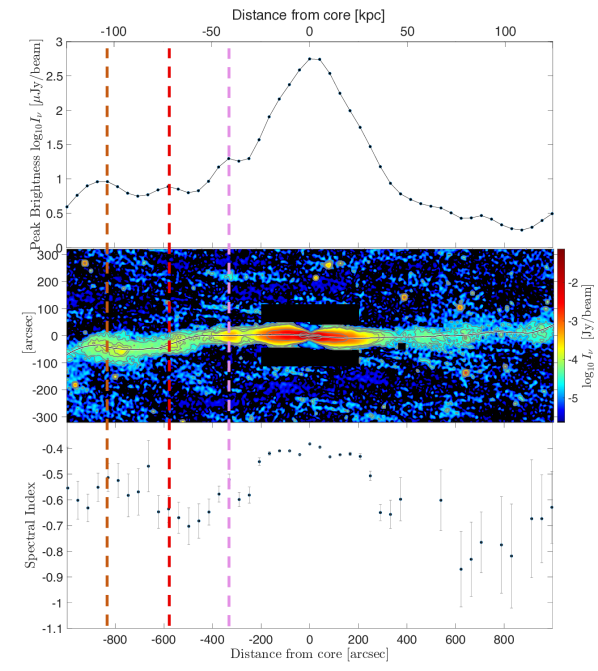
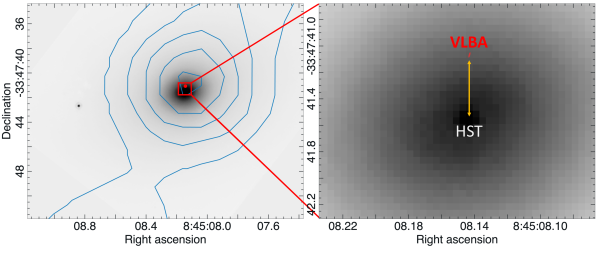
Fig. 3 shows a positional offset between the NGC 2663 HST centre (at RA(J2000)=8h45m8.141s and Dec(J2000)=33∘47′41.54″) and VLBI (RA(J2000)=8h45m8.144s and Dec(J2000)=33∘47′41.07″; mas). This 0.470.3 arcsec offset equates to 70 pc at the distance of NGC 2663. At the time of the observations (2007) the HST pointing accuracy was 0.3 arcsec444https://hst-docs.stsci.edu/drizzpac/chapter-24-astrometric-informationin-the-header/4-5-absolute-astrometry which indicates that this discrepancy might largely be due to the telescope astrometric error. However, this shift in position might also indicate that the central SMBH is offset from the optical/IR centre of NGC 2663. This is not unusual: Makarov et al. (2017) present astrometric evidence for a population of dislodged AGN. The most massive elliptical galaxies (such as NGC 2663) have low-density cores that differ significantly from the high-density centers of less massive ellipticals and the bulges of disk galaxies (Thomas et al., 2014). These low-density cores are most likely the result of SMBH binary mergers, which depopulate galaxy centers by gravitationally sling-shotting central stars outward. Such binaries naturally form in mergers of luminous galaxies (Thomas et al., 2014). Alternatively, this offset might be due to the VLBA detecting an inner knot of the radio jet rather than the galaxy nucleus.
3.2 Polarisation and rotation measure
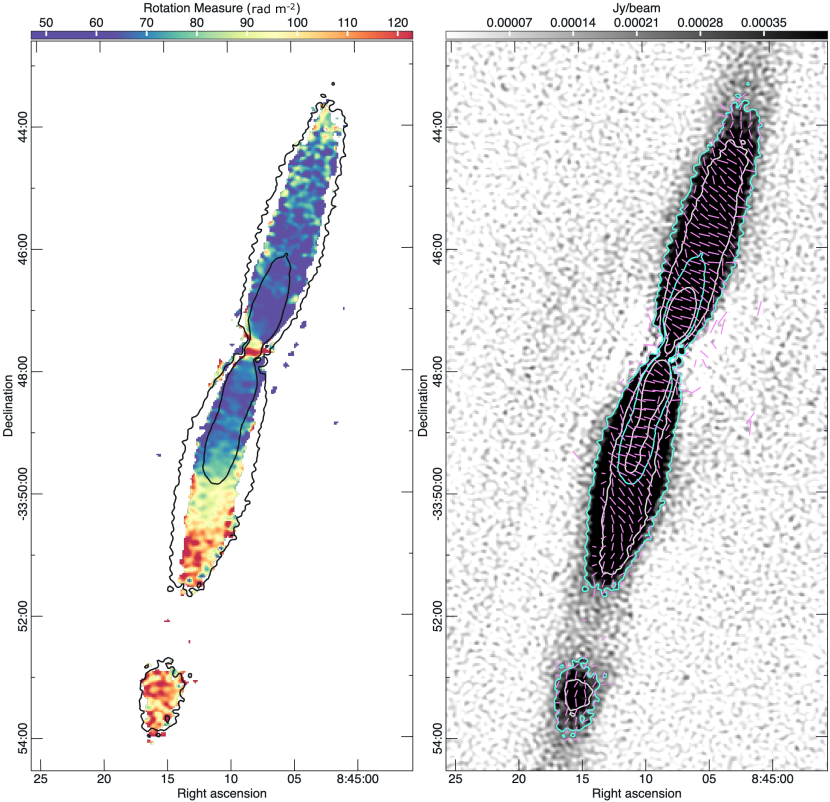
We made images of I, Q and U polarisation and apparent magnetic field direction, the latter by correcting the observed angles for Faraday rotation determined from the two frequencies, when the RM could be reliably determined.
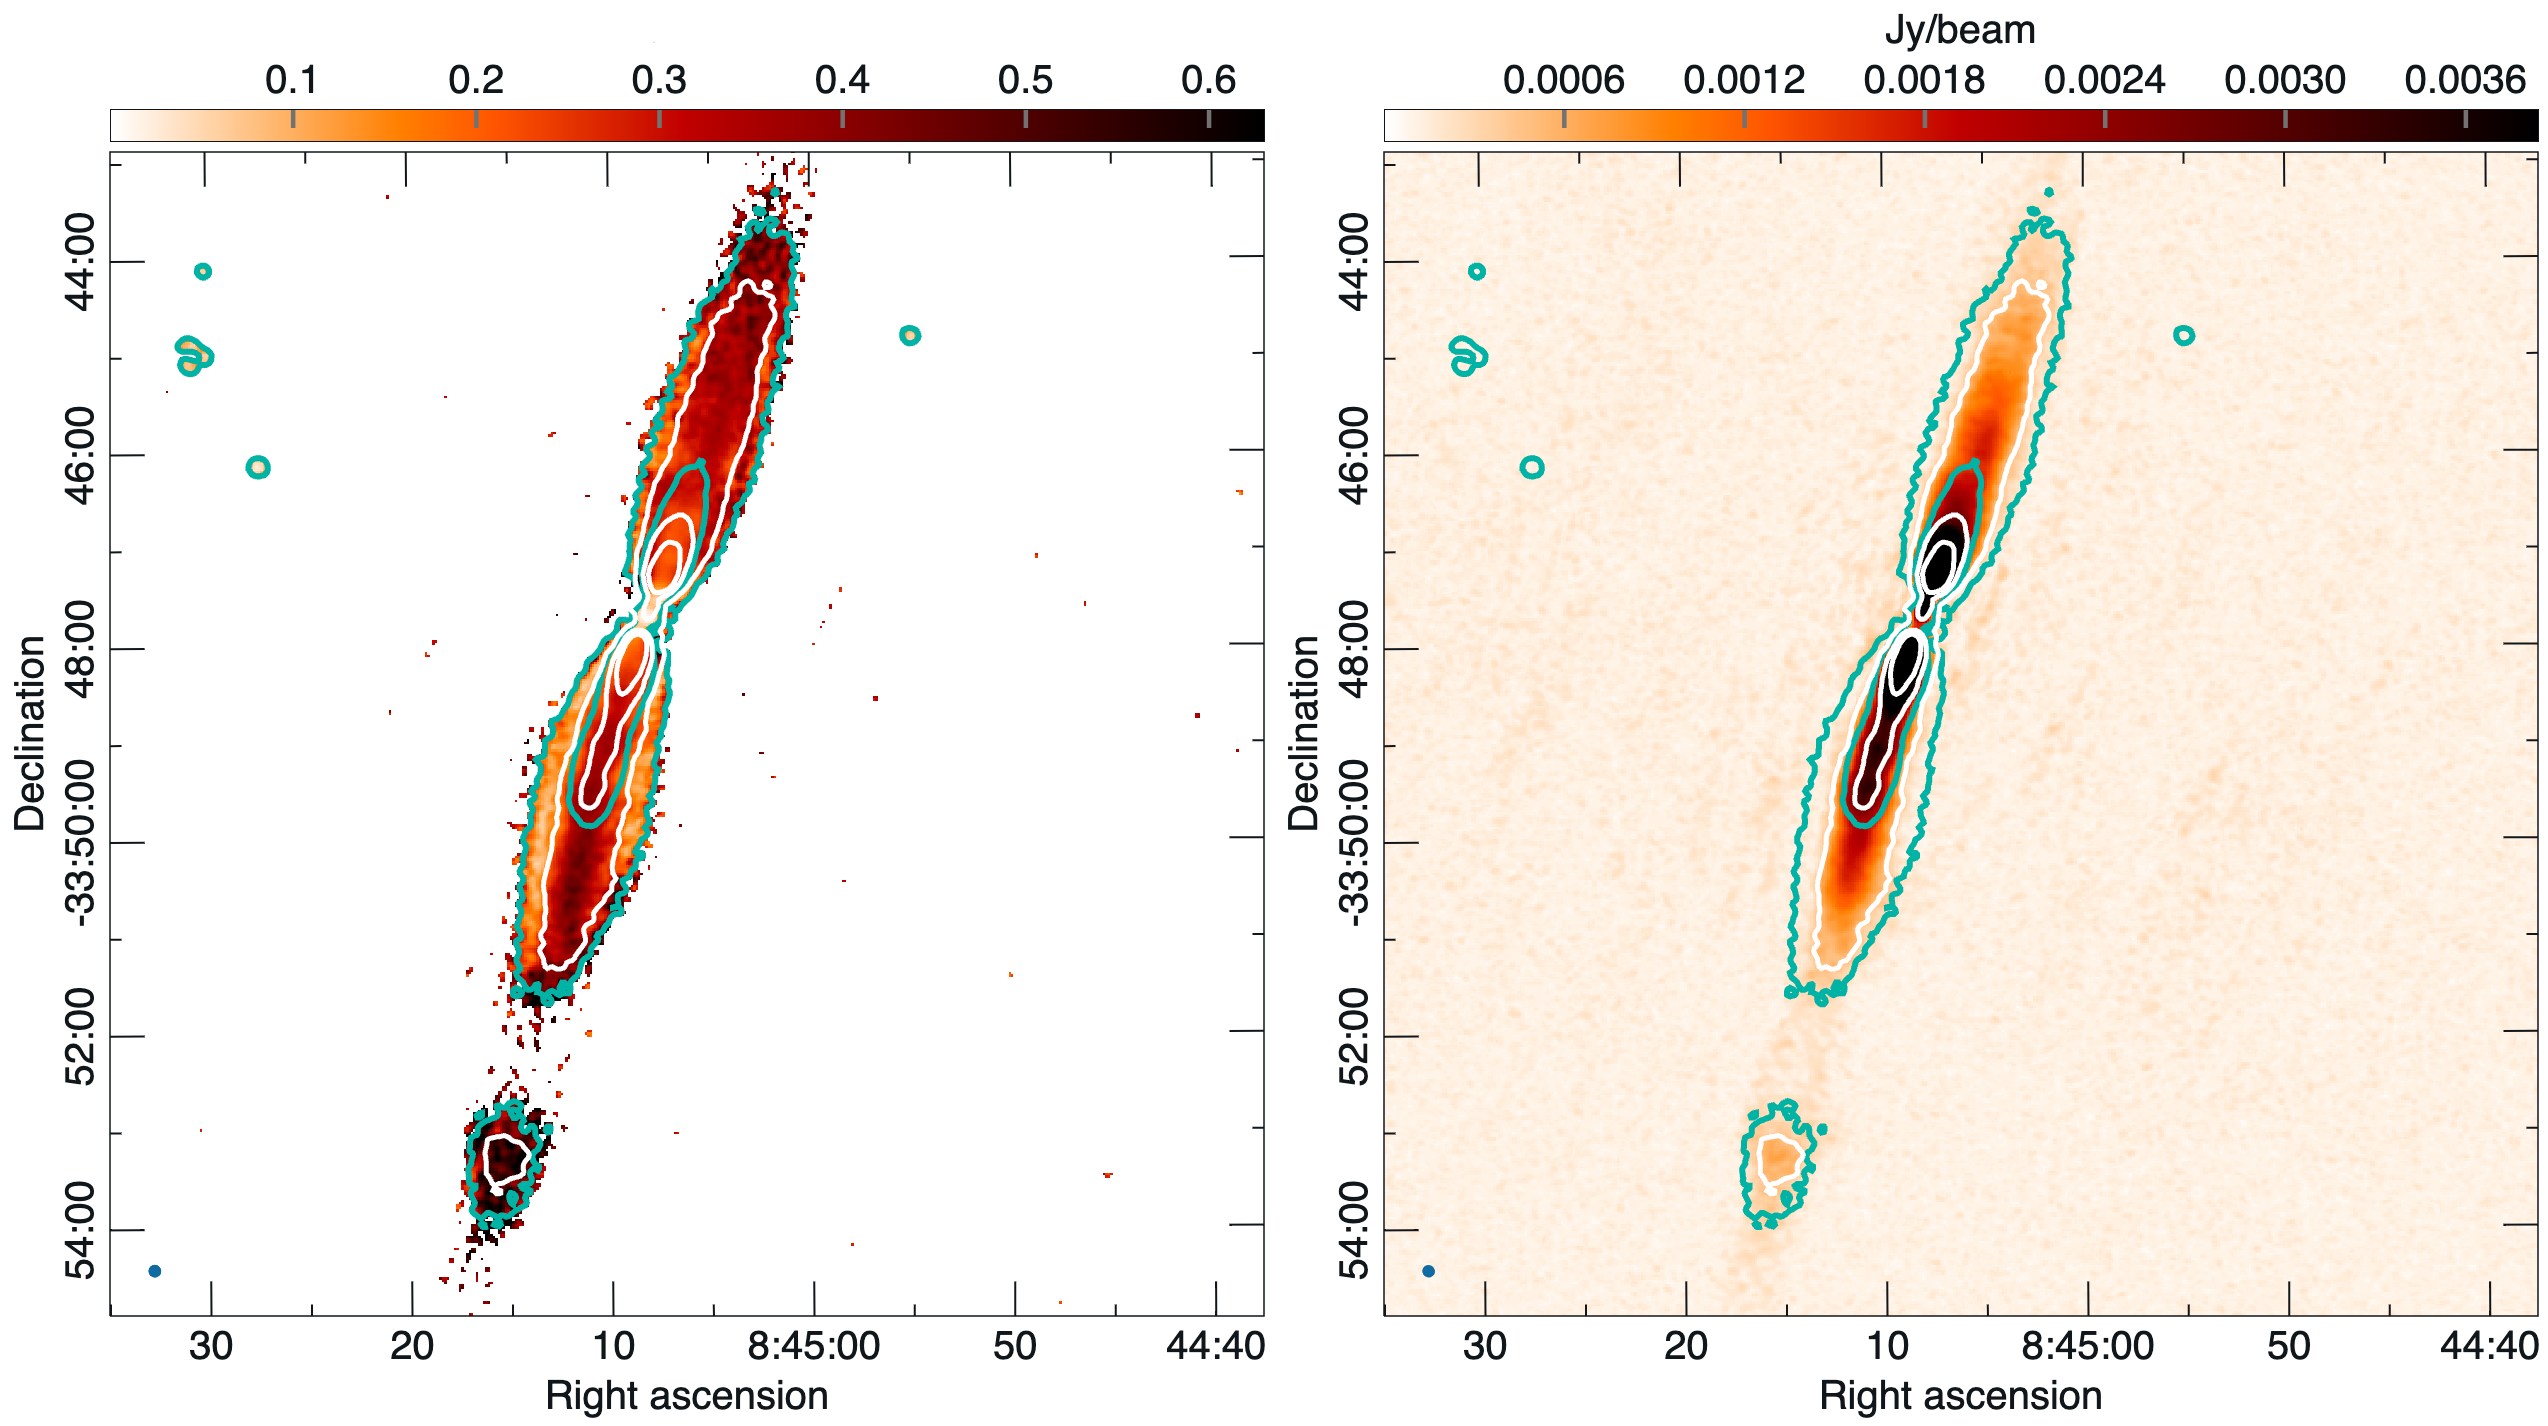
Fig. 4 shows dominant linear polarization along the jets. It shows an interesting feature where fractional polarization is highest along the ridge line and drops towards the edge of the jet. In the southern jet around kpc fractional polarisation significantly increases in the region where the knot appears to be.
Fig. 5 shows a map of RM and total intensity image overlaid with contours of the Stokes I image and magnetic field vectors (magenta lines) which are predominantly oriented transverse to the jet axis, which is expected in FR i jets (Kronberg, 1994). However, the magnetic field vectors in the knot are aligned with the jet direction. In the northern jet and the inner portion of the southern jet we calculate similar narrow distributions of RM with a mean of rad m-2, at approximately 2 arcmin from the core in the southern jet the distribution of RM broadens with a mean of rad m-2. This suggests that radiation originating from the southern jet passes through more surrounding material which suggests that NGC 2663 is slightly inclined to the plane of the sky, with the northern jet pointing towards us (Garrington et al., 1988). Using the CIRADA cutout server555http://cutouts.cirada.ca/rmcutout/ we obtained the expected Galactic foreground rotation measure at the position of NGC 2663. The northern side shows rad m-2, while the southern side of the NGC 2663 has Galactic foreground emission of rad m-2 (Hutschenreuter et al., 2022).
3.3 Spectral index
The spectral index of NGC 2663, defined using , was calculated using images obtained with the MWA at 200 MHz and ASKAP at 1500 MHz convolved to the same resolution of arcsec. We performed 1D Gaussian fits to cuts perpendicular to the jet axes in the two images and used their peak brightnesses to get the indices. In the bottom panel of Fig. 2 we show the distribution of the spectral index along both jets where the southern jet is on the left. The NGC 2663 jets have a spectral index of for up to 200 arcsec (40 kpc) on each side of the core, far beyond of what would be expected from a compact core alone. It is flatter than in other AGN jets on kpc scales (see: Katz-Stone & Rudnick, 1997, Laing et al., 2008a, Laing et al., 2008b, Cantwell et al., 2020). We note that spectra of the base of the jets using higher resolution, higher frequency observations from ATCA (1384 MHz and 2368 MHz) show spectral indices of –0.7 in this region. Observations at other low frequencies would be needed to confirm the apparent spectral curvature.
Further along the southern jet in a region from 200 to 400 arcsec (40-80 kpc; marked with the pink dashed line on Fig. 2) the spectrum sharply steepens to before flattening to about at the first knot. We observe a similar effect in regions 400 to 600 arcsec (red dashed line in Fig. 2), 600 to 800 arcsec (dark red dashed line in Fig. 2) and even beyond 800 arcsec from the core of NGC 2663. This may indicate that the jet has been re-energised at the knots. In the north, the spectral index steepens to , with the steepening leveling off further out. These steepening patterns likely represent a combination of spectral losses and changing magnetic fields. However, with the current data, it is not possible to tell whether the leveling off and flattening requires particle acceleration or can simply be explained by changes in the magnetic field strength.
3.4 Host galaxy: WISE
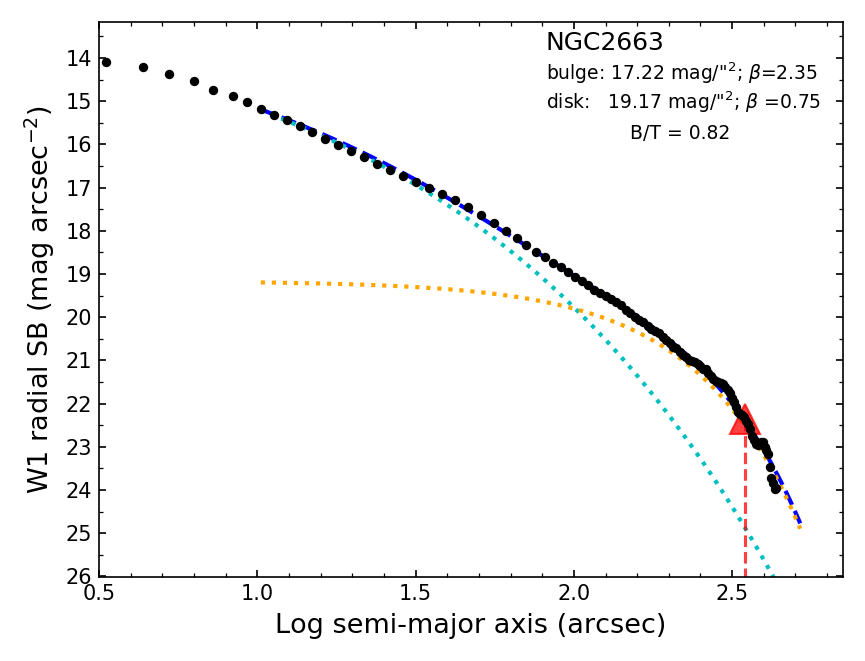
Fig. 6 (left) shows the mid-infrared view from WISE using the stellar-sensitive bands at 3.4m (W1) and 4.6m (W2), and the ISM sensitive band at 12m (W3). They reveal that NGC 2663 is a typical red-and-dead elliptical galaxy. It shows little evidence of star formation or a gas disk. It is nearly dust-free. The central region is detected in the and m bands. This emission arises from the old stellar population, and likely, from warm/hot dust in the AGN (Cluver et al., 2017), which is consistent with low-power FR i AGN being radiatively inefficient (Hine & Longair, 1979). Infrared observations from WISE show no sign of dust associated with the SMBH accretion disk.
The host galaxy is very bright and luminous, and dominates any radiation from the AGN. Fig. 6 (right) shows the axi-symmetric radial surface brightness profile of stellar light, from which we see that NGC 2663’s elliptical shape has a bulge-to-total ratio of 0.82, and hence is dominated by the bulge/spheroidal stellar population (Jarrett et al., 2013; Jarrett et al., 2019).
3.5 X-ray emission
An analysis of the X-ray emission from NGC 2663 as observed with three different instruments shows complementary results. The environment surrounding NGC 2663 is rarefied: there is no diffuse emission except in the vicinity of the core. No X-ray emission is detected from the jet. This is certainly unusual for AGN, and is discussed more in the following sections.
3.5.1 Chandra X-Ray Observatory
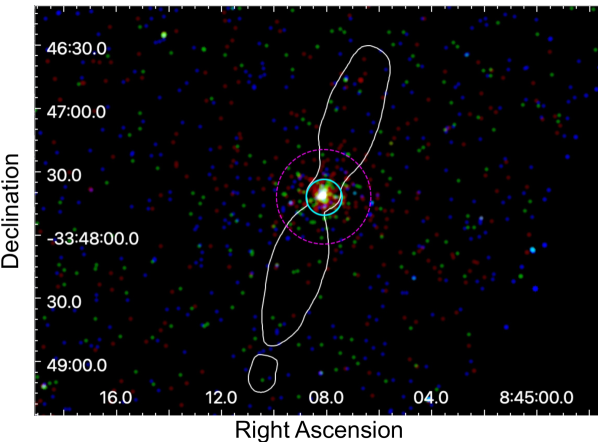
A Chandra image of NGC 2663 is presented in Fig. 7 with ASKAP radio contours. The three-color image indicates that the central source produces a mixture of emission from the soft and medium energy bands (corresponding to energies of 0.5 keV to 1.2 keV and 1.2 keV to 2.0 keV, respectively). The emission appears to be elongated in the same direction as the radio jets.
A Chandra spectrum corresponding to the central region of NGC 2663 was extracted using a circular region centred at RA (J2000.0)=08h 45m 08.1s and Dec. (J2000.0)=33∘ 47′ 42.1″ with radius of arcsec. A background spectrum was extracted from an annular region centred on the source region: the radius of this background extraction region was 14 arcseconds. The spectrum was fitted over the energy range from 0.7 keV to 3.0 keV with a combined model including the thermal component mekal which describes an emission spectrum from a hot diffuse gas (Mewe et al. (1985); Mewe et al. (1986); Kaastra (1992); Liedahl et al. (1995)) and a power law component. The combined model was multiplied by the Tübingen-Boulder absorption model TBABS with elemental abundances as tabulated by Wilms et al. (2000)) fixed to the Galactic column density cm-2 (Kalberla et al., 2005). In addition, for the fit parameters of the mekal model, the elemental abundances were frozen to solar values and the redshift was frozen to our adopted redshift value for NGC 2663 (that is, ). Using this combined model, a statistically acceptable fit was obtained (C-Statistic of 8.22 for 9 degrees of freedom). The fitted value of the temperature of the mekal component was keV and the fitted value of the photon index of the power law component was (quoted error bounds correspond to 90 per cent confidence limits).
The extracted Chandra spectrum as fit with this combined model is presented in Fig. 8. The measured unabsorbed flux of this source over the energy range given above is W m-2. At the adopted distance to this source and assuming a Hubble’s Constant value of 70 km/s/Mpc, this unabsorbed flux corresponds to an unabsorbed luminosity of W.
We have also conducted a timing analysis of the X-ray emission from this region using the CIAO tool glvary to search for time variability in the X-ray emission from this source during the observation. This tool is based on the Gregory-Loredo method for identifying variability in the X-ray emission from sources (Gregory & Loredo, 1992). Analysis with this tool indicated no evidence for time-variable X-ray emission.
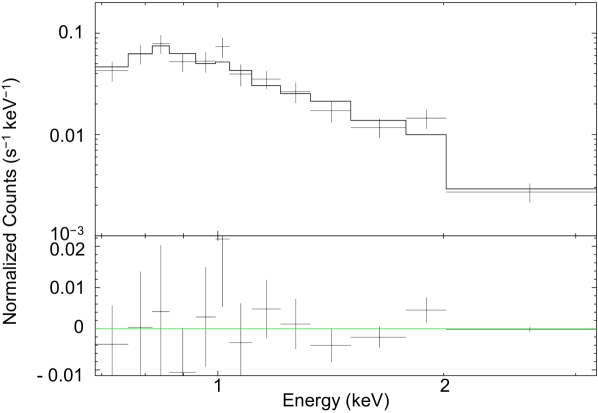
3.5.2 X-ray Swift
The X-ray spectrum from the Swift X-Ray Telescope was fitted with a single power law model with the absorption at fixed to the Galactic column density cm-2 (Kalberla et al., 2005) resulting in a photon index . The observed flux in the 0.3–10 keV band is 2.7 W m-2 which is W m-2 corrected for Galactic absorption. Given the NGC 2663 distance of 28.5 Mpc the luminosity of the source is W.
3.5.3 UV Swift
The magnitudes in u and uvw1 in the Swift UVOT in the first observation were (14.71) mag and (15.45) mag, respectively with the values in parenthesis denoting the magnitudes corrected for Galactic reddening. The measurements of the second observation do not suggest any variability in the UV between the two observations.
3.5.4 eROSITA
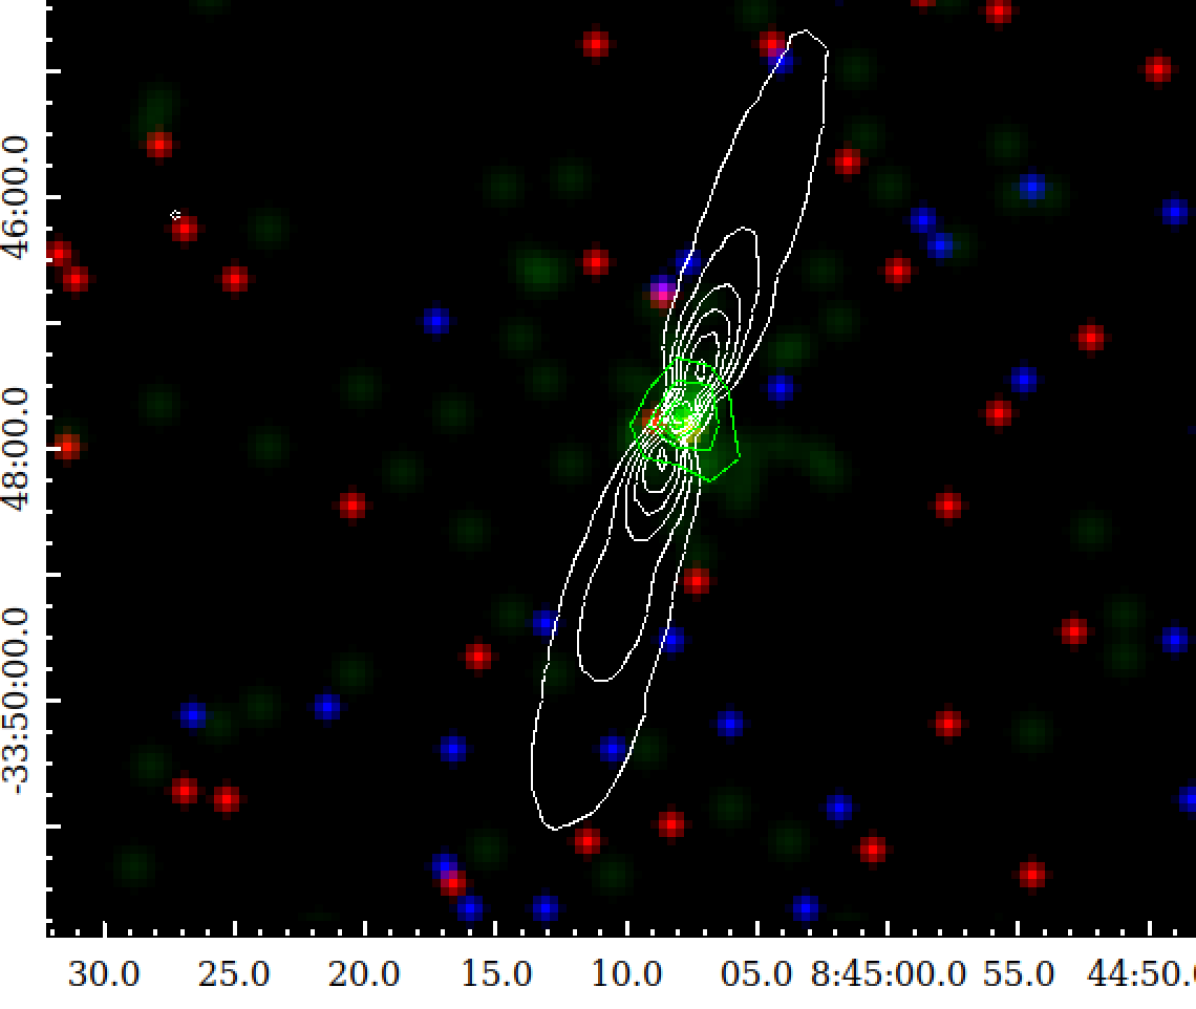
Fig. 9 shows the smoothed three-colour X-ray image from eRASS1, where red corresponds to the band, green is the band, and blue is the band. The blue and red (soft and hard) events in the image correspond to individual photons and are therefore associated with the X-ray background and not to real detected sources. The source is centred in the image, and is most significantly detected in the band and thus shown primarily in green. Over-plotted on the image are the X-ray contours from eROSITA (shown in green) and radio contours (shown in white). The core of NGC 2663 is detected with eROSITA, and the innermost radio position is matched with X-ray contours. There is no evidence for X-ray emission from NGC 2663 beyond the galaxy core, nor is there X-ray emission from a surrounding group medium.
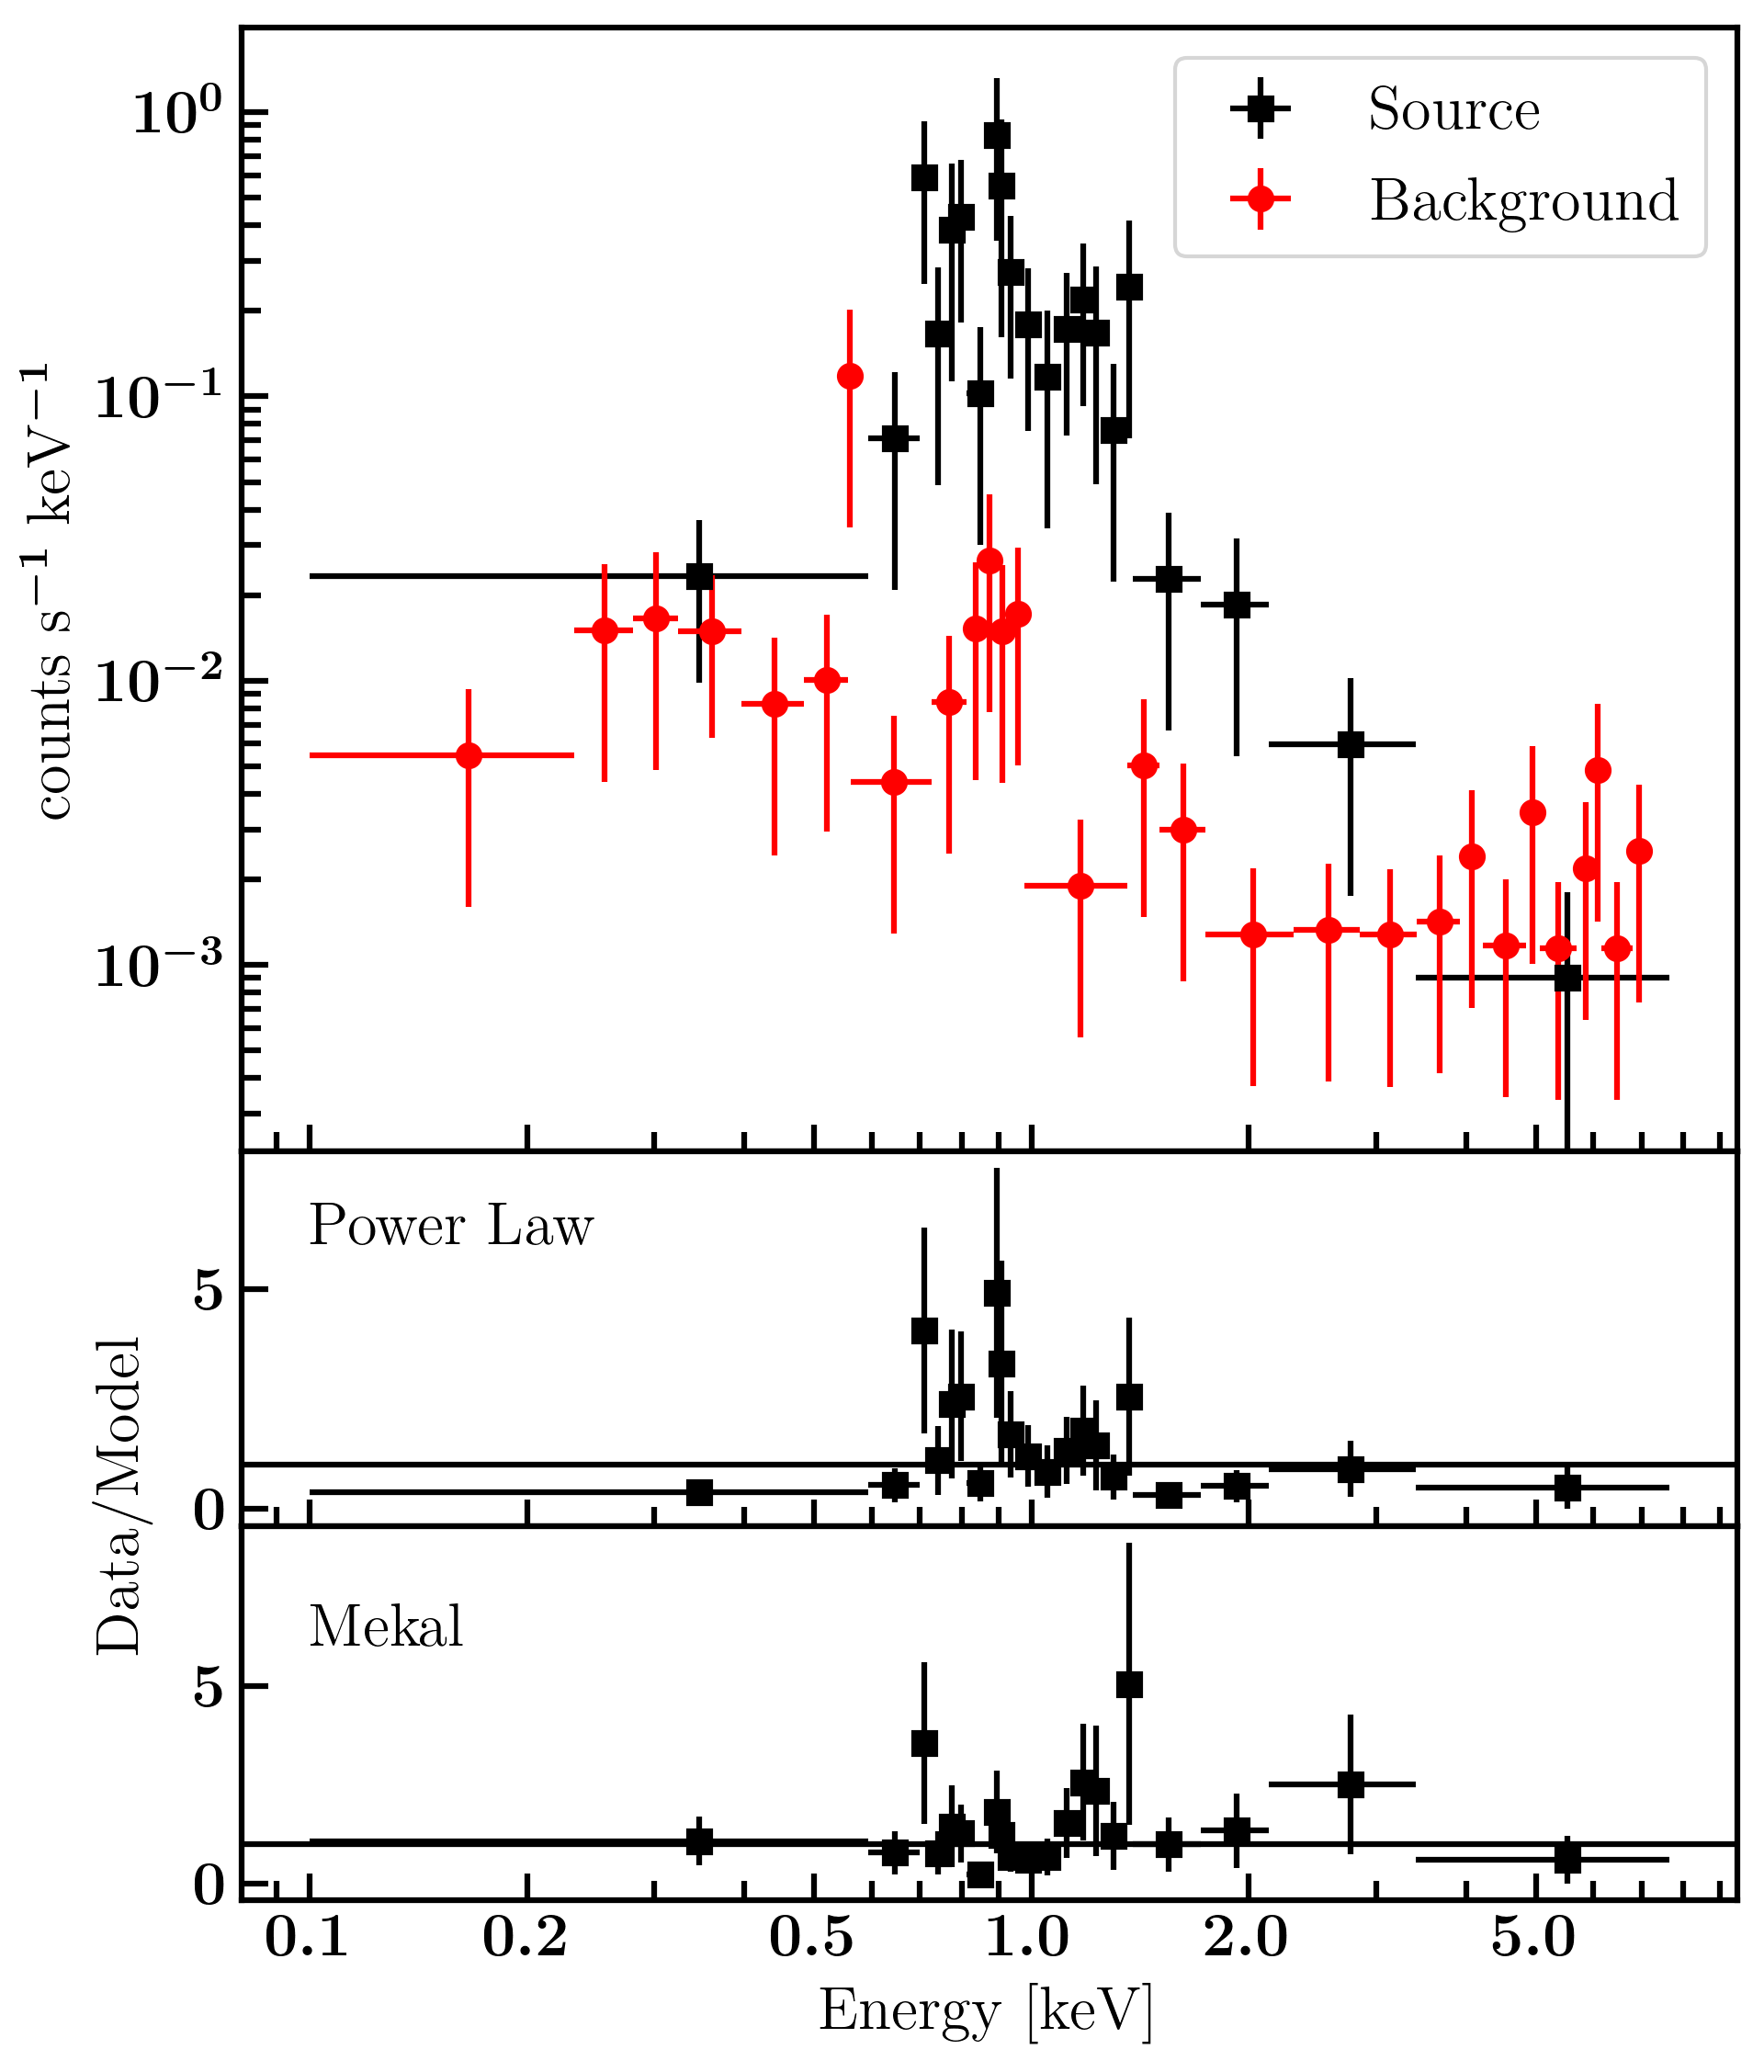
The top panel of Fig. 10 shows the source (black squares) and background (red circles) spectra acquired by eROSITA. Spectra have been re-binned in XSPEC for clarity. The source appears background dominated above , as well as below ; likely due to the high level of Galactic absorption (see 3.5.1). The middle panel shows the residuals (data/model) from a power law modified by Galactic absorption. The data are over-fit by this model, with a C-statistic of 59 for 109 degrees of freedom. A best-fit photon index of is measured, in agreement with both Chandra and Swift. This corresponds to a luminosity of 1.21034 W, a factor of higher than the luminosity from the Swift observation and about 5 times higher than the one detected with Chandra. This value is slightly lower than what is likely to be observed in a typical AGN. Furthermore, an examination of the light curve shows no evidence for variability over the course of the observation.
The eROSITA analysis is highly sensitive to the soft band, seems to prefer an ionised plasma origin for the emission rather than a purely jet-based origin. The ionized plasma may only be due to the host galaxy plasma, or star formation, or a combination of both. From the power law fit, clear positive and negative residuals remain across the spectrum. To model this, the power law component is replaced with mekal, to model emission from hot, diffuse gas (Liedahl et al., 1995). The residuals are shown in the bottom panel of Fig. 10. The fit improves by a of 6 for no additional degrees of freedom, and many of the residuals improve. Furthermore, the best fit plasma temperature of and luminosity of 5.51033 W are in agreement with those seen in hot, diffuse gas of LLAGN (Franceschini et al., 2003).
Using the same data we also fitted the combined model, mekal component and an absorbed power law. From this analysis we got a temperature of keV and a photon index of . The Bayesian evidence for the (mekal + power law) model is and for mekal alone, where the lower number indicates a better fit. The reason mekal model is a better fit is probably because the mekall component dominates the soft spectral shape where the eROSITA is highly sensitive, while the combined (mekal+power law) model is too complex for the given data. The slight difference between Chandra and eROSITA might also indicate that the NGC 2663 varied between the two observations.
4 Discussion
The multi-frequency appearance of NGC 2663 raises a number of questions about the physical causes that determine the size and shape of its AGN jet. Why is it so large, and why does it seem to recollimate? What combination of nature (the AGN) and nurture (the galactic and intergalactic environment) best explains its properties? It is quite important for our understanding of jet physics to establish whether recollimation — the physical, rather than merely apparent, narrowing of the jet — is taking place. NGC 2663 provides us one of the best current opportunities to do that, so we examine this possibility in detail. We will first present the case for recollimation, and then consider some alternative mechanisms.
4.1 Bright knots: recollimation?
As some of the terms relevant for this discussion are not used consistently in the literature, we start with some definitions. We assume that, following an initial magnetically-dominated acceleration phase on parsec scales, a conical, hydrodynamic jet emerges with a certain opening half-angle (as in, for example, M 87; Asada et al., 2014).
Collimation occurs if, for internal or external reasons, the jet becomes cylindrical, travelling with an approximately fixed width. Many (perhaps most) AGN jets, after an initial widening stage, are observed to travel large distances without observably diverging (Condon et al., 2021), suggesting nearly parallel streamlines in the jet fluid.
Recollimation occurs when an already collimated jet narrows (rather than merely straightens). This has elsewhere been called reconfinement or pinching. This may occur because of external, environmental forces on the jet, or because of internal forces or instabilities in the jet.
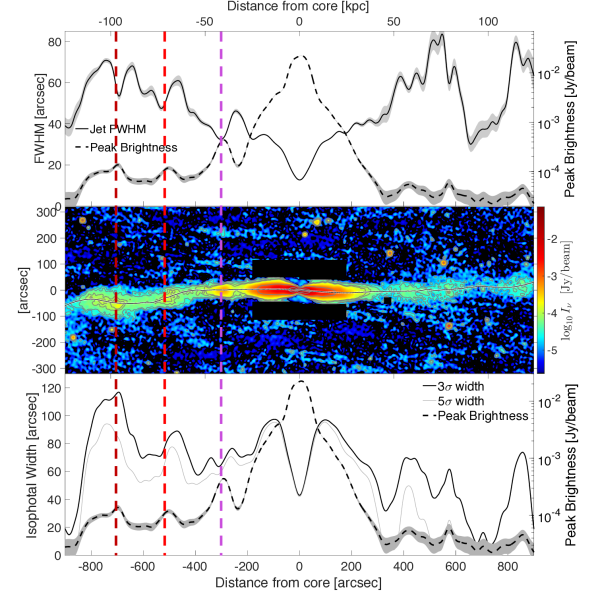
Fig. 11 (top) shows the FWHM width of the jet (black solid line) and the peak brightness (dashed line) of a cross-section, as a function of the distance from the core, for both jets of NGC 2663. These quantities are calculated by least-squares fitting a Gaussian to each vertical column of pixels. This gives the position of the ridge-line of the jet, the peak brightness along the ridge-line, and the FWHM width of the jet. The fitting function also gives the errors in the top plot; in addition, the peak brightness error includes the contribution of background noise.
We see that at arcsec (43 kpc) from the core, the FWHM of the southern jet simultaneously narrows while the jet brightens. However, lower brightness contours show a relatively constant width (Section 4.2). Further brightening is seen at 530 and 690 arcsec (73, 95 kpc), with marginal evidence for a narrowing of the FWHM width of the jet at these positions.
The environment of the jet plays a crucial role in its evolution. The initially relativistic jet may entrain external material and slow down; this entrainment can be mediated by either Kelvin-Helmholtz instabilities (in the case of ambient gas) or stellar winds (Bicknell, 1994; Komissarov & Porth, 2021; Perucho et al., 2006; Wykes et al., 2015). The final morphology of jet-inflated structures depends sensitively on this jet-environment interaction: jets which manage to stay relativistic form powerful FR ii edge-brightened structures, while the slower entrained jets form edge-darkened FR i’s, of either jetted or lobed morphology (Hardcastle, 2018).
To interpret the observed knots as recollimation shocks requires a combination of low () jet velocity and poor environment ().
Alexander (2006) and Krause et al. (2012) used a combination of analytical and numerical modelling to relate jet and environment properties to the final radio source morphology which is shown in Equation 1.
| (1) | ||||
corresponds to the onset of jet recollimation, identified as the location where the jet sideways ram pressure and ambient pressure become equal. The jet becomes collimated before its forward ram pressure drops to the ambient value; such a collimated jet can “drill through” the surrounding gas, inflating an FR-II structure. Conversely, if the jet runs out of forward thrust before recollimation is complete, it will be disrupted and form an FR i structure.
Hence, a typical FR i jet in a low density environment is expected to show signs of recollimation on scales of kiloparsecs. Richer environments, such as galaxy clusters, will yield collimation length scales shorter by a factor , corresponding to kpc in clusters.
Whether the environment density of NGC 2663 is sufficiently low for such large recollimation scales may be probed using Rotation Measure observations in the future.
4.2 Bright knots: internal jet structure?
Could the bright knots in the jet of NGC 2663 result from processes that are internal to the jet itself? In simulations and analytic models, jets can be surrounded by a cocoon or sheath of over-pressurised material, through which a narrower spine continues to travel (Laing & Bridle, 2014).
If the jet has this kind of internal structure, the simultaneous brightening and narrowing of the knots can be explained without any evolution in the actual width of the jet. When the jet is relatively faint, the FWHM is measuring the width of the (wider) sheath of the jet. But if the spine brightens (for some reason) in a certain region, the FWHM measures the width of the (narrower) spine only. In this scenario, the bright knots in the jet of NGC 2663 reveal the existence of a narrow spine, rather than resulting from the constriction of the jet by its environment.
Observational evidence relevant to this scenario comes from considering the isophotal width of the jet, looking for multiple components in cross-sectional slices, and the linear polarisation structure.
Fig. 11 shows the isophotal width. The middle panel shows the ASKAP brightness image of NGC 2663, where the two lowest contours in the bottom plot are 3 and 5 above the background noise. The 3 and 5 brightness contours show a remarkably constant width between and arcsec (kpc), seemingly oblivious to the rapid, four-fold brightening and fading of the spine of the jet. This can be seen in the bottom panel, which shows the isophotal width of the 3 (solid black line) and 5 (solid grey line) ASKAP brightness contours. This striking constancy of the isophotal width is consistent with a component of the jet that is decoupled from the cause of the brightening of the knot. However, the evolution of the brightness of the jet — with changing density, internal and external pressure, magnetic field, temperature, etc. — makes a contour of fixed brightness difficult to interpret.
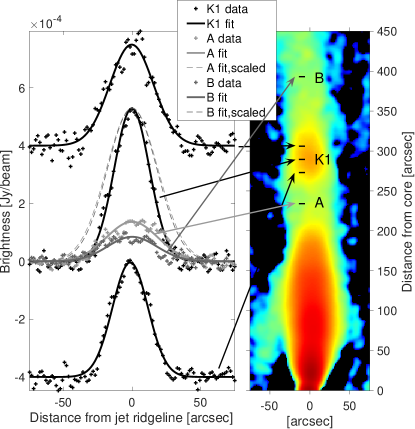
Figure 12 shows slices in brightness across various sections of the jet, each 16 arcsec thick. Comparing K1 (black) with rescaled versions of the jet upstream (dark grey) and downstream (light grey) show that the bright knot is not just a brighter version of the background jet — it is narrower. The black lines do not show an obvious spine-sheath structure, as a single Gaussian is a reasonable fit. Attempts at a two Gaussian fit did not find a second, wider underlying Gaussian. At most, the bottom black data shows a narrower peak and broader sides than the single Gaussian, which may indicate a more complicated structure.
Figure 4 (left) shows the fractional polarisation image of NGC 2663 which shows that the linear polarisation decreases towards the edge of the jet. Previous studies of polarisation inside the jets have shown that fractional polarisation tends to increase near the jet edge (e.g. Roberts et al., 2013, Lloyd & Jones, 2002), i.e. the opposite of what we see here. This most likely indicates an unusual magnetic field in the jet, possibly with an inner coherent field giving way to a mixed, more complex field in the outer sheath. This may indicate the confinement of the jet by large-scale magnetic fields, rather than purely thermal pressure of the environment.
In summary, our observations of the jet are consistent with a core-sheath structure, but this interpretation is far from demanded by the data. A more complete model of this scenario will need to explain why the spine brightens.
4.3 Bright knots: varying jet power?
If the power of the jet source varies significantly, then past periods of high output will appear later as brighter spots in the jet. If the jets are approximately symmetric at their source, then a bright spot should appear in both jets. However, projection and light travel effects mean that the spots will appear at different distances from the core.
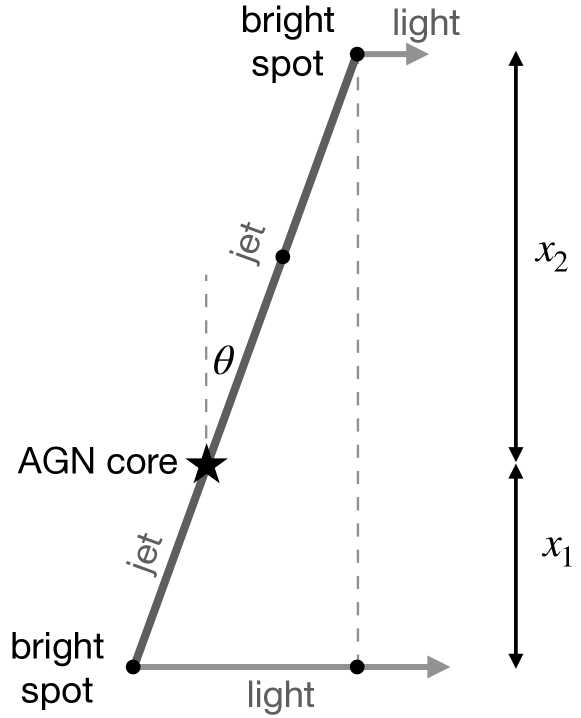
Fig. 13 shows the geometry of the projection effect.
Jet material is ejected from the AGN core at the same time and same speed () in opposite directions. The lower jet material travels to apparent position and emits light toward the observer. The upper jet material travels somewhat further to , before also emitting light toward the observer. These light beams arrive at the observer at the same time. The relationship between the angle , the jet velocity , and the ratio is,
| (2) |
We can see in Fig. 5 that the southern jet (with the recollimation spot) has a larger RM, indicating that its light has passed through a larger column of magnetoionic medium (Garrington et al., 1988). These electrons are plausibly in the immediate environment of the jet; thus, the southern jet is oriented away from us. It follows that, if there is a corresponding bright spot on the northern jet, it will appear to be further away from the core than bright spots in the southern jet. Unfortunately, given the faintness of the northern jet, evidence for bright spots is marginal at best.
This scenario might explain why the northern jet, which seems to be pointing towards us, is fainter than the southern jet. The northern jet is older; or, more precisely, we are observing the northern jet at a later time than the southern jet. If the jet is fading with time, then this will more significantly affect our observations of the northern jet. However, without a specific model of the structure and evolution of the jet, it is difficult to be precise about the magnitude of this effect, relative to relativistic beaming, absorption by the intervening medium, and the asymmetry of the environment.
Further, it is not clear whether periods of higher output from the jet would correspond to a narrower bright spot than the rest of the jet. Unless the extra power also narrows the opening angle of the jet, we might expect more energetic regions of the outflow to be less affected by their environment as they travel, and so be broader than the less energetic regions. This is marginal evidence for a recollimation scenario over varying jet power. Exploring this scenario would be aided by simulations, and could be analysed statistically based on a large sample of jets.
5 Detectability with Distance
As noted in the introduction, AGN feedback plays a crucial role in galaxy formation, impacting the flow of potentially star-forming gas around large galaxies. The EMU survey has and will continue to observe sources such as NGC 2663, which offer an opportunity to directly observe the effect of AGN jets on their environment, and vice versa.
To anticipate the results of the wider EMU survey, we calculate what NGC 2663 would look like if it were situated at a range of redshifts. Given that NGC 2663 is located at , we produce its image at redshift as follows.
-
•
Parts of the original image that are below the one-sigma noise level are removed to produce an image that approximates the “signal”.
-
•
Pixelate the image to increase the physical resolution scale by , where is the angular diameter distance.
-
•
Rescale the brightness of each pixel proportional to , where the spectral index is taken to be constant .
-
•
Add Gaussian noise with the same amplitude as the original image, with a spatial scale given by the new pixel size.
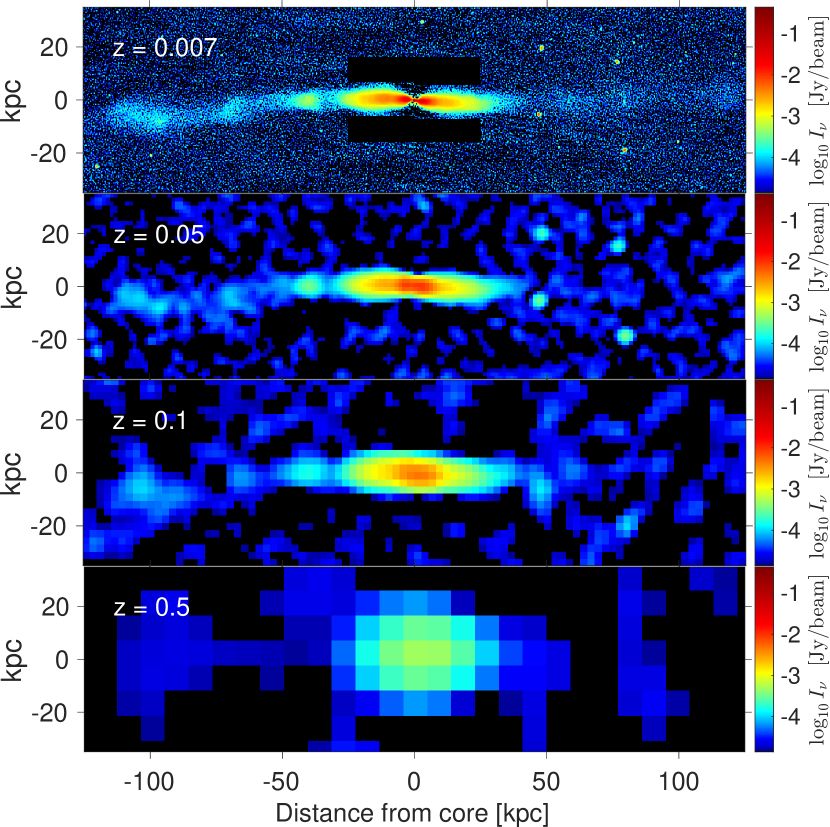
Fig. 14 shows simulated images of NGC 2663, observed as if the source was placed at the redshift shown in each panel. In the top panel (the original image), side lobes above and below the jet are masked. The broad features of the jet are still visible at , but by the evidence for a brightening of the southern jet is marginal at best. At , the source is detectable but a jet cannot be identified.
The recently completed EMU pilot survey, which presents only 1.3 per cent of the total area that will be covered by the full EMU survey (Norris et al., 2021), has revealed a number of excellent candidates for recollimating AGN jets. The EMU project is a new-generation radio survey observing the entire southern sky of Dec0 degrees, using ASKAP. It covers approximately one-hundredth of area of the planned total EMU survey. In addition, the volume of the universe out to is about times larger than the volume out to NGC 2663. We expect future observations from EMU as well as the ongoing VLA Sky Survey (VLASS; Lacy et al., 2020) and LOFAR Two-Metre Sky Survey (LoTSS Shimwell et al., 2022) will provide many more examples of resolved AGN jets (e.g. Mingo et al., 2019), with which we can test our understanding of their physics and effect on their environment.
6 Conclusions
In this paper we report the discovery of one of the largest AGN jets in the nearby Universe, associated with the elliptical galaxy NGC 2663. In summary, we found that:
- •
-
•
X-ray observations with eROSITA, Chandra and Swift show that NGC 2663 is located in a rarefied environment, with no diffuse emission.
-
•
The jet is remarkably linear over its entire length, which is also consistent with a low density environment on Mpc scales.
-
•
The southern jet shows at least one possible example of narrowing and simultaneous brightening of the jet. This is possibly indicative of recollimation of the jet by external, environmental pressure. The large recollimation scale (40 kpc) would be consistent with a slow jet in a low pressure environment.
-
•
Our observations of the jet could also be explained by a jet with variable power; the brightness of the jet is a record of the past activity of the source. However, it is not clear that this would also produce a narrower region of the jet.
-
•
The fractional polarisation of radio emission shows a behaviour uncommon for AGN jets: instead of increasing at the edges, it decreases. This may suggest a complicated internal jet structure, rather than external recollimation.
Acknowledgements
The ATCA and the Australian SKA Pathfinder (ASKAP) are part of the Australian Telescope which is funded by the Commonwealth of Australia for operation as National Facility managed by CSIRO. This paper includes archived data obtained through the Australia Telescope Online Archive (http://atoa.atnf.csiro.au). Operation of ASKAP is funded by the Australian Government with support from the National Collaborative Research Infrastructure Strategy (NCRIS). ASKAP uses the resources of the Pawsey Supercomputing Centre. Establishment of ASKAP, the Murchison Radio-astronomy Observatory and the Pawsey Supercomputing Centre are initiatives of the Australian Government, with support from the Government of Western Australia and the Science and Industry Endowment Fund. This scientific work makes use of the Murchison Radio-astronomy Observatory, operated by CSIRO. We acknowledge the Wajarri Yamatji people as the traditional owners of the Observatory site. Support for the operation of the MWA is provided by the Australian Government (NCRIS), under a contract to Curtin University administered by Astronomy Australia Limited. The National Radio Astronomy Observatory is a facility of the National Science Foundation operated under cooperative agreement by Associated Universities, Inc. This work made use of the Swinburne University of Technology software correlator, developed as part of the Australian Major National Research Facilities Programme and operated under licence. The recent VLBA experiments were run by the geodetic group of the US Naval Observatory (USNO) to monitor the radio reference frame sources with 10 VLBA antennas Hunt et al. (2021).
This work is based on data from eROSITA, the soft X-ray instrument aboard SRG, a joint Russian-German science mission supported by the Russian Space Agency (Roskosmos), in the interests of the Russian Academy of Sciences represented by its Space Research Institute (IKI), and the Deutsches Zentrum für Luft- und Raumfahrt (DLR). The SRG spacecraft was built by Lavochkin Association (NPOL) and its subcontractors, and is operated by NPOL with support from the Max Planck Institute for Extraterrestrial Physics (MPE). The development and construction of the eROSITA X-ray instrument was led by MPE, with contributions from the Dr. Karl Remeis Observatory Bamberg & ECAP (FAU Erlangen-Nürnberg), the University of Hamburg Observatory, the Leibniz Institute for Astrophysics Potsdam (AIP), and the Institute for Astronomy and Astrophysics of the University of Tübingen, with the support of DLR and the Max Planck Society. The Argelander Institute for Astronomy of the University of Bonn and the Ludwig Maximilians Universität Munich also participated in the science preparation for eROSITA. The eROSITA data shown here were processed using the eSASS software system developed by the German eROSITA consortium.
H.A. has benefited from grant CIIC 174/2021 of Universidad de Guanajuato, Mexico. Partial support for L.R. comes from U.S. National Science Foundation grant AST17-14205 to the University of Minnesota.
We thank Natasha Hurley-Walker for providing the 200-MHz data from the Murchison Widefield Array and Robert Laing for useful discussions and insights which greatly contributed to this paper.
We are also grateful to the anonymous referee for a constructive report and useful comments that helped us improve the paper significantly.
Data Availability
The data underlying this article will be shared on reasonable request to the corresponding author.
References
- Alexander (2006) Alexander P., 2006, MNRAS, 368, 1404
- Anderson et al. (2021) Anderson C. S., Heald G. H., Eilek J. A., Lenc E., Gaensler B. M., et al., 2021, arXiv e-prints, p. arXiv:2102.01702
- Arnaud (1996) Arnaud K. A., 1996, in Jacoby G. H., Barnes J., eds, Astronomical Society of the Pacific Conference Series Vol. 101, Astronomical Data Analysis Software and Systems V. p. 17
- Asada et al. (2014) Asada K., Nakamura M., Doi A., Nagai H., Inoue M., 2014, ApJ, 781, L2
- Barnes et al. (2001) Barnes D. G., et al., 2001, MNRAS, 322, 486
- Bertin et al. (2002) Bertin E., Mellier Y., Radovich M., Missonnier G., Didelon P., Morin B., 2002, in Bohlender D. A., Durand D., Handley T. H., eds, Astronomical Society of the Pacific Conference Series Vol. 281, Astronomical Data Analysis Software and Systems XI. p. 228
- Bicknell (1994) Bicknell G. V., 1994, ApJ, 422, 542
- Boccardi et al. (2021) Boccardi B., et al., 2021, A&A, 647, A67
- Breeveld et al. (2010) Breeveld A. A., et al., 2010, MNRAS, 406, 1687
- Brentjens & de Bruyn (2005) Brentjens M. A., de Bruyn A. G., 2005, A&A, 441, 1217
- Briggs (1995) Briggs D. S., 1995, in American Astronomical Society Meeting Abstracts. p. 112.02
- Brunner et al. (2021) Brunner H., et al., 2021, arXiv e-prints, p. arXiv:2106.14517
- Burrows et al. (2005) Burrows D. N., et al., 2005, Space Sci. Rev., 120, 165
- Cantwell et al. (2020) Cantwell T. M., et al., 2020, MNRAS, 495, 143
- Cardelli et al. (1989) Cardelli J. A., Clayton G. C., Mathis J. S., 1989, ApJ, 345, 245
- Cash (1979) Cash W., 1979, ApJ, 228, 939
- Charlot et al. (2020) Charlot P., et al., 2020, A&A, 644, A159
- Cluver et al. (2017) Cluver M. E., Jarrett T. H., Dale D. A., Smith J. D. T., August T., Brown M. J. I., 2017, ApJ, 850, 68
- Condon et al. (2021) Condon J. J., Cotton W. D., White S. V., Legodi S., Goedhart S., McAlpine K., Ratcliffe S. M., Camilo F., 2021, ApJ, 917, 18
- Croton et al. (2006) Croton D. J., et al., 2006, MNRAS, 365, 11
- Daly & Marscher (1988) Daly R. A., Marscher A. P., 1988, ApJ, 334, 539
- Danziger & Goss (1983) Danziger I. J., Goss W. M., 1983, MNRAS, 202, 703
- Franceschini et al. (2003) Franceschini A., et al., 2003, MNRAS, 343, 1181
- Fruscione et al. (2006) Fruscione A., et al., 2006, in Society of Photo-Optical Instrumentation Engineers (SPIE) Conference Series. p. 62701V, doi:10.1117/12.671760
- Garrington et al. (1988) Garrington S. T., Leahy J. P., Conway R. G., Laing R. A., 1988, Nature, 331, 147
- Gehrels et al. (2004) Gehrels N., et al., 2004, ApJ, 611, 1005
- Gómez et al. (1997) Gómez J. L., Martí J. M., Marscher A. P., Ibáñez J. M., Alberdi A., 1997, ApJ, 482, L33
- Gooch (1995) Gooch R., 1995, in Shaw R. A., Payne H. E., Hayes J. J. E., eds, Astronomical Society of the Pacific Conference Series Vol. 77, Astronomical Data Analysis Software and Systems IV. p. 144
- Gregory & Loredo (1992) Gregory P. C., Loredo T. J., 1992, ApJ, 398, 146
- Guzman et al. (2019) Guzman J., et al., 2019, ASKAPsoft: ASKAP science data processor software (ascl:1912.003)
- Hada et al. (2018) Hada K., et al., 2018, ApJ, 860, 141
- Hardcastle (2018) Hardcastle M., 2018, Nature Astronomy, 2, 273
- Hill et al. (2004) Hill J. E., et al., 2004, in Flanagan K. A., Siegmund O. H. W., eds, Society of Photo-Optical Instrumentation Engineers (SPIE) Conference Series Vol. 5165, X-Ray and Gamma-Ray Instrumentation for Astronomy XIII. pp 217–231, doi:10.1117/12.505728
- Hine & Longair (1979) Hine R. G., Longair M. S., 1979, MNRAS, 188, 111
- Hotan et al. (2021) Hotan A. W., et al., 2021, Publ. Astron. Soc. Australia, 38, e009
- Hunt et al. (2021) Hunt L. R., Johnson M. C., Cigan P. J., Gordon D., Spitzak J., 2021, AJ, 162, 121
- Hurley-Walker et al. (2017) Hurley-Walker N., et al., 2017, MNRAS, 464, 1146
- Hutschenreuter et al. (2022) Hutschenreuter S., et al., 2022, A&A, 657, A43
- Jarrett et al. (2013) Jarrett T. H., et al., 2013, AJ, 145, 6
- Jarrett et al. (2019) Jarrett T. H., Cluver M. E., Brown M. J. I., Dale D. A., Tsai C. W., Masci F., 2019, ApJS, 245, 25
- Johnston et al. (2008) Johnston S., et al., 2008, Experimental Astronomy, 22, 151
- Kaastra (1992) Kaastra J., 1992, Internal SRON-Leiden Report
- Kalberla et al. (2005) Kalberla P. M. W., Burton W. B., Hartmann D., Arnal E. M., Bajaja E., Morras R., Pöppel W. G. L., 2005, A&A, 440, 775
- Katz-Stone & Rudnick (1997) Katz-Stone D. M., Rudnick L., 1997, ApJ, 488, 146
- Komissarov & Falle (1997) Komissarov S. S., Falle S. A. E. G., 1997, MNRAS, 288, 833
- Komissarov & Porth (2021) Komissarov S., Porth O., 2021, New Astron. Rev., 92, 101610
- Kormendy & Richstone (1995) Kormendy J., Richstone D., 1995, ARA&A, 33, 581
- Krause et al. (2012) Krause M., Alexander P., Riley J., Hopton D., 2012, MNRAS, 427, 3196
- Kronberg (1994) Kronberg P. P., 1994, Reports on Progress in Physics, 57, 325
- Lacy et al. (2020) Lacy M., et al., 2020, PASP, 132, 035001
- Laing & Bridle (2014) Laing R. A., Bridle A. H., 2014, MNRAS, 437, 3405
- Laing et al. (2008a) Laing R. A., Bridle A. H., Cotton W. D., Worrall D. M., Birkinshaw M., 2008a, in Rector T. A., De Young D. S., eds, Astronomical Society of the Pacific Conference Series Vol. 386, Extragalactic Jets: Theory and Observation from Radio to Gamma Ray. p. 110 (arXiv:0801.0154)
- Laing et al. (2008b) Laing R. A., Bridle A. H., Parma P., Feretti L., Giovannini G., Murgia M., Perley R. A., 2008b, MNRAS, 386, 657
- Liedahl et al. (1995) Liedahl D. A., Osterheld A. L., Goldstein W. H., 1995, ApJ, 438, L115
- Lloyd & Jones (2002) Lloyd B. D., Jones P. A., 2002, MNRAS, 331, 717
- Magorrian et al. (1998) Magorrian J., et al., 1998, AJ, 115, 2285
- Makarov et al. (2017) Makarov V. V., Frouard J., Berghea C. T., Rest A., Chambers K. C., Kaiser N., Kudritzki R.-P., Magnier E. A., 2017, ApJ, 835, L30
- McConnell et al. (2016) McConnell D., et al., 2016, Publ. Astron. Soc. Australia, 33, e042
- Merloni et al. (2012) Merloni A., et al., 2012, arXiv e-prints, p. arXiv:1209.3114
- Mewe et al. (1985) Mewe R., Gronenschild E. H. B. M., van den Oord G. H. J., 1985, A&AS, 62, 197
- Mewe et al. (1986) Mewe R., Lemen J. R., van den Oord G. H. J., 1986, A&AS, 65, 511
- Mingo et al. (2019) Mingo B., et al., 2019, MNRAS, 488, 2701
- Mizuno et al. (2015) Mizuno Y., Gómez J. L., Nishikawa K.-I., Meli A., Hardee P. E., Rezzolla L., 2015, ApJ, 809, 38
- Napier et al. (1994) Napier P. J., Bagri D. S., Clark B. G., Rogers A. E. E., Romney J. D., Thompson A. R., Walker R. C., 1994, Proceedings of the IEEE, 82, 658
- Nelson et al. (2019) Nelson D., et al., 2019, MNRAS, 490, 3234
- Norris et al. (2021) Norris R. P., et al., 2021, Publ. Astron. Soc. Australia, 38, e046
- Offringa et al. (2014) Offringa A. R., et al., 2014, MNRAS, 444, 606
- Perucho et al. (2006) Perucho M., Lobanov A. P., Martí J. M., Hardee P. E., 2006, A&A, 456, 493
- Petit & Luzum (2010) Petit G., Luzum B., eds, 2010, IERS Conventions 2010. IERS Technical Note No. 36
- Poole et al. (2008) Poole T. S., et al., 2008, MNRAS, 383, 627
- Predehl et al. (2021) Predehl P., et al., 2021, A&A, 647, A1
- Ricci et al. (2014a) Ricci T. V., Steiner J. E., Menezes R. B., 2014a, MNRAS, 440, 2419
- Ricci et al. (2014b) Ricci T. V., Steiner J. E., Menezes R. B., 2014b, MNRAS, 440, 2442
- Roberts et al. (2013) Roberts D. H., Wardle J. F. C., Marchenko V. V., 2013, AJ, 145, 49
- Roming et al. (2005) Roming P. W. A., et al., 2005, Space Sci. Rev., 120, 95
- Roming et al. (2009) Roming P. W. A., et al., 2009, ApJ, 690, 163
- Sadler et al. (1989) Sadler E. M., Jenkins C. R., Kotanyi C. G., 1989, MNRAS, 240, 591
- Sault & Wieringa (1994) Sault R. J., Wieringa M. H., 1994, A&AS, 108, 585
- Sault et al. (1995) Sault R. J., Teuben P. J., Wright M. C. H., 1995, in Shaw R. A., Payne H. E., Hayes J. J. E., eds, Astronomical Society of the Pacific Conference Series Vol. 77, Astronomical Data Analysis Software and Systems IV. p. 433 (arXiv:astro-ph/0612759)
- Schinckel et al. (2012) Schinckel A. E., Bunton J. D., Cornwell T. J., Feain I., Hay S. G., 2012, in Proc. SPIE. p. 84442A, doi:10.1117/12.926959
- Schuh & Behrend (2012) Schuh H., Behrend D., 2012, J Geodyn, 61, 68
- Shimwell et al. (2022) Shimwell T. W., et al., 2022, A&A, 659, A1
- Spingola et al. (2020) Spingola C., Dallacasa D., Belladitta S., Caccianiga A., Giroletti M., Moretti A., Orienti M., 2020, A&A, 643, L12
- Thomas et al. (2014) Thomas J., Saglia R. P., Bender R., Erwin P., Fabricius M., 2014, ApJ, 782, 39
- Tingay et al. (2013) Tingay S. J., et al., 2013, Publ. Astron. Soc. Australia, 30, e007
- Titov et al. (2004) Titov O., Tesmer V., Boehm J., 2004, in Vandenberg N. R., Baver K. D., eds, International VLBI Service for Geodesy and Astrometry 2004 General Meeting Proceedings. p. 267
- Veilleux & Osterbrock (1987) Veilleux S., Osterbrock D. E., 1987, ApJS, 63, 295
- Wayth et al. (2018) Wayth R. B., et al., 2018, Publ. Astron. Soc. Australia, 35, 33
- Willick et al. (1997) Willick J. A., Courteau S., Faber S. M., Burstein D., Dekel A., Strauss M. A., 1997, ApJS, 109, 333
- Wilms et al. (2000) Wilms J., Allen A., McCray R., 2000, ApJ, 542, 914
- Wykes et al. (2015) Wykes S., Hardcastle M. J., Karakas A. I., Vink J. S., 2015, MNRAS, 447, 1001