Automated Change Rule Inference for Distance-Based API Misuse Detection
Abstract.
Developers build on Application Programming Interfaces (APIs) to reuse existing functionalities of code libraries. Despite the benefits of reusing established libraries (e.g., time savings, high quality), developers may diverge from the API’s intended usage; potentially causing bugs or, more specifically, API misuses. Recent research focuses on developing techniques to automatically detect API misuses, but many suffer from a high false-positive rate. In this article, we improve on this situation by proposing ChaRLI (Change RuLe Inference), a technique for automatically inferring change rules from developers’ fixes of API misuses based on API Usage Graphs (AUGs). By subsequently applying graph-distance algorithms, we use change rules to discriminate API misuses from correct usages. This allows developers to reuse others’ fixes of an API misuse at other code locations in the same or another project. We evaluated the ability of change rules to detect API misuses based on three datasets and found that the best mean relative precision (i.e., for testable usages) ranges from 77.1 % to 96.1 % while the mean recall ranges from 0.007 % to 17.7 % for individual change rules. These results underpin that ChaRLI and our misuse detection are helpful complements to existing API misuse detectors.
1. Introduction
An Application Programming Interface (API) allows client developers to call the functionalities of another programming library within their own application, enabling software reuse of established code. However, developers may not be fully aware of the correct usage of an API, for instance, which mandatory function calls are required in what order to use an API interface correctly. As a consequence, developers may misuse the API, potentially causing bugs, faulty behavior, or unexpected outcomes in their own application. We refer to such cases as API misuses. Unfortunately, API misuses are prevalent in software development. For instance, Zhong and Su (2015) have shown that half of the bug fixes in five open-source Apache projects required at least one API-specific change. Moreover, API misuses may cause severe bugs, for instance, security issues caused by falsely applied cryptography APIs (Nadi et al., 2016; Oliveira et al., 2018).
To mitigate such problems, a large research community is working on techniques for detecting API misuses (Amann, 2018; Amann et al., 2019a; Kang and Lo, 2021; Nielebock et al., 2021c). The common idea is to infer specifications that describe the correct usage of an API from source code or other documents (e.g., API documentation) and to subsequently detect violations of these specifications. Specifications are represented as state automata (Ammons et al., 2002), dynamic invariants (Ernst et al., 2001), temporal specifications (Wasylkowski et al., 2007), API usage patterns based on frequent pattern mining (Weimer and Necula, 2005; Zhong et al., 2009), or machine-learned probability distributions (Allamanis and Sutton, 2014; Murali et al., 2017). However, a major issue of existing specification-based misuse detection techniques is the large number of irrelevant or alternative specifications causing false alarms (i.e., false positives) (Le Goues and Weimer, 2012; Amann et al., 2019b). Such false alarms hamper the practical adoption of API misuse detectors—similarly to static code analyzers (Imtiaz et al., 2019a, b).
To tackle the problem of reporting many false alarms, we have introduced the idea of reusing existing knowledge from fixed API misuses to detect similar misuses in other projects with a lower false-positive rate (Nielebock et al., 2020). Essentially, we build on the idea that a fixed misuse comprises detailed information about the misuse, its fix, and the corrective changes—such as the context of the API misuse and how a real developer fixed that API misuse in that specific context. We have developed a technique that uses the change information of commits to semi-automatically infer correction rules for misuses, which can ideally be reused to detect and eventually fix similar misuses at other code locations. Subsequently, we empirically analyzed to what extent we can employ distance-based metrics to compare correction rules to API misuses and correct API usages (Nielebock et al., 2021a). Unfortunately, we identified two major challenges hampering our idea of detecting API misuses. First, generating reliable correction rules required extensive manual effort, for instance, to identify and denote the misused API. Second, the distance-based comparisons achieved low precision values compared to advanced specification-based techniques, such as MUDetect (Amann et al., 2019a) or ALP (Kang and Lo, 2021).
In this article, we report on our advancements with which we tackled these two challenges. To this end, we propose ChaRLI (Change RuLe Inference), a novel technique for inferring change rules—a generalization of the correction rules we used before. Additionally, we evaluated to what extent the inferred change rules can help to reliably discriminate API misuses from correct API usages. More detailed, we contribute the following in this article:
-
•
We propose ChaRLI, a technique that, except for the manually provided commit hash and method declaration containing the fixed API misuse, can automatically infer change rules.
-
•
We improve distance-based metrics to detect API misuses based on inferred change rules.
- •
-
•
We publish all artifacts related to this article in an open-access repository.111https://doi.org/10.5281/zenodo.6598541
Our contributions can help practitioners to detect API misuses cooperatively by one developer proposing a change rule that others can apply for the same API in their projects (e.g., after a breaking change in an API). Moreover, ChaRLI provides a foundation for developing and integrating tools to facilitate the inference of change rules. For researchers, our contributions define indicators on how to improve misuse detection, providing a reusable and extensible foundation for this purpose.
2. Background
In this section, we briefly introduce the basic concepts of AUGs, correction rules, and distance-based API misuse detection.
2.1. API Usage Graphs
An AUG is a directed labeled multi-graph describing the data and control flow of an intra-procedural API usage. The concepts of AUGs have been developed by Amann et al. (2019b) to represent API specifications for more effective API-misuse detection. In our previous works, we used AUGs to mine specifications (Nielebock et al., 2021c) and to produce correction rules (Nielebock et al., 2020, 2021a). Note that AUGs target only the Java programming language.

For simplicity, we introduce AUGs based on the example we used in our previous work (Nielebock et al., 2021a), and which we display in Figure 1. In 1(a), we show a code excerpt that a developer has changed (i.e., by adding the hasCharacteristic()-check from Lines 12–15). The AUG of the changed code in 1(b) builds on the code’s Abstract Syntax Tree (AST) enhanced by heuristically obtained control and data flow edges. Moreover, type resolution is achieved by attaching additional source code (e.g., by providing the jar of a certain library) to the construction process.
An AUG consists of two main types of nodes: data nodes (displayed as ellipses in 1(b)) and action nodes (displayed as rectangles in 1(b)). Data nodes represent object instances, which are labeled either with their respective data types or, in the case of constants, their respective value (e.g., the text in case of a String constant). If a datatype cannot be resolved, the data node is labeled with UNKNOWN (cf. 1(b)). Action nodes represent method calls (e.g., Baz.doSomething()) or special control-flow statements (e.g., <return>). These generic node types can be refined in the actual implementation of an AUG.
An AUG involves two primary types of edges: control-flow and data-flow edges. Control-flow edges are depicted as dashed arrows and labeled with their respective sub-type. For instance, sel denotes a selective edge representing the changed control flow caused by if-statements. Another example are order-edges, which denote the heuristically (i.e., transitive closure) obtained order of statements. Data-flow edges describe the data flow between nodes and are represented as solid arrows. Examples of such edges are recv-edges, which represent that a certain action (i.e., target node) is called from the incoming data node, or para-edges, which represent that the incoming data node is used as a parameter.
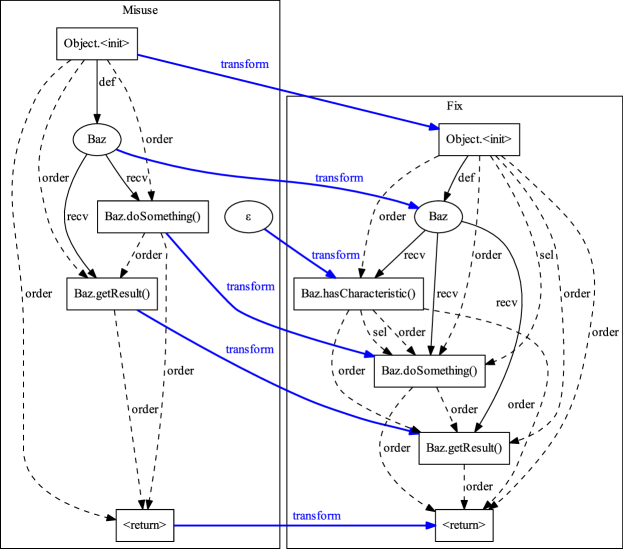
2.2. Correction Rules
In our previous work (Nielebock et al., 2020, 2021c), we proposed so-called correction rules to detect API misuses. A correction rule represents the changes between two subsequent versions of an AUG that are intended to correct an API misuse. Particularly, each rule should represent the minimal changes between the nodes of the misuse AUG and the corrected AUG, depicted as transform-edges. In this context, added or deleted nodes are represented as special -nodes in the misuse or fix part of a correction rule (i.e., representing “holes” in the respective other AUG). We show the correction rule for the changes in 1(a) in Figure 2. Note that this rule simplifies the respective misuse and fix AUGs by removing nodes that do not change, meaning nodes for which neither the label nor the in- or outgoing edges change. Therefore, the correction rule depicted in Figure 2 contains neither the data nodes of the objects Foo and Bar nor their respective edges, which are present in the original AUG (cf. 1(b)).
The minimal number of changes between two AUGs can be computed using the minimal Graph Edit Distance (GED), which identifies the minimal edit costs in terms of change operations to transform one graph into another (i.e., by adding, deleting, or relabeling nodes and edges). However, GED computation is known to be NP-hard (Blumenthal and Gamper, 2018). As a result, we (Nielebock et al., 2020) previously applied an approximation technique to obtain an almost minimal GED. Particularly, we transform the two AUGs into a bipartite mapping of the nodes and apply the Kuhn-Munkres algorithm (Munkres, 1957) to obtain a sufficiently minimal mapping. This reduces the problem’s complexity. Since we do not change this part of our algorithm, we describe its details in Section 3.2. Moreover, to reduce the number of nodes involved in a correction rule, we filter those nodes that refer to a certain type (i.e., class). Particularly, while our original idea focused on a manual selection of relevant classes for an API misuse, we generalized this in our subsequent work (Nielebock et al., 2021a). We automatically removed nodes not related to any imported class or a certain subset of the imported classes (e.g., android.*) of the analyzed source file.
2.3. Distance-Based API Misuse Detection
Using correction rules, we proposed to detect API misuses based on graph-distance algorithms (Nielebock et al., 2021a). Particularly, our idea is to compute distance values between an API usage (by inferring its AUG) and i) the respective misuse part as well as ii) the fixed part of the correction rule. In case the usage is more similar (i.e., has a smaller distance) to the misuse part than to the fixed part, we determine the API usage as an API misuse.
More formally, we describe a correction rule as where (rule misuse) and (rule correction) are the respective misuse and fix AUGs. Moreover, we define to be a relative distance function , where denotes equality and maximum inequality between two AUGs. Having an API usage represented as AUG , we say is a misuse according to the above mentioned correction rule and distance function if
| (1) |
Additionally, because some rules may only match this condition by chance, we checked whether correction rules are applicable for misuse detection. This means that, according to a set of known correct API usages, the correct part of the rule has a smaller mean distance to such API usages than to a set of known API misuses. Similarly, the misuse part of a correction rule should have a smaller distance to the known API misuses than to the known correct API usages. The detailed computation of this applicability check can be found in our previous work (Nielebock et al., 2021a). We found that this check together with different graph-distance algorithms (e.g., L1-norm and cosine similarity based on the Exas vectors proposed by Nguyen et al. (2009a)) are insufficient for detecting API misuses. Reflecting on these outcomes, we hypothesized how to improve the distance function and enable API misuse detection via AUGs, which we discuss in Section 3.
3. API Misuse Detection Using Change Rules
In this section, we start with an overview of our concept for detecting API misuses via change rules (cf. Section 3.1). Then, we introduce the individual parts of our concept. First, we present ChaRLI by describing a validation of the issues we identified for our correction rules and describing our consequent improvements (cf. Section 3.2). Second, we present how we check the applicability of a change rule to a potential API misuse (cf. Section 3.3). Finally, we present the graph-distance-based API misuse detection—especially our improvements of Exas vectors (cf. Section 3.4).
3.1. Conceptual Overview
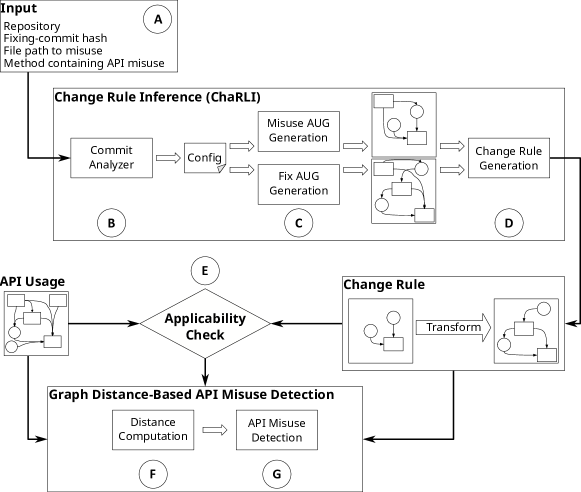
We depict the conceptual overview of our techniques in Figure 3, involving ChaRLI as well as the graph-distance-based API misuse detection. This process starts within the project in which one developer identified and fixed an API misuse. As input for ChaRLI, we need the repository URI of the project, the commit hash of the fixing change, and the path to the source file as well as to the method declaration of the fixed method ( ). Then, ChaRLI analyzes the commit ( ) to produce a configuration for the AUG generation. Using this configuration, ChaRLI produces two AUGs, one representing the misused and the other representing the fixed code version ( ). Lastly, ChaRLI automatically detects the differences between the two AUGs to generate the change rule ( ).
Afterward, we use the change rule to detect the API misuse represented by this rule in other API usages, which may reside in the same or another project. For the misuse detection, we first perform an applicability check of the rule against the API usage ( ). If the rule is applicable to the API usage, we use the change rule to perform the graph distance-based API misuse detection. This final part of our process involves computing the distance between the API usage and the misuse as well as the fixed part of the change rule ( ); and the subsequent misuse detection ( ). Next, we describe the individual steps of this process in more detail.
3.2. Change Rule Inference
We begin this section with a validation of our previous correction rules (cf. Section 2.2). This way, we identified improvements for generating our novel change rules, for which we describe the generation steps afterward.
Validation of Correction Rules. The goal of our manual validation of correction rules (Nielebock et al., 2021a) is to identify hypotheses to improve the precision for API misuses detection. For this purpose, the first three authors independently analyzed 50 randomly selected API misuses from the MUBench dataset (Amann et al., 2016) and the respective correction rules. They compared each rule to the changes made in the fix commit to check whether the rule correctly represents the steps needed to perform the fix. Particularly, we assessed the rules based on the following three criteria:
-
(1)
Completeness: All necessary API methods (i.e., AUG action nodes) of the API misuse fix are present.
-
(2)
Arrangement: All necessary API methods (i.e., AUG action nodes) are correctly arranged concerning the control flow.
-
(3)
Data: All required parameters and return values (i.e., AUG data nodes) of the necessary API methods are part of the change rule.
We agreed on these minimal criteria to denote a rule as valid and assessed each criterion individually as yes, no, or do not know. Moreover, we justified each decision and codified additional flaws we noticed. So, we could also identify issues in the rules going beyond those three criteria. In the end, we discussed the individual assessments to derive agreement on each of the fifty correction rules among the three authors.
After this validation, we summarized the results by denoting a criterion of a rule as yes if all three assessors voted yes. We denoted all other cases as no. Overall, Cohens (Cohen, 1960) indicates an agreement for completeness of , for arrangement of , and for data of . According to the criteria defined by Landis and Koch (1977), these scores refer to a substantial (for completeness), a moderate (for arrangement), and a fair agreement (for data). Please note that these agreement strengths are debatable even though they are commonly used to measure agreement, particularly because Landis and Koch denote their criteria as “arbitrary.”
| Decision | #Completeness | #Arrangement | #Data |
|---|---|---|---|
| yes | 18 | 14 | 0 |
| no | 32 | 36 | 50 |
In Table 1, we depict the results of our manual validation. We can see that we denoted only a minority of 18 rules as complete and only 14 as correctly arranged. None of the rules have been assessed as correctly containing parameters or return values by all assessors. Through our codification, we denoted potential reasons for these results from which we derived the following three challenges:
- Challenge 1::
-
Missing data nodes were mainly a consequence of how we denoted changed nodes. A node changes if it is relabeled or if its incoming and outgoing edges change. However, this usually does not impact parameters and result object nodes. For instance, for the AUG in 1(b), the data nodes Foo, Bar, and UNKNOWN are only connected to their neighboring action nodes via data flow edges (i.e., def and para), while the action nodes have some additional control-flow edges, such as order-edges. Since adding a method call only impacts the control-flow edges, the mentioned data nodes do not change according to our criteria, and thus do not occur in the correction rule (cf. Figure 2).
- Challenge 2::
-
We found a similar issue for some missing action nodes connected via a finally control-flow edges. Such an edge describes the control flow to the finally-block in Java, which executes statements (e.g., tidy up statements) even in the case of an exception.
- Challenge 3::
-
During our manual inspection, we noticed that the conservative addition of order-edges as a transitive closure increased the number of such edges drastically (e.g., in an extreme case a correction rule contained roughly 3,000 order edges)—making it practically impossible to manually inspect that rule. Moreover, this huge amount of edges may have negative consequences on the distance computation. For instance, when applying Exas vectors (cf. Section 2.3 and Section 3.4), the amount of edges also increases the number of features of the respective vector. We found many order-edges in our examples to be irrelevant because there exist other connections between the same nodes (e.g., via data-flow edges).
Next, we detail the individual steps of ChaRLI and how we tackled these challenges.
Commit Analyzer ( ). The commit analyzer automatically creates a configuration file based on which the subsequent AUG generation produces the respective misuse and fix AUG. For this purpose, the analyzer requires the location of a misuse (i.e., the source file and the method declaration containing the misuse) as well as the commit and the URI of the repository ( ). Currently, we only support git repositories, because they are prevalent among open-source projects (e.g., on GitHub or BitBucket). The analyzer additionally identifies the source-code root path of the project to improve type inference. This is done via the respective package declaration of the source file containing the misuse as well as its file path (e.g., if the source file path is /home/foo/de/bar/project/pkg_a/subpkg_d/File.java and the package declaration would be de.bar.project.pkg_a.subpkg_d then the source-root path is /home/foo/). Additionally, the developer may add paths to libraries as *.jar-files.
AUG Generation ( ). Using the configuration file, ChaRLI checks out the version after the fixing commit (i.e., fixingCommitHash) as fix and the version before the fixing commit (i.e., fixingCommitHash~1) as misuse. For each commit version, ChaRLI generates for the specified method declaration in the given source file the respective AUG. Similar to our previous work (Nielebock et al., 2021a), we also store for each node the respective API type, if available. For instance, node Baz in 1(b) internally stores the corresponding type java.lang.Object. In case the automated type inference could not determine the type, it is set to an empty String.
Change Rule Generation ( ). We depict our algorithm for generating change rules in Algorithm 1. For clarity, we omit the straightforward computations and simplified implementation details. Please refer to our replication package1 for the detailed implementation.
The algorithm receives the misuse AUG and the fix AUG . It then produces a bipartite graph (cf. Algorithm 1 Lines 1–5) by first equalizing the node cardinalities of both graphs by adding empty -nodes (Lines 1–3). This bipartite graph consists of two partitions representing the nodes of and , respectively. Then, all nodes between the two partitions are connected with edges labeled by the -function (Lines 4–5). The -function computes the number of edits (i.e., re-labeling and adding/deleting in- and outgoing edges) needed to transform one node into the respective other node. Afterward, we use the Kuhn-Munkres algorithm (Munkres, 1957) to find a one-to-one mapping with minimal overall costs, and construct the sub-AUGs and with only changed nodes—namely nodes for which (cf. Lines 6–7).
These steps of our algorithm have not been altered concerning our previous work (Nielebock et al., 2021a). Still, in contrast to our initial idea of correction rules (Nielebock et al., 2020), we do not require a user to manually add the misused API for filtering nodes in the AUG. This simplifies the automated inference of change rules. Nevertheless, we designed ChaRLI to be easily extendable with such a feature in case it can further improve a rule’s quality.
Regarding the three challenges we identified, we further revised the algorithm as follows:
- Challenge 1::
-
To handle missing data nodes, we execute a post-hoc adaptation of the change rule. First, we add all neighboring nodes of a changed action node that are connected via a data-flow edge. So, we add all directly incoming parameters and outgoing result objects. We denote this as single-hop addition (cf. Algorithm 1 Lines 8–12). Moreover, we noticed some cases in which it is essential to know how these single-hop-added nodes are subsequently used in the AUG. Thus, second, we also add for each single-hop-added node all neighboring nodes connected via an outgoing data-flow edge (cf. Lines 13–20).
- Challenge 2::
-
To handle missing action nodes related to finally-edges, we reuse the single-hop-addition to add all nodes connected to such an edge (cf. Lines 8–12).
- Challenge 3::
-
To reduce the number of order-edges, we apply a reduction step using Hsu’s algorithm (Hsu, 1975) to compute a minimal equivalent graph (MEG) as implemented in the JGraphT library.222https://jgrapht.org/javadoc-1.5.0/org.jgrapht.core/org/jgrapht/alg/TransitiveReduction.html This algorithm minimizes the number of edges while assuring the graph’s reachability and that the new graph remains a sub-graph of the original one. Note that JGraphT applies only the first part of Hsu’s algorithm, computing only the MEG for acyclic graphs. Since a formal proof that AUGs are acyclic is missing, we cannot directly guarantee the applicability of this algorithm. Thus, we only employ the order-edge reduction (cf. Lines 21–22) if the AUG is acyclic. In our experiments, we did not observe a cyclic AUG.
Finally, we add the transform edges based on our minimal mapping to obtain the final change rule (Line 23).
3.3. Applicability Check
Applicability Check ( ). In our previous work (Nielebock et al., 2021a), we experimented with API misuse detection based on a set of correction rules that we found to be applicable to known correct API usages and API misuses. Particularly, we denoted a correction rule as applicable if the mean distance value between its misuse part is closer to the API misuses than to the fixed API usages, and its correct part is closer to the fixed API usages than to the API misuses. However, this strategy has some drawbacks. First, we need a valid set of known correct API usages and API misuses to compute the distances, which requires essential manual effort for preparation—similar to the efforts of creating API misuse benchmarks (Amann et al., 2016; Kang and Lo, 2021). Second, even though we have a sufficiently large dataset, many rules are only applicable to one specific misuse of a single library, making them infeasible for detecting API misuses in a broader context. Finally, the elicited dataset may not contain any example of the particular API relevant for detecting a misuse, and thus we would discard that correction rule due to the missing applicability to the dataset.
We have relaxed the applicability check to only consider the API usage and misuse to be checked using our novel change rules. Particularly, we check whether the misuse part of a change rule is similar to the API usage under test. Formally, we check with a change rule and an API usage to be tested () whether
| (2) |
holds. The hyperparameter is user-defined, for instance, based on the results of our evaluation that we report in Section 4.
3.4. Graph Distance-Based API Misuse Detection
In the following, we describe how we compute different types of distances between API misuses and our change rules. Then, we specify our actual API misuse detection based on these distances.
Distance Computation . From our previous experiments (Nielebock et al., 2021a), we derived hypotheses for improving distance functions to achieve a better API misuse detection. In our current technique, we rely on Exas vectors, since these and their distance values are easily computable—scaling better for frequent distance computations as required for the use case of misuse detection. Next, we introduce a formal description of Exas vectors as well as a modified computation of the normalization based on the original work by Nguyen et al. (2009a). Afterward, we introduce our different extensions as well as their rationales to improve the misuse detection.
Formally, we denote and as the Exas vectors representing the AUGs and , respectively. These vectors contain the frequencies of n-paths and (p,q)-nodes present in an AUG. The n-paths features describe all paths up to length n in an AUG, while (p,q)-nodes describe all nodes from the AUG having p incoming and q outgoing edges. We identify these features based on their labels. For instance, in 1(b), Object.<init>-1-6 would be one (p,q)-node, while [Foo, para, Object.<init>] would be an n-path of length two. Since Nguyen et al. (Nguyen et al., 2009a) achieved the best results by setting n to four, we also compute the Exas vectors n-paths up to this length. Moreover, we ignore n-paths of length one (i.e., single nodes), since these are already represented by the respective (p,q)-node.
Nguyen et al. (Nguyen et al., 2009a) proved that the L1-norm of the difference between two Exas vectors is related to the GED. Particularly, if two graphs have a certain GED, the L1-norm of their vector difference has an upper bound dependent on the GED. Note that the opposite does not hold. This means that, to some extent, the length of the difference between two Exas vectors can be used to estimate the distance between the graphs they represent. Previously (Nielebock et al., 2021a), we leveraged this property for the distance computation and proposed two distances: first, the L1-norm as suggested by Nguyen et al. and, second, the cosine similarity. We then normalized these distances to obtain a relative distance in the interval to make different Exas vector distances comparable. Since these distances were not successful in detecting API misuses, we subsequently discuss a revised version.
Exas vectors only contain those features present in the respective AUG. Consequently, we need to equalize their feature sets to compute a valid difference. We do this by defining and as the sub-vectors of and , where the feature set is the cut of both original feature sets. To include the ratio between the number of matched and non-matched features, as well as the similarity of the frequencies of the matched features, we compute as well as . The function represents how many features from one vector match with the features from the respective other vector. This way, we can quantify to what degree a vector is a sub-vector of the other one:
| (3) |
with being a function computing the length of a vector (i.e., number of features). Note that, by definition, holds.
To compute , we use two distance functions, namely the L1-norm and the cosine similarity, and normalize them to ensure a relative distance computation. We compute both distances as follows:
| (4) |
where computes the maximum absolute value within a vector, and
| (5) |
where denotes the scalar product. Our final function is a combination of and :
| (6) |
In our evaluation, we used for the scaling factor . We compute and by applying the respective and function, respectively. Please note that these equations are similar, but not identical, to our previous work (Nielebock et al., 2021a)—we refined them to be symmetric.
Based on our previous hypotheses (Nielebock et al., 2021a), we implemented the following variants of the distance functions to research whether they can improve the API misuse detection:
- Indicator Over Frequency::
-
When normalizing Exas vectors, we noticed that vectors containing single highly frequent features hide the relative feature frequency of less frequent features. So, some features became less important for the final distance computation. To mitigate this effect, we propose to use indicators that denote whether a certain feature is present (i.e., 1) or not (i.e., 0), instead of using absolute frequencies. The computation of the distance values remains the same. Note that this adaptation may hide that certain features must be present a certain number of times. We denote indicator vectors with the prefix Indicator- in the distance function name.
- API-Specific Features::
-
We intend to use the computed distance values for API misuse detection. However, some vector distances were mainly influenced by features, and thus AUG nodes, that do not refer to any external API. Therefore, we propose to analyze only those features that contain information about an API. For this purpose, we introduce a function that takes as input a node from an AUG and returns the referred API class if available (cf. step ). For each feature that contains at least one label of an AUG node with non-empty API-type information, we keep that feature in the Exas vector. Then, we compute the remaining distance as before. We denote distance functions building on API-specific features with the prefix API-.
- API-Specific Vector Splitting:
-
Some API usages intertwine different APIs in one method, which would hamper the detection of a similar API usage since non-related APIs are present. We suggest a splitting mechanism that divides an AUG based on its contained API types into several sub-AUGs. Particularly, we group nodes and their respective edges from the original AUG based on the package name of their related API type, namely up to the first three entries of the package name (e.g., java.lang for java.lang.Object). This package name is also used as label of the respective sub-AUG. If we have only a class name or no API information at all, we group those AUG elements in a special miscellaneous sub-AUG. Then, we compute each sub-distance between the sub-AUGs with the same labeled group. The overall distance is the average of all non-distinct (i.e., ) sub-distances. We denote this distance function with the infix -Split-.
- Combinations:
-
We combine all extensions to analyze whether this improves the overall performance of our technique. This provides 16 different distance computations, namely two norms (i.e., L1 and Cosine) for two count types (i.e., indicator vs. frequency) for two feature types (i.e., API-specific vs. all) for two splitting types (i.e., splitting vs. no splitting). However, some of the combinations are redundant. Particularly, using an Indicator function in Equation 6 causes the -function to be either or , since this computes the differences of the sub-vectors that contain only features present in both AUGs, which are all . So, the actual norms (i.e., L1Norm and Cosine) are obsolete. For this reason, we sum up Indicator functions by naming them without the actual norm; reducing the eight cases to four. So, we employ 12 different combinations during our evaluation.
We analyze and compare the impact of these adaptations through our evaluation in Section 4.
API Misuse Detection ( ). If a change rule is applicable, we use Equation 1 to decide whether the checked API usage is a potential misuse. To validate this decision, we also need to define what denotes a correct result. For instance, assume we have a known API misuse and two applicable rules and , from which detects the misuse and does not. Then, produces a true positive () result while produces a false negative () result. Differently, assume a correct API usage for which the same rules and are applicable. For this usage, detects the misuse, while decides the API usage is no misuse. We say that produces a false positive () result while produces a true negative () result.
For each rule, we can compute the number of s, s, s, and s based on a set of known misuses and correct usages—and subsequently precision and recall. Precision measures the proportion of decisions of a rule to all positive decisions. So, it provides an estimation of how trustful the detected API misuses are (i.e., whether they avoid “false alarms”). Recall measures the proportion of detected misuses from the set of known misuses. Please note that our main goal is to increase the precision, while we expect the recall to be low. This is reasonable, since change rules depict a very specific API misuse fix, and thus hardly generalize.
4. Evaluation
We now present our evaluation. To enable replications and reproductions, we publish our complete implementation including ChaRLI, our graph vectorization, distance computation, previous rule analysis, and evaluation results in a persistent, publicly available Zenodo repository.1
4.1. Datasets and Experimental Setting
Datasets. We evaluate our API misuse detection on three independent and publicly available datasets of real API misuses from the open-source domain.
- MUBench:
-
is a dataset developed by Amann et al. (2016) using manually evaluated fixes of API misuses.333https://github.com/stg-tud/MUBench, accessed on January \nth27, 2022 It comprises fixing commits for 280 API misuses, together with their repository URIs. We only used those 116 entries that we used in our previous work (Nielebock et al., 2021a). Moreover, for two entries, we could not retrieve the respective commits anymore, reducing the number to 114 entries. Each API-misuse entry lists the respective git repository, fixing commit hash, as well as the declaration of the misuse-containing method and the respective source-file path.
- AU500:
-
is a dataset of 500 manually assessed API usages by Kang and Lo (2021).444https://github.com/ALP-active-miner/ALP, accessed on January \nth27, 2022 It comprises 385 correct API usages and 115 API misuses. AU500 lists the repository, commit hash, source file, method name, and line number of the usage together with a manual assessment of the ground truth (i.e., correct usage or misuse). Please note that when we constructed the AUGs for AU500 using the implementation of Amann et al. (2019b), we could only generate these for 493 entries (379 correct usages and 114 misuses), identically to our previous work (Nielebock et al., 2021a).
- AndroidCompass:
-
is our own dataset (Nielebock et al., 2021b) of 80,324 changed Android compatibility checks together with their respective repository, commit hashes, source-file paths, and source line.555https://doi.org/10.5281/zenodo.4428340 accessed on January \nth27, 2022 These compatibility checks represent a common pattern in Android apps. Particularly, they protect apps from calling APIs from Android versions that are not present in the version installed on the executing hardware. So, the edits to the if-statements can be interpreted as API misuse fixes. In our experiments, we could produce 24,610 non-empty change rules for the 80,324 entries.
We used these datasets to conduct our experiments on different ground truths, which are not particularly tailored to our misuse detector. This is important for a realistic evaluation in the context of misuse detection as seen in the program repair domain (Durieux et al., 2019).
Experimental Setting. To evaluate our API misuse detection, we measure the impact of the 12 different combinations of distance functions (cf. Section 3.4) as well as of different values for the applicability check (cf. Section 3.3). We measure the precision and recall for individual change rules using the number of , , , and results as described in Section 3.4. For the overall performance, we build on the distributions as well as means among all rules. When comparing different distance functions (cf. Section 3.4) and values for the applicability check (cf. Section 3.3), we compare those distributions using statistical tests. When decreasing the threshold for the applicability check, we also decrease the number of applicable rules, and thus the number of rules producing positive results. This impacts the overall precision, since we do not achieve any positive results for some thresholds (i.e., ). So, we cannot compute the mean precision among all rules, but only among those that produce positive results. We refer to this precision as relative precision. However, we can hardly compare those values, since the actual number of applicable rules may differ between the different distance functions. To mitigate this problem, we compute a conservative precision that sets all precision values to if . Note that this is conservative because we consider rules producing neither s nor s as equal with those rules producing only s.
In our first two experiments, we investigate the best threshold values regarding Equation 2 by conducting a grid-search-based method; spanning the threshold from to in -steps. Based on the results, in the third experiment, we use a threshold of and to reduce the computational effort. In detail, we report on the following three experiments:
- Experiment 1: MUBench on MUBench.:
-
In the first experiment, we derive change rules from each entry in the MUBench dataset and apply these to the misuse and fixed versions of all other entries in MUBench. Note that we do not apply the rule on its own misuse and fix, since this would bias the and . Nevertheless, we found that MUBench has a significant proportion of similar misuses from the Joda-time project (Nielebock et al., 2021c). Thus, we expect that the results may be positively influenced by having similar misuses from the same project. These results should be representative of reusing fixed API misuses for project-internal API misuse detection. Since MUBench consists of misuses from multiple projects, we can also partially observe the cross-project applicability of our techniques.
- Experiment 2: MUBench on AU500.:
-
In the second experiment, we apply the previously obtained change rules from MUBench on the AU500 dataset. We check whether the rules can correctly detect the API misuses and do not report correct usages as misuses. Since MUBench and AU500 do not share any projects, we consider the results representative for reusing fixed API misuses in a cross-project manner.
- Experiment 3: AndroidCompass on AndroidCompass.:
-
In the last experiment, we use the AndroidCompass dataset to obtain change rules. We assume that the version before an updated compatibility check is the misuse, while the updated version is the respective fix. Next to the rules, we also compute the misuse and fix AUGs for each entry. We validate the API misuse detection by conducting a ten-fold cross-validation. Particularly, we split all entries into ten subsets (i.e., buckets) and use the change rules obtained from nine buckets to detect API misuses in the remaining bucket. We sample the buckets so that entries from one repository are contained in exactly one bucket. To achieve this, we define a maximum size of entries in a bucket (i.e., ). Then, we sort the repositories according to their number of entries in AndroidCompass. In a round-robin-like method, we iterate over the repositories and assign all entries of one repository to the respective buckets (i.e., all entries of the largest repository go into bucket #1, all entries of the second-largest repository go into bucket #2, and so on) as long as the maximum size is not exceeded.
During initial experimenting with the generated AUGs, we observed a significantly increased run time for computing distances for larger AUGs and change rules (in terms of the number of nodes). So, we decided to limit the analysis to AUGs and rules with fewer than 100 nodes. We selected this number through an interactive testing method rather than a systematic analysis. Nevertheless, it turned out to be a good compromise between the amount data to analyze and the computation time. Also, rules and AUGs with 100 nodes or more usually represent a very specific and complex change, which is unlikely to be reusable in other projects. Due to this limit, we consider 16,094 entries from 931 different repositories for our analysis, for which we display descriptive statistics in Table 2.
We compute the performance of each run by calculating the mean of the performance metrics of all rules from the respective nine buckets. For the overall performance, we present the distribution of these mean values as well as the mean over all ten runs. Since AndroidCompass provides misuse fixes for similar misuses, namely proper handling of Android compatibility checks, this experiment provides insights into the cross-project applicability of our techniques.
Before conducting our evaluation, we assessed for each dataset from which we obtain change rules (i.e., MUBench, AndroidCompass) the proportion of non-empty change rules that could be computed from all entries (cf. Section 4.2).
| bucket | #entries | #repositories |
|---|---|---|
| 1 | 1,610 | 44 |
| 2 | 1,610 | 52 |
| 3 | 1,610 | 60 |
| 4 | 1,610 | 66 |
| 5 | 1,609 | 75 |
| 6 | 1,609 | 88 |
| 7 | 1,609 | 102 |
| 8 | 1,609 | 116 |
| 9 | 1,609 | 138 |
| 10 | 1,609 | 190 |
| all | 16,094 | 931 |
4.2. Change Rule Inference
Next, we present the results for constructing change rules from MUBench and AndroidCompass using ChaRLI, particularly Algorithm 1. Regarding MUBench, we had an initial set of 114 entries from which we constructed change rules. For that purpose, we required the respective AUGs of the API misuse and fixed version. We could construct those for 92 entries. ChaRLI was able to produce 89 non-empty change rules (i.e., of all analyzed entries and of all generated AUGs).
Regarding AndroidCompass, we filtered the 80,324 entries to exclude:
-
•
40 entries that we previously used for testing purposes;
-
•
entries whose commits only add or delete source files, since the changes are too large; and
-
•
entries for which we could not determine the respective version code of the compatibility check (i.e., the Android version against which the code is tested), since the missing type resolution hampers the AUG generation.
This filtering left 51,999 entries from which we could produce 38,347 misuse and 41,096 fix AUGs. The respective cut set contained 35,857 complete (i.e., misuse and fix AUG are present) entries. From these entries, ChaRLI could construct 24,610 non-empty change rules ( of all tested entries in the dataset and of all generated AUGs). Note that in 6,875 cases the rule generation produced an empty rule, while in the remaining 4,372 cases the rule generation was aborted.666We did not log the concrete exceptions, and thus cannot judge the exact reasons for this behavior. Due to the size filtering (i.e., we discarded AUGs and rules with more than 100 nodes), the number of entries we used in the experiment further decreased to 16,094 change rules.
We observed that particularly for AndroidCompass the rule inference mainly depends on a successful AUG generation. Many change rules could not be created because we were not able to produce the respective AUGs. While we did not investigate the core reasons for this problem, we assume that this is likely due to parsing errors. The original AUG generation targets Java 8, and even though we updated the parser to handle Java 11 some newly introduced concepts may not be properly handled in the AUG generation. Nevertheless, a majority of change rules could be inferred if the AUGs could be generated, making ChaRLI in principle applicable for API misuse detection.
4.3. API Misuse Detection
Now, we report and discuss the results of the three experiments we described in Section 4.1.
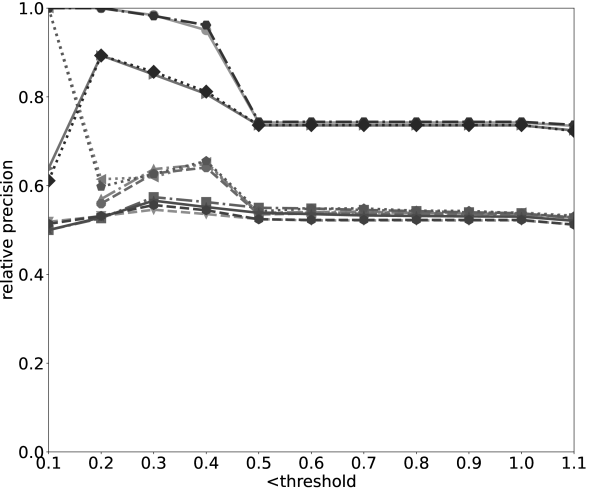
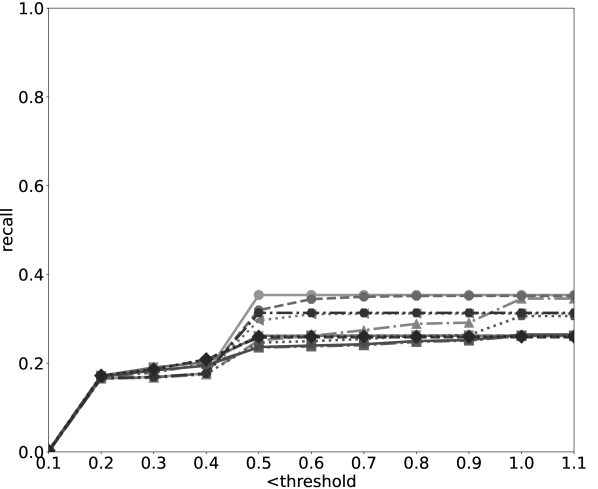

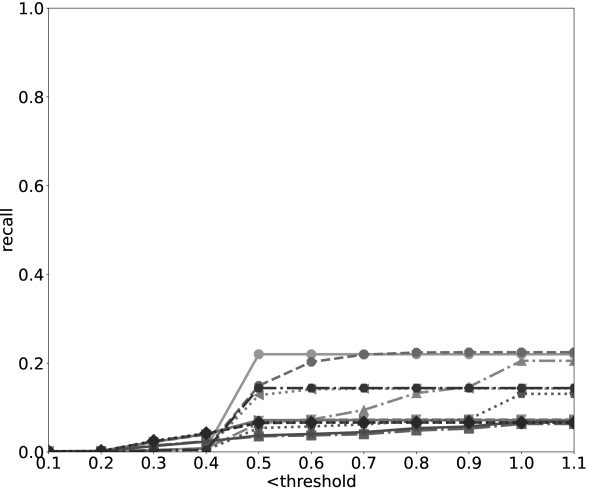
Experiment 1: MUBench on MUBench. We computed the performance values for each change rule as described in Section 4.1 and depict the mean values for the different thresholds in Figure 4. In general, we observe that the mean values are more dynamic with thresholds of . This is caused by most distance values falling into the range of , while only a few have a value of or lower. For instance, we depict a violin plots of the different distance values computed with the IndicatorExasVector in Figure 5—all other distance functions result in similar distributions. We can see that more distance values are located near and . So, when filtering out a major set of rules, the performance metrics are only influenced by the much smaller distance values located in the range .
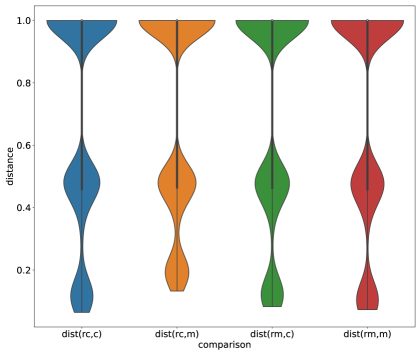
More distances being around the values and can be explained with one property of Equation 6. Since most API usages are different, they do not share any features (i.e., ), and thus no shared sub-vectors exist (i.e., ). However, assume that two vectors have only one matching feature. Then, the frequency of features is likely to be equal (i.e., ), while the proportion of matched features to all features in a vector is usually low (i.e., ). So, a likely distance value is , and because we defined , this value occurs more frequently.
When comparing relative (4(a)) and conservative precision (4(b)) to the recall (4(c)), we can see that the mean precision is usually higher than the mean recall; which we expected. The recall is constantly decreasing with smaller thresholds, because more and more rules are not applicable, and thus do not detect any positive results. Similarly, the conservative precision decreases, since we assign a precision of zero to non-applicable rules.
We can see in 4(a) that the two distance functions IndicatorExasVector and APIIndicatorExasVector achieved a relative precision of more than (i.e., and , respectively) with a threshold of . Moreover, their respective -Split- versions achieved the maximum of at a threshold of . For the threshold , the distance functions APIExasVectorL1Norm and APIExasVectorCosine achieved a mean precision of . Considering the respective conservative precision (cf. 4(b)), the distance functions IndicatorExasVector and APIIndicatorExasVector usually achieved the highest precision values (i.e., for both at the threshold ) followed by the their respective -Split- functions (i.e., for IndicatorSplitExasVector at the threshold and for APIIndicatorSplitExasVector at the threshold ) .
Based on this observation, we estimate the best performance for the distance functions in the threshold range . Since the recall is constantly decreasing with smaller thresholds, we further checked the maximum threshold value of . Particularly, we analyzed whether the differences in the means for the conservative precision and recall at this threshold are statistically significant. We used the Wilcoxon signed-rank test () to conduct pairwise comparisons, since this test does not enforce a normal distribution. To cope with zero differences in the ranks, we applied the “pratt”-option by scipy777https://docs.scipy.org/doc/scipy/reference/generated/scipy.stats.wilcoxon.html. Because we have multiple comparisons, we applied the conservative Bonferroni correction on all statistical tests. We depict the results of our tests in Table 3 and Table 4. Note that we conducted the comparisons only once, but depict the mirrored test results (i.e., distance function A compared to B is identical to B compared with A).
APIExasVectorCosine APIExasVectorL1Norm APIExasVectorSplitCosine APIExasVectorSplitL1Norm APIIndicatorExasVector APIIndicatorExasVectorSplit ExasVectorCosine ExasVectorL1Norm ExasVectorSplitCosine ExasVectorSplitL1Norm IndicatorExasVector IndicatorExasVectorSplit APIExasVectorCosine - ✗ ✗ ✗ ¡ ✓-0.32 ¡ ✓-0.3 ✗ ✗ ✗ ✗ ¡ ✓-0.31 ¡ ✓-0.28 APIExasVectorL1Norm ✗ - ✗ ✗ ¡ ✓-0.32 ¡ ✓-0.31 ✗ ✗ ✗ ✗ ¡ ✓-0.31 ¡ ✓-0.29 APIExasVectorSplitCosine ✗ ✗ - ✗ ¡ ✓-0.37 ¡ ✓-0.36 ✗ ✗ ✗ ✗ ¡ ✓-0.36 ¡ ✓-0.34 APIExasVectorSplitL1Norm ✗ ✗ ✗ - ¡ ✓-0.38 ¡ ✓-0.36 ✗ ✗ ✗ ✗ ¡ ✓-0.36 ¡ ✓-0.33 APIIndicatorExasVector ¿ ✓0.32 ¿ ✓0.32 ¿ ✓0.37 ¿ ✓0.38 - ✗ ¿ ✓0.34 ¿ ✓0.33 ¿ ✓0.37 ¿ ✓0.38 ✗ ✗ APIIndicatorExasVectorSplit ¿ ✓0.3 ¿ ✓0.31 ¿ ✓0.36 ¿ ✓0.36 ✗ - ¿ ✓0.33 ¿ ✓0.32 ¿ ✓0.36 ¿ ✓0.35 ✗ ✗ ExasVectorCosine ✗ ✗ ✗ ✗ ¡ ✓-0.34 ¡ ✓-0.33 - ✗ ✗ ✗ ¡ ✓-0.33 ¡ ✓-0.31 ExasVectorL1Norm ✗ ✗ ✗ ✗ ¡ ✓-0.33 ¡ ✓-0.32 ✗ - ✗ ✗ ¡ ✓-0.32 ¡ ✓-0.3 ExasVectorSplitCosine ✗ ✗ ✗ ✗ ¡ ✓-0.37 ¡ ✓-0.36 ✗ ✗ - ✗ ¡ ✓-0.36 ¡ ✓-0.34 ExasVectorSplitL1Norm ✗ ✗ ✗ ✗ ¡ ✓-0.38 ¡ ✓-0.35 ✗ ✗ ✗ - ¡ ✓-0.37 ¡ ✓-0.33 IndicatorExasVector ¿ ✓0.31 ¿ ✓0.31 ¿ ✓0.36 ¿ ✓0.36 ✗ ✗ ¿ ✓0.33 ¿ ✓0.32 ¿ ✓0.36 ¿ ✓0.37 - ✗ IndicatorExasVectorSplit ¿ ✓0.28 ¿ ✓0.29 ¿ ✓0.34 ¿ ✓0.33 ✗ ✗ ¿ ✓0.31 ¿ ✓0.3 ¿ ✓0.34 ¿ ✓0.33 ✗ -
APIExasVectorCosine APIExasVectorL1Norm APIExasVectorSplitCosine APIExasVectorSplitL1Norm APIIndicatorExasVector APIIndicatorExasVectorSplit ExasVectorCosine ExasVectorL1Norm ExasVectorSplitCosine ExasVectorSplitL1Norm IndicatorExasVector IndicatorExasVectorSplit APIExasVectorCosine - ✗ ¡ ✓-0.12 ✗ ✗ ¡ ✓-0.12 ✗ ✗ ¡ ✓-0.11 ¡ ✓-0.08 ✗ ¡ ✓-0.11 APIExasVectorL1Norm ✗ - ¡ ✓-0.12 ✗ ✗ ¡ ✓-0.13 ✗ ✗ ¡ ✓-0.12 ¡ ✓-0.1 ✗ ¡ ✓-0.12 APIExasVectorSplitCosine ¿ ✓0.12 ¿ ✓0.12 - ¿ ✓0.03 ✗ ✗ ¿ ✓0.12 ¿ ✓0.13 ✗ ✗ ¿ ✓0.11 ✗ APIExasVectorSplitL1Norm ✗ ✗ ¡ ✓-0.03 - ✗ ¡ ✓-0.04 ¿ ✓0.09 ¿ ✓0.1 ✗ ✗ ✗ ✗ APIIndicatorExasVector ✗ ✗ ✗ ✗ - ¡ ✓-0.12 ✗ ✗ ¡ ✓-0.11 ✗ ✗ ¡ ✓-0.11 APIIndicatorExasVectorSplit ¿ ✓0.12 ¿ ✓0.13 ✗ ¿ ✓0.04 ¿ ✓0.12 - ¿ ✓0.13 ¿ ✓0.14 ✗ ✗ ¿ ✓0.12 ✗ ExasVectorCosine ✗ ✗ ¡ ✓-0.12 ¡ ✓-0.09 ✗ ¡ ✓-0.13 - ✗ ¡ ✓-0.12 ¡ ✓-0.09 ✗ ¡ ✓-0.12 ExasVectorL1Norm ✗ ✗ ¡ ✓-0.13 ¡ ✓-0.1 ✗ ¡ ✓-0.14 ✗ - ¡ ✓-0.13 ¡ ✓-0.1 ✗ ¡ ✓-0.13 ExasVectorSplitCosine ¿ ✓0.11 ¿ ✓0.12 ✗ ✗ ¿ ✓0.11 ✗ ¿ ✓0.12 ¿ ✓0.13 - ✗ ¿ ✓0.11 ✗ ExasVectorSplitL1Norm ¿ ✓0.08 ¿ ✓0.1 ✗ ✗ ✗ ✗ ¿ ✓0.09 ¿ ✓0.1 ✗ - ¿ ✓0.08 ✗ IndicatorExasVector ✗ ✗ ¡ ✓-0.11 ✗ ✗ ¡ ✓-0.12 ✗ ✗ ¡ ✓-0.11 ¡ ✓-0.08 - ¡ ✓-0.11 IndicatorExasVectorSplit ¿ ✓0.11 ¿ ✓0.12 ✗ ✗ ¿ ✓0.11 ✗ ¿ ✓0.12 ¿ ✓0.13 ✗ ✗ ¿ ✓0.11 -
Regarding the conservative precision, we can observe that the functions IndicatorExasVector, IndicatorExasVectorSplit, APIIndicatorExasVector, and APIIndicatorExasVectorSplit achieved a significantly better precision. In contrast, we could not determine significant differences within this group. Considering the recall, we can see that the -Split- functions have a significantly larger recall then the remaining functions. Within the -Split--functions, we can observe that some -Cosine-functions have a significant larger recall than the -L1Norm-functions, for instance, ExasVectorSplitCosine compared to ExasVectorSplitL1Norm.
We also computed the effect sizes using Cliff’s (Hogarty and Kromrey, 1999; Kitchenham et al., 2017). Our results indicate medium effect sizes for the conservative precision, while they are usually small for the recall. However, the positive results regarding the precision may be a result of the large proportion of rules in the MUBench dataset originating from the project Joda-Time (i.e., 40 of 89). Nevertheless, the results are still valuable. First, they describe the applicability of our technique in a within-project setting (i.e., finding similar API misuses in the same project). Second, we identified individual differences between the distance functions to guide our other experiments.
We see that only a minority of misuses could be detected. Particularly, the mean numbers of absolute true positives detected by the best performing functions at threshold are for IndicatorExasVector, for IndicatorExasVectorSplit, for APIIndicatorExasVector, and for APIIndicatorExasVectorSplit. Thus, we state that even though the functions achieve a high relative precision (i.e., low rate of ‘false alarms’), this technique is only a complement to existing API misuse detectors with a much higher recall.
The good performance is also indicated by the violin plot in Figure 5. This plot describes the distributions of the different use cases (particularly, for the IndicatorExasVector function) when comparing rules with actual API usages, such as the distance between the correct part (i.e., ) of the rule and the misuse (i.e., ). We observe that the higher frequencies around and are almost equal in all cases. However, the frequency of distances towards the for the use case is slightly larger than the others. This benefits the misuse detection conducted by Equation 1 since then it is more likely that the distance of is larger than the distance . Similarly, due to the equal distributions on the bottom of the violin plots, the distance of is more unlikely to be larger than the distance . Thus, the misuse detection does not report correct usages as misuses. As discussed before, most distributions of the distance values are similarly shaped, which justifies the benefit of the applicability check. However, the number of applicable rules usually causes the different performance of the distance functions.
Experiment 2: MUBench on AU500.

APIExasVectorCosine APIExasVectorL1Norm APIExasVectorSplitCosine APIExasVectorSplitL1Norm APIIndicatorExasVector APIIndicatorExasVectorSplit ExasVectorCosine ExasVectorL1Norm ExasVectorSplitCosine ExasVectorSplitL1Norm IndicatorExasVector IndicatorExasVectorSplit APIExasVectorCosine - ✗ ✗ ✗ ✗ ✗ ✗ ✗ ✗ ✗ ✗ ¡ ✓-0.13 APIExasVectorL1Norm ✗ - ¡ ✓-0.12 ✗ ✗ ¡ ✓-0.12 ✗ ✗ ¡ ✓-0.12 ✗ ✗ ¡ ✓-0.14 APIExasVectorSplitCosine ✗ ¿ ✓0.12 - ✗ ✗ ✗ ¿ ✓0.12 ¿ ✓0.13 ✗ ✗ ✗ ✗ APIExasVectorSplitL1Norm ✗ ✗ ✗ - ✗ ✗ ✗ ✗ ✗ ✗ ✗ ✗ APIIndicatorExasVector ✗ ✗ ✗ ✗ - ✗ ✗ ✗ ✗ ✗ ✗ ✗ APIIndicatorExasVectorSplit ✗ ¿ ✓0.12 ✗ ✗ ✗ - ¿ ✓0.12 ¿ ✓0.13 ✗ ✗ ✗ ✗ ExasVectorCosine ✗ ✗ ¡ ✓-0.12 ✗ ✗ ¡ ✓-0.12 - ✗ ¡ ✓-0.12 ✗ ✗ ¡ ✓-0.14 ExasVectorL1Norm ✗ ✗ ¡ ✓-0.13 ✗ ✗ ¡ ✓-0.13 ✗ - ¡ ✓-0.13 ✗ ✗ ¡ ✓-0.15 ExasVectorSplitCosine ✗ ¿ ✓0.12 ✗ ✗ ✗ ✗ ¿ ✓0.12 ¿ ✓0.13 - ✗ ✗ ✗ ExasVectorSplitL1Norm ✗ ✗ ✗ ✗ ✗ ✗ ✗ ✗ ✗ - ✗ ✗ IndicatorExasVector ✗ ✗ ✗ ✗ ✗ ✗ ✗ ✗ ✗ ✗ - ✗ IndicatorExasVectorSplit ¿ ✓0.13 ¿ ✓0.14 ✗ ✗ ✗ ✗ ¿ ✓0.14 ¿ ✓0.15 ✗ ✗ ✗ -
APIExasVectorCosine APIExasVectorL1Norm APIExasVectorSplitCosine APIExasVectorSplitL1Norm APIIndicatorExasVector APIIndicatorExasVectorSplit ExasVectorCosine ExasVectorL1Norm ExasVectorSplitCosine ExasVectorSplitL1Norm IndicatorExasVector IndicatorExasVectorSplit APIExasVectorCosine - - ¡ ✓-0.45 ¡ ✓-0.35 ✗ ¡ ✓-0.47 ¡ ✓-0.18 ¡ ✓-0.17 ¡ ✓-0.44 ¡ ✓-0.35 ¡ ✓-0.22 ¡ ✓-0.47 APIExasVectorL1Norm - - ¡ ✓-0.45 ¡ ✓-0.35 ✗ ¡ ✓-0.47 ¡ ✓-0.18 ¡ ✓-0.17 ¡ ✓-0.44 ¡ ✓-0.35 ¡ ✓-0.22 ¡ ✓-0.47 APIExasVectorSplitCosine ¿ ✓0.45 ¿ ✓0.45 - ¿ ✓0.08 ¿ ✓0.43 ✗ ✗ ✗ ✗ ¿ ✓0.08 ✗ ✗ APIExasVectorSplitL1Norm ¿ ✓0.35 ¿ ✓0.35 ¡ ✓-0.08 - ¿ ✓0.33 ¡ ✓-0.11 ✗ ✗ ✗ ✗ ✗ ¡ ✓-0.11 APIIndicatorExasVector ✗ ✗ ¡ ✓-0.43 ¡ ✓-0.33 - ¡ ✓-0.46 ¡ ✓-0.16 ¡ ✓-0.15 ¡ ✓-0.42 ¡ ✓-0.34 ¡ ✓-0.2 ¡ ✓-0.45 APIIndicatorExasVectorSplit ¿ ✓0.47 ¿ ✓0.47 ✗ ¿ ✓0.11 ¿ ✓0.46 - ✗ ✗ ✗ ¿ ✓0.1 ✗ ✗ ExasVectorCosine ¿ ✓0.18 ¿ ✓0.18 ✗ ✗ ¿ ✓0.16 ✗ - ✗ ✗ ✗ ✗ ✗ ExasVectorL1Norm ¿ ✓0.17 ¿ ✓0.17 ✗ ✗ ¿ ✓0.15 ✗ ✗ - ✗ ✗ ✗ ✗ ExasVectorSplitCosine ¿ ✓0.44 ¿ ✓0.44 ✗ ✗ ¿ ✓0.42 ✗ ✗ ✗ - ¿ ✓0.08 ✗ ✗ ExasVectorSplitL1Norm ¿ ✓0.35 ¿ ✓0.35 ¡ ✓-0.08 ✗ ¿ ✓0.34 ¡ ✓-0.1 ✗ ✗ ¡ ✓-0.08 - ✗ ¡ ✓-0.1 IndicatorExasVector ¿ ✓0.22 ¿ ✓0.22 ✗ ✗ ¿ ✓0.2 ✗ ✗ ✗ ✗ ✗ - ✗ IndicatorExasVectorSplit ¿ ✓0.47 ¿ ✓0.47 ✗ ¿ ✓0.11 ¿ ✓0.45 ✗ ✗ ✗ ✗ ¿ ✓0.1 ✗ -
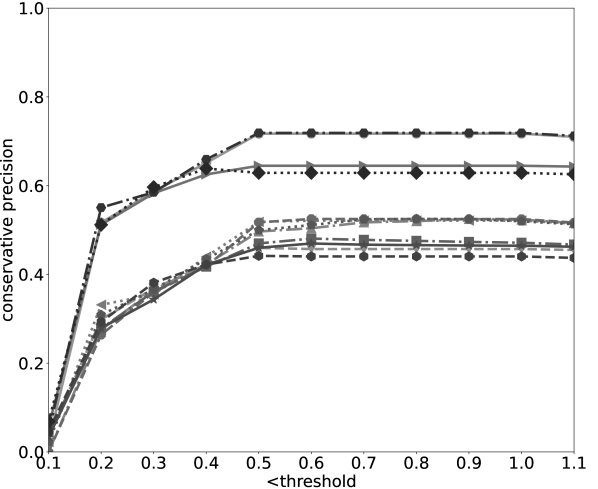
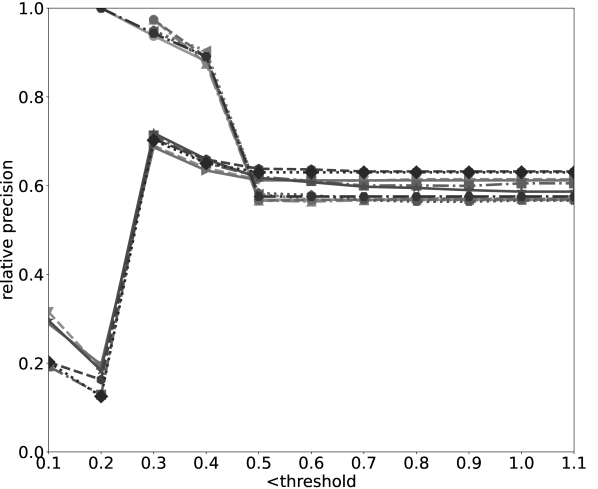
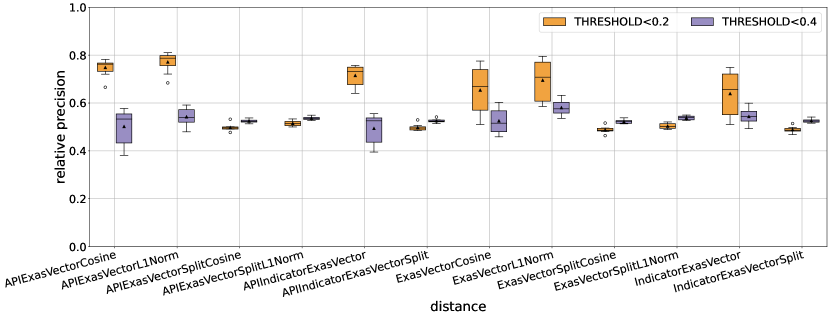
Similar to the previous experiment, we computed the mean values of the relative and conservative precision as well as the recall. The results are depicted in Figure 6. Again, we observe more dynamics in the mean values for a threshold and lower, some fairly high increase in the mean relative precision of certain distance functions of more than between the thresholds and (cf. 6(a)) as well as a rapidly decreasing recall for lower thresholds (cf. 6(c)). However, we observe that this drop, especially from to , is steeper than in the MUBench on MUBench experiment. Therefore, we also consider the performance of the distance function at the threshold since lower thresholds would only further decrease the recall without substantially increasing the relative precision.
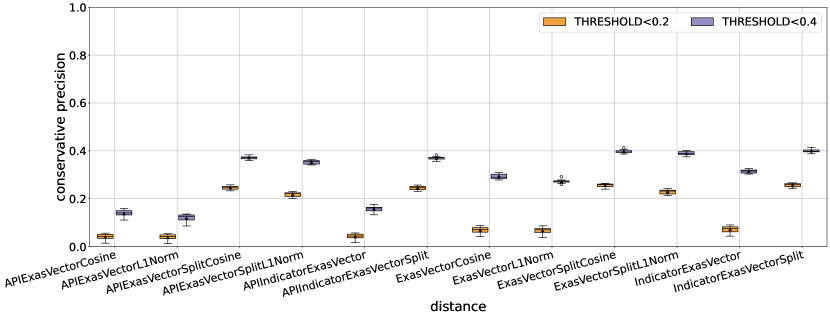
At this threshold, the distance functions achieving the highest mean relative precision are ExasVectorL1Norm (), ExasVectorCosine (), APIExasVectorL1Norm (), APIExasVectorCosine (), IndicatorExasVector (), and APIIndicatorExasVector (). Regarding the conservative precisions (cf. 6(b)) and the recall (cf. 6(c)) at threshold the visual differences are subtle. Nevertheless, we pairwise checked whether the differences are significant (cf. Table 5 and Table 6).
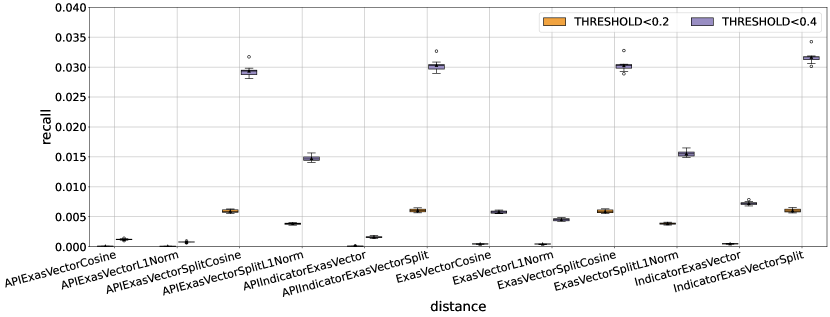
We observe that the distance functions APIExasVectorSplitCosine, APIIndicatorExasVectorSplit, ExasVectorSplitCosine, and IndicatorExasVectorSplit have a significant better conservative precision than mainly the non--Split--functions. However, the effect size is usually small for these cases. Regarding the recall, we observe that mainly the -Split--functions have some significantly higher recall than other functions with partially large effect sizes, such as IndicatorExasVectorSplit compared to APIExasVectorCosine.
In comparison to the results of the first experiment, we also observe the same positive effect on the increase of relative precision when decreasing the threshold. In this setting the -Split--functions perform better even though the effect is less strong. However, the recall is usually very low. For instance, the mean number of absolute true positives at threshold ranges from up to , while we tested for misuses. Therefore, this cross-project setting is less successful in detecting the majority of misuses. Nevertheless, if misuses are detected the chance of ‘false alarms’ is usually very low.
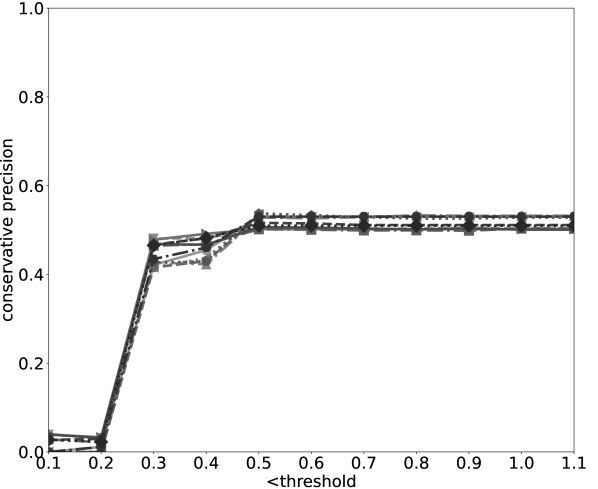
Experiment 3: AndroidCompass on AndroidCompass. Due to the huge amount of distance computations in this setting, we ran the experiments on a compute cluster (processor 64x 2.9 GHz with hyper-threading, 1TB RAM). The computation of all twelve distance values among all ten-fold cross-validation subsets took approximately three weeks on this cluster. We computed the performance values (i.e., relative and conservative precision as well as recall) as described in Section 4.1. To reduce the number of computations we only considered the threshold-values of and based on our experience from the previous two experiments. The distributions of the performance values are depicted as boxplot in Figure 7.
In detail, the best mean values of the relative precision were achieved with -value by APIExasVectorL1Norm (), APIExasVectorCosine (), and APIIndicatorExasVector (). This is followed by ExasVectorL1Norm (), ExasVectorCosine (), and IndicatorExasVector (). Note that these values have a larger variance as indicated by 7(a). The -Split- distances usually perform worse regarding the relative precision, however, they show a larger conservative precision with (cf. 7(b)) than the non--Split- variants. Except for the -Split- distances, we can also observe an improved relative precision when using the smaller . The mean recall is very close to zero (cf. Figure 7(c)) ranging from for APIExasVectorL1Norm at to for IndicatorExasVectorSplit at .
Again, we observed the positive effect on the relative precision when decreasing the value (except for -Split- distances). Regarding the relative precision distances using Exas vectors with API-specific features perform best, while regarding the conservative precision distances using the -Split--feature perform better. This is similar to the second experiment and may indicate that these distances perform best in a cross-project setting. Again, the recall is very low, manifesting the insight that the distance-based misuse detection may work best in a hybrid setting together with other misuse detection mechanisms (e.g., applying frequent API usage patterns).
5. Discussion
5.1. Implications of the Results and Comparison to other API Misuse Detectors
In this section, we compare the results of ChaRLI with its respective distance-based misuse detection to the performance values, particularly, precision and recall, of other API misuse detectors. We collected these state-of-the-art tools based on the works by Amann et al. (Amann, 2018; Amann et al., 2019a) and Kang and Lo (Kang and Lo, 2021) as well as our own literature research applying a forward snowballing-like approach based on these publications. An overview of the comparison is depicted in Table 7. We emphasize that the results are based on the reports of the respective papers and apart from those not directly applied to the MUBench or AU500 dataset are only indirectly comparable. Nevertheless, this shows the current state of the performance of API misuse detectors and whether our results represent an improvement regarding the current state. Moreover, our approach measures the mean precision and recall over the values achieved by the single, applicable rules. Thus, it is very unlikely to find values for those rules providing a high recall, since we do not expect to have a ‘super-rule’ detecting a majority of misuses.
| Detector | Validation Datasets | Precision | Recall |
|---|---|---|---|
| ALP (Kang and Lo, 2021) | AU500, MUBench | ||
| MUDetect (Amann et al., 2019b; Kang and Lo, 2021) | AU500, MUBench | ||
| Ren et al. (Ren et al., 2020) | MUBench | ||
| FuzzyCatch (Nguyen et al., 2020) | self-collected | 888recall on manually selected exception bugs | |
| Salento (Murali et al., 2017) | self-collected | 999no specific numbers for true/false positive/negatives reported | |
| Pradel et al. (Pradel et al., 2012) | DeCapo(Blackburn et al., 2006) | ||
| Pradel and Gross (Pradel and Gross, 2012) | DeCapo | N/A | |
| Tikanga (Wasylkowski and Zeller, 2011; Amann et al., 2019a) | self-collected, MUBench | 101010only available for MUBench | |
| SpecCheck (Nguyen and Khoo, 2011) | DeCapo | N/A | |
| DMMC (Monperrus et al., 2010; Amann et al., 2019a) | self-collected, MUBench | 10 | |
| OCD (Gabel and Su, 2010) | self-collected | N/A | |
| GROUMiner (Nguyen et al., 2009b; Amann et al., 2019a) | self-collected, MUBench | 10 | |
| CAR-Miner (Thummalapenta and Xie, 2009b) | subset from (Weimer and Necula, 2005) | 111111relative recall in comparison to WN-miner specifications (Weimer and Necula, 2005) | |
| Acharya and Xie (Acharya and Xie, 2009) | self-collected | N/A | |
| Alattin (Thummalapenta and Xie, 2009a) | self-collected | 121212relative recall in comparison to a baseline approach | |
| Jadet (Wasylkowski et al., 2007; Amann et al., 2019a) | self-collected, MUBench | 10 | |
| PR-Miner (Li and Zhou, 2005) | self-collected | N/A | |
| Our Approach | MUBench, AU500, AndroidCompass |
Misuse Detectors on the same dataset. One very recent and related result is based on the work by Kang and Lo with their active-learning-based approach ALP (Kang and Lo, 2021). In their work, they compare ALP with the cross-project version of MUDetect (Amann, 2018; Amann et al., 2019b), namely, MUDetectXP on the datasets MUBench and AU500. Compared with our results, their recall is larger, however, their precision is much lower.
Amann et al. tested Tikanga (Wasylkowski and Zeller, 2011), DMMC (Monperrus et al., 2010), GROUMiner (Nguyen et al., 2009b), and Jadet (Wasylkowski et al., 2007) on the MUBench dataset and also stated a much lower precision than ours and comparable or partially better recall for MUBench (i.e., our value was for MUBench). For the tested approaches, even on the self-collected datasets of those detectors the precision was lower than seen in our results.
Ren et al. (Ren et al., 2020) built a detector based on a knowledge graph constructed from caveats of the API documentation and tested them on a subset of MUBench. They measured the precision by checking the code version containing the misuse with their tooling and assessing whether the explanation matches the misuse description. They do not report the performance on real negative results, particularly, the false positive rate for code not containing an API misuse. Similar to the work by Kang and Lo, they achieved a higher recall than our approach. In opposite, we do not require information from the documentation.
Misuse Detectors on other datasets. A very promising and recent approach is FuzzyCatch which achieves fairly good precision (i.e., comparable to our results) and recall values on their self-collected dataset. However, their approach is designed and tested to detect missing exception handling procedures, while our approach is not particularly limited to a certain kind of misuse as long as there exists a fixing commit. Similarly, the approach by Acharya and Xie (Acharya and Xie, 2009) considers error handling specifications in C and could also achieve comparable results.
Salento (Murali et al., 2017) is a tool for learning a statistical model using a Bayesian framework to discriminate misuses from correct usages. While achieving promising results, it was currently tested only on Android apps and their tool requires a learning phase and data. In our work, we only need a fixing commit to trigger a misuse detection.
Pradel and Gross (Pradel and Gross, 2012) developed a misuse detector inferring patterns from execution traces of automatically generated test runs. In their experiment, they achieved a zero false-positive rate. However, this is a dynamic approach since the pattern inference requires the execution of the code. This is not necessary for ChaRLI and the subsequent misuse detection. Similarly, the approach by Pradel et al. (Pradel et al., 2012) infers multi-object specifications by a dynamic specification miner.
Finally, the tools SpecCheck (Nguyen and Khoo, 2011), OCD (Gabel and Su, 2010), CAR-miner (Thummalapenta and Xie, 2009b), Alattin (Thummalapenta and Xie, 2009a), and PR-Miner (Li and Zhou, 2005) performed worse regarding the precision while the recall was either not reported or only compared to a baseline approach and reported as the relative recall, i.e., the proportion of detected misuses found by any of the tested detectors.
Summary of the Comparison. We found that ChaRLI and its misuse detection is a promising approach to increase the precision of API misuse detection. However, regarding the recall, our approach performs worse than other detectors. This is caused by our measurement of the performance which focuses on single rules instead of a set of multiple rules. For the latter, we require a technique to select and rank rules in case multiple rules were applicable. Based on our results this ranking could be done along the -value (cf. Equation 2). Having a strong cut-off of applicable rules (i.e., the -value), we expect to keep the observed large precision while increasing the recall. This needs to be tested in future analyses.
Moreover, ChaRLI is a static approach (i.e., no code execution needed) and does not require a large-scale pattern mining, since it relies only on previously fixed misuses. Indeed, we require a proper set of fixes to infer change rules. However, similarly, pattern mining-based approaches require a set of high-quality code samples to infer patterns from. Due to its simplicity (i.e., comparing API usages via vectors distances), we expect it to be scalable. In Section 7, we discuss some potential improvements for speeding up the vector generation and distance computation.
5.2. Threats to Validity
In this section, we discuss potential threats to the validity of our experimental results. As discussed by Wohlin et al. (Wohlin et al., 2012) (pp. 104ff), we consider threats to the internal, external, and construct validity.
Internal Validity. This paragraph discusses threats that may have influence on the independent values and thus may bias the drawn conclusions.
The results of our preliminary study on the quality of produced correction rules may be biased due to the subjective assessment and preference of the first three authors. Another independent group may validate these rules differently or would suggest different solutions. Thus, the results are part our replication package1.
We only compared our results to other detectors based on their reports. However, even though some used the same dataset, we did not have control over those experiments. For instance, some detectors may only be validated on a subset, which we did not consider due to our previous filtering. Thus, the comparison of the precision values may not directly match due to different data, which would explain the differences in the precision values.
In our experiments, we implemented several timeout mechanisms to cope with issues during git checkouts or long-lasting analyses. This may have an effect on the results, particularly, for smaller datasets, such as in the MUBench on MUBench experiment. For instance, when code samples were excluded, which would have produced bad performing change rules, these would bias the results.
In the cross-project setting, particularly, in the AndroidCompass dataset, repositories with an equal history (i.e., forked projects) may exist in different buckets of the cross-fold validation. This may bias the misuse detection, since then the misuse could have been detected by effectively the same change. We mitigated this effect by using cross-fold validation. Nevertheless, for re-validation purposes, we provide data and scripts in our replication package.
We did not control whether the fixing commit was present at the time the misuse existed. That means at the time the misuse was present, it was not clear whether we could construct the change rule that detects that misuse.
Moreover, the high precision may also be caused by detecting only limited types of misuses while not detecting other kinds, which could explain the low recall. We tried to mitigate this by applying different and independent datasets.
External Validity. This paragraph discusses threats hampering the generalizability of our results.
The MUBench on MUBench experiment is considered as a project-internal setting since many misuses came from a single project (i.e., Joda-time). This may have only limited expressiveness for other project-internal settings. It may perform worse for projects without matching fixes in the version history. Nevertheless, the cross-project setting still achieves good precision values.
Our approach is designed for the object-oriented programming language Java and particularly the AUG generation leverages some details of its syntax. Thus, we cannot ensure whether our results apply to other programming languages and program paradigms. To apply ChaRLI and its subsequent distance-based misuse detection, one must implement a similar transformation to AUGs and test its ability to detect misuse by using proper datasets.
Construct Validity. This paragraph considers potential issues with experimental design and the measurements, namely, whether the values are representative of the desired effect.
Single rule performance (i.e., precision, recall) may have only limited expressiveness, for instance, when multiple rules are applicable. For that purpose, we require ranking strategies for rules similar to a pattern-based ranking. Depending on the strategy, the precision may differ from our results. Having a good cut-off criterion (i.e., -value) and a high average precision among the applicable rules, we hope that this threat is mitigated. This will be validated in future work.
We only assume that the changing commit within the AndroidCompass dataset represents a misuse fix. In case this is not true, namely, the version before the commit is no misuse, our conclusion does not refer to misuse detection but rather detection of upcoming changes.
We do not report the severity of detected misuses. This may be important for the developers since they likely want to fix severe security bugs before handling inconvenient GUI errors.
6. Related Work
Next to works on API misuse detectors, our work relates to other domains, particularly, historical and collaborative bug detection and program repair, as well as research on code matching metrics.
6.1. Historical or Context-related Bug Detection and Program Repair
There is a huge domain working on the topic of automated program repair (APR) (Monperrus, 2018). These tools naturally also apply bug detection and localization techniques, and thus, partially relate to our topic of misuse detection. However, mainly they do not consider API misuses in particular and their goal is to fix a bug eventually.
Among these approaches, several ideas were applied to leverage the information from past fixes (i.e., historical) to overcome bugs in similar code fragments (i.e., context-related). For instance, tools may use code-similarities to rank or retrieve patch candidates (Le et al., 2016; Xin and Reiss, 2017). Very recently, tools applied mining and deep-learning-based technologies to learn patterns from previous or context-related fixes and achieved good results in comparison to standard APR tools (Tufano et al., 2019; Bader et al., 2019; Kim and Kim, 2019; Li et al., 2020; Koyuncu et al., 2020; Liu et al., 2021). In opposite to ChaRLI and our misuse detection, these tools require separate data and a training phase to fix bugs, while we aim to transfer specific fixes to other locations.
Many program repair tools apply automated tests to identify code sites that must be altered to fix a bug. Usually, these approaches mark lines (i.e., spectra) that are more frequently executed when applying failing than passing tests, which is denoted as spectrum-based fault localization (SBFL). Wen et al. introduced a historical SBFL technique that automatically ranks located bugs by the ratio of bug-inducing and non-bug-inducing commits which add these lines (Wen et al., 2021). However, SBFL only locates faults, while our approach also provides possible solutions in the form of change rules.
Nevertheless, these approaches also demonstrate the beneficial impact on bug detection and repair when applying information from other, similar fixes.
6.2. Cooperative Bug Detection and Program Repair
Cooperative bug detection and program repair aim to support developers in finding and fixing bugs by interacting with other developers or their code and leveraging their previous knowledge.
Liu et al. introduced SOFix, an APR approach, which leverages code samples from StackOverflow discussions to infer repair templates (Liu and Zhong, 2018). However, their tool lacks the interactive component, since their templates are only inspired by the extracted code samples.
Tan and Li introduced Bugine for Android apps that applies natural language processing and a ranking technique to find related issue reports on GitHub. They found it supportive to identify possible test scenarios and thus bugs, for student developers of Android apps (Tan and Li, 2020).
6.3. Code Matching Techniques
In our work, we compare code changes with potential other misuses. This is a related task in code search and code clone detection.
For instance, in our previous work on commit-based preprocessing to improve the pattern quality, we applied a keyword-based approach finding similar API usages (Nielebock et al., 2021c) which was inspired by similar code search tools (Holmes and Murphy, 2005; Sahavechaphan and Claypool, 2006). In our prior work (Nielebock et al., 2021c), we also discussed related code search techniques which apply domain-specific languages (Paul and Prakash, 1994), used code elements such as test cases, method declarations, or input/output examples to retrieve code samples (Lemos et al., 2007; Reiss, 2009; Stolee et al., 2014), as well as similarities in the documentation (Kim et al., 2010). Gu et al. applied a deep learning technique to infer embeddings of code to relate similar code (Gu et al., 2018).
In the domain of code clone detection techniques range from detecting syntactical equal to semantically (but not necessarily syntactically) equal code (Koschke, 2007; Roy et al., 2009). The well-known Deckard tool used an AST-vectorization and thus inspired the Exas Vector technique (Jiang et al., 2007). Modern code clone detectors apply deep learning techniques to relate semantic code clones (White et al., 2016; Saini et al., 2018) or aim to scale clone detection for large code bases (Sajnani et al., 2016).
Both code search and clone detection are only loosely related to our approach since those tools usually do not report the similarity metrics but rather return similar code samples.
7. Conclusion
In this paper, we considered API misuses, namely, the false application of API elements from libraries by developers. In the past several automated misuses detectors were reported. However, many of them have a high false-positive rate.
Thus, we propose ChaRLI with a subsequent distance-based API misuse detector. Its main idea is that developers, who already fixed a misuse, provide the change information of the fix to detect similar kinds of misuses in other code sites or projects. For that purpose, ChaRLI infers so-called change rules from the manually marked fixing commit. These rules describe the edit operations conducted between the misuse and fix version, represented as API usage graphs (AUGs), a data structure developed by Amann et al. (Amann et al., 2019b). With this change rule, our approach conducts a distance-based applicability check and a misuse detection. Particularly, the distances were computed on a vector representation named Exas Vector, suggested by Nguyen et al. (Nguyen et al., 2009a).
We evaluated our approach with three experiments by employing three different data sets, namely, MUBench, AU500, and AndroidCompass. In these experiments, we evaluated different revised distance functions. Our experiments reveal that our revisions have significant positive effects on the relative precision (i.e., the proportion of applicable rules correctly identifying misuses) by achieving values between 77.1 %-96.1 %. This is a major improvement compared to other static misuse detectors. Particularly, we identified that having a strong applicability condition (i.e., low -value) as well as distance functions considering mainly API-specific features (i.e., API-) and the presence of features instead of their frequencies (i.e., Indicator-) have positive effects. Currently, our evaluation only considers the performance of single rules, and thus, only achieves a low recall (i.e., between 0.007 %-17.7 %). Therefore, we currently consider ChaRLI and its distance-based misuse detector as a precise complement to existing API misuse detectors.
In future work, we want to further improve and investigate the applicability of ChaRLI and the distance-based misuse detection.
Improving Recall. To increase the recall we need to employ a larger and more diverse number of applicable rules. This requires a selection and ranking mechanism to decide which rule should be applied for detection. In our experiments, we observed that the distance between the misuse part of the rule and the API usage under test could serve as such a ranking criterion. In further work, we will evaluate whether such a ranking can improve the recall without harming the high precision.
Scaling. ChaRLI and the distance-based misuse detection were designed to scale to large repository storing systems such as GitHub, for instance, as a service for their users. We observed, especially, in the AndroidCompass on AndroidCompass experiment a long runtime. We assume that this is due to the non-optimized implementation, which was mainly designed to check effectiveness (i.e., reducing false-positive rate) rather than improving efficiency. In the future, we want to optimize the vectorization of AUGs and the distance computation by transforming it into matrix operations that can be faster executed on GPUs. For instance, to compute n-paths features of Exas Vector one can perform multiple adjacency matrix multiplications or one can summarize the distance computation of a set of Exas Vectors by applying linear matrix operations.
API Misuse Repair. While we currently only detect misuses, our vision is to also repair them automatically, namely, developing an automated program repair (APR) tool. As recent research has denoted (Kechagia et al., 2021), existing APR tools can not directly be applied to API misuses, and thus specific API misuse repair tools have to be developed. We envision automatically applying the edits described by the change rule to the code at hand to produce patches. One open issue is the validation of these patches. General APR tools usually employ test suites. Since we do not require such test suites, we currently rely on a human validation of the generated patches.
References
- (1)
- Acharya and Xie (2009) Mithun Acharya and Tao Xie. 2009. Mining API Error-Handling Specifications from Source Code. In International Conference on Fundamental Approaches to Software Engineering (FASE). Springer, 370–384. https://doi.org/10.1007/978-3-642-00593-0_25
- Allamanis and Sutton (2014) Miltiadis Allamanis and Charles Sutton. 2014. Mining Idioms from Source Code. In Proceedings of the 22nd International Symposium Foundations of Software Engineering (FSE). ACM, 472–483. https://doi.org/10.1145/2635868.2635901
- Amann (2018) Sven Amann. 2018. A Systematic Approach to Benchmark and Improve Automated Static Detection of Java-API Misuses. Ph.D. Dissertation. Technische Universität Darmstadt. http://tubiblio.ulb.tu-darmstadt.de/106302/
- Amann et al. (2016) Sven Amann, Sarah Nadi, Hoan A. Nguyen, Tien N. Nguyen, and Mira Mezini. 2016. MUBench: A Benchmark for API-Misuse Detectors. In Proceedings of the 13th International Workshop on Mining Software Repositories (MSR). ACM, 464–467. https://doi.org/10.1145/2901739.2903506
- Amann et al. (2019a) Sven Amann, Hoan A. Nguyen, Sarah Nadi, Tien N. Nguyen, and Mira Mezini. 2019a. A Systematic Evaluation of Static API-Misuse Detectors. IEEE Transactions on Software Engineering (TSE) 45, 12 (2019), 1170–1188. https://doi.org/10.1109/TSE.2018.2827384
- Amann et al. (2019b) Sven Amann, Hoan A. Nguyen, Sarah Nadi, Tien N. Nguyen, and Mira Mezini. 2019b. Investigating Next Steps in Static API-Misuse Detection. In Proceedings of the 16th International Workshop on Mining Software Repositories (MSR). IEEE, 265–275. https://doi.org/10.1109/MSR.2019.00053
- Ammons et al. (2002) Glenn Ammons, Rastislav Bodík, and James R. Larus. 2002. Mining Specifications. In Proceedings of the 29th Symposium on Principles of Programming Languages (POPL). ACM, 4–16. https://doi.org/10.1145/503272.503275
- Bader et al. (2019) Johannes Bader, Andrew Scott, Michael Pradel, and Satish Chandra. 2019. Getafix: Learning to Fix Bugs Automatically. Proceedings of the ACM on Programming Languages 3, OOPSLA, Article 159 (2019), 27 pages. https://doi.org/10.1145/3360585
- Blackburn et al. (2006) Stephen M. Blackburn, Robin Garner, Chris Hoffmann, Asjad M. Khang, Kathryn S. McKinley, Rotem Bentzur, Amer Diwan, Daniel Feinberg, Daniel Frampton, Samuel Z. Guyer, Martin Hirzel, Antony Hosking, Maria Jump, Han Lee, J. Eliot B. Moss, Aashish Phansalkar, Darko Stefanović, Thomas VanDrunen, Daniel von Dincklage, and Ben Wiedermann. 2006. The DaCapo Benchmarks: Java Benchmarking Development and Analysis. In Proceedings of the 21st Conference on Object-Oriented Programming, Systems, Languages and Applications (OOPSLA). ACM, 169–190. https://doi.org/10.1145/1167473.1167488
- Blumenthal and Gamper (2018) David B. Blumenthal and Johann Gamper. 2018. On the Exact Computation of the Graph Edit Distance. Elsevier Pattern Recognition Letters 134 (2018), 46–57. https://doi.org/10.1016/j.patrec.2018.05.002
- Cohen (1960) Jacob Cohen. 1960. A Coefficient of Agreement for Nominal Scales. Educational and Psychological Measurement 20, 1 (1960), 37–46. https://doi.org/10.1177/001316446002000104
- Durieux et al. (2019) Thomas Durieux, Fernanda Madeiral, Matias Martinez, and Rui Abreu. 2019. Empirical Review of Java Program Repair Tools: A Large-Scale Experiment on 2,141 Bugs and 23,551 Repair Attempts. In Joint European Software Engineering Conference and Symposium on the Foundations of Software Engineering (ESEC/FSE). ACM, 302–313. https://doi.org/10.1145/3338906.3338911
- Ernst et al. (2001) Michael. D. Ernst, Jake Cockrell, William. G. Griswold, and David Notkin. 2001. Dynamically Discovering Likely Program Invariants to Support Program Evolution. IEEE Transactions on Software Engineering (TSE) 27, 2 (2001), 99–123. https://doi.org/10.1109/32.908957
- Gabel and Su (2010) Mark Gabel and Zhendong Su. 2010. Online Inference and Enforcement of Temporal Properties. In Proceedings of the 32nd International Conference on Software Engineering (ICSE). ACM, 15–24. https://doi.org/10.1145/1806799.1806806
- Gu et al. (2018) Xiaodong Gu, Hongyu Zhang, and Sunghun Kim. 2018. Deep Code Search. In Proceedings of the 40th International Conference on Software Engineering (ICSE). IEEE, 933–944. https://doi.org/10.1145/3180155.3180167
- Hogarty and Kromrey (1999) Kristine Y Hogarty and Jeffrey D Kromrey. 1999. Using SAS to calculate tests of Cliff’s Delta. In Proceedings of the SAS Users’ Group Int (SUGI). 1389–1393.
- Holmes and Murphy (2005) Reid Holmes and Gail C. Murphy. 2005. Using Structural Context to Recommend Source Code Examples. In Proceedings of the 27th International Conference on Software Engineering (ICSE). ACM, 117–125. https://doi.org/10.1145/1062455.1062491
- Hsu (1975) Harry T. Hsu. 1975. An Algorithm for Finding a Minimal Equivalent Graph of a Digraph. Journal of the ACM 22, 1 (1975), 11–16. https://doi.org/10.1145/321864.321866
- Imtiaz et al. (2019a) Nasif Imtiaz, Brendan Murphy, and Laurie Williams. 2019a. How Do Developers Act on Static Analysis Alerts? An Empirical Study of Coverity Usage. In International Symposium on Software Reliability Engineering (ISSRE). IEEE, 323–333. https://doi.org/10.1109/issre.2019.00040
- Imtiaz et al. (2019b) Nasif Imtiaz, Akond Rahman, Effat Farhana, and Laurie Williams. 2019b. Challenges with Responding to Static Analysis Tool Alerts. In International Coference on Mining Software Repositories (MSR). IEEE, 245–249. https://doi.org/10.1109/msr.2019.00049
- Jiang et al. (2007) Lingxiao Jiang, Ghassan Misherghi, Zhendong Su, and Stephane Glondu. 2007. DECKARD: Scalable and Accurate Tree-Based Detection of Code Clones. In Proceedings of the 29th International Conference on Software Engineering (ICSE). IEEE, 96–105. https://doi.org/10.1109/ICSE.2007.30
- Kang and Lo (2021) Hong Jin Kang and David Lo. 2021. Active Learning of Discriminative Subgraph Patterns for API Misuse Detection. IEEE Transactions on Software Engineering (TSE) (2021), 1–1. https://doi.org/10.1109/TSE.2021.3069978
- Kechagia et al. (2021) Maria Kechagia, Sergey Mechtaev, Federica Sarro, and Mark Harman. 2021. Evaluating Automatic Program Repair Capabilities to Repair API Misuses. IEEE Transactions on Software Engineering (TSE) (2021), 1–1. https://doi.org/10.1109/TSE.2021.3067156
- Kim and Kim (2019) Jindae Kim and Sunghun Kim. 2019. Automatic patch generation with context-based change application. Springer Empirical Software Engineering (EMSE) 24, 6 (2019), 4071–4106. https://doi.org/10.1007/s10664-019-09742-5
- Kim et al. (2010) Jinhan Kim, Sanghoon Lee, Seung-won Hwang, and Sunghun Kim. 2010. Towards an Intelligent Code Search Engine. In Proceedings of the 24th AAAI Conference on Artificial Intelligence (AAAI). 1358–1363. https://www.aaai.org/ocs/index.php/AAAI/AAAI10/paper/download/1691/2212
- Kitchenham et al. (2017) Barbara A Kitchenham, Lech Madeyski, David Budgen, Jacky Keung, Pearl Brereton, Stuart M Charters, Shirley Gibbs, and Amnart Pohthong. 2017. Robust Statistical Methods for Empirical Software Engineering. Springer Empirical Software Engineering (EMSE) 22, 2 (2017), 579–630. https://doi.org/10.1007/s10664-016-9437-5
- Koschke (2007) Rainer Koschke. 2007. Survey of Research on Software Clones. In Dagstuhl Seminar Proceedings: Duplication, Redundancy, and Similarity in Software (Dagstuhl Seminar Proceedings, 06301), Rainer Koschke, Ettore Merlo, and Andrew Walenstein (Eds.). Internationales Begegnungs- und Forschungszentrum für Informatik (IBFI), Schloss Dagstuhl, Germany, Dagstuhl, Germany. http://drops.dagstuhl.de/opus/volltexte/2007/962
- Koyuncu et al. (2020) Anil Koyuncu, Kui Liu, Tegawendé F Bissyandé, Dongsun Kim, Jacques Klein, Martin Monperrus, and Yves Le Traon. 2020. Fixminer: Mining relevant fix patterns for automated program repair. Springer Empirical Software Engineering (EMSE) 25, 3 (2020), 1980–2024. https://doi.org/10.1007/s10664-019-09780-z
- Landis and Koch (1977) J. Richard Landis and Gary G. Koch. 1977. The Measurement of Observer Agreement for Categorical Data. Biometrics 33, 1 (1977), 159–174. https://doi.org/10.2307/2529310
- Le et al. (2016) Xuan Bach D. Le, David Lo, and Claire Le Goues. 2016. History Driven Program Repair. In Proceedings of the 23rd International Conference on Software Analysis, Evolution, and Reengineering (SANER), Vol. 1. IEEE, 213–224. https://doi.org/10.1109/SANER.2016.76
- Le Goues and Weimer (2012) Claire Le Goues and Westley Weimer. 2012. Measuring Code Quality to Improve Specification Mining. IEEE Transactions on Software Engineering (TSE) 38, 1 (2012), 175–190. https://doi.org/10.1109/TSE.2011.5
- Lemos et al. (2007) Otávio Augusto Lazzarini Lemos, Sushil Krishna Bajracharya, Joel Ossher, Ricardo Santos Morla, Paulo Cesar Masiero, Pierre Baldi, and Cristina Videira Lopes. 2007. CodeGenie: Using Test-Cases to Search and Reuse Source Code. In Proceedings of the 22nd International Conference on Automated Software Engineering (ASE). ACM, 525–526. https://doi.org/10.1145/1321631.1321726
- Li et al. (2020) Yi Li, Shaohua Wang, and Tien N. Nguyen. 2020. DLFix: Context-Based Code Transformation Learning for Automated Program Repair. In Proceedings of the 42nd International Conference on Software Engineering (ICSE). ACM, 602–614. https://doi.org/10.1145/3377811.3380345
- Li and Zhou (2005) Zhenmin Li and Yuanyuan Zhou. 2005. PR-Miner: Automatically Extracting Implicit Programming Rules and Detecting Violations in Large Software Code. ACM SIGSOFT Software Engineering Notes (SEN) 30, 5 (2005), 306–315. https://doi.org/10.1145/1095430.1081755
- Liu et al. (2021) Kui Liu, Dongsun Kim, Tegawendé F. Bissyandé, Shin Yoo, and Yves Le Traon. 2021. Mining Fix Patterns for FindBugs Violations. IEEE Transactions on Software Engineering (TSE) 47, 1 (2021), 165–188. https://doi.org/10.1109/TSE.2018.2884955
- Liu and Zhong (2018) Xuliang Liu and Hao Zhong. 2018. Mining StackOverflow for Program Repair. In International Conference on Software Analysis, Evolution, and Reengineering (SANER). IEEE, 118–129. https://doi.org/10.1109/saner.2018.8330202
- Monperrus (2018) Martin Monperrus. 2018. Automatic Software Repair: A Bibliography. ACM Computing Surveys 51, 1 (2018), 17:1–24. https://doi.org/10.1145/3105906
- Monperrus et al. (2010) Martin Monperrus, Marcel Bruch, and Mira Mezini. 2010. Detecting Missing Method Calls in Object-Oriented Software. In Proceedings of the 24th European Conference on Object-Oriented Programming (ECOOP). Springer, 2–25. https://doi.org/10.1007/978-3-642-14107-2_2
- Munkres (1957) James Munkres. 1957. Algorithms for the Assignment and Transportation Problems. Journal of the Society for Industrial and Applied Mathematics 5, 1 (1957), 32–38. https://www.jstor.org/stable/2098689
- Murali et al. (2017) Vijayaraghavan Murali, Swarat Chaudhuri, and Chris Jermaine. 2017. Bayesian Specification Learning for Finding API Usage Errors. In Proceedings of the11th Joint Meeting of the European Software Engineering Conference/Foundations of Software Engineering (ESEC/FSE). ACM, 151–162. https://doi.org/10.1145/3106237.3106284
- Nadi et al. (2016) Sarah Nadi, Stefan Krüger, Mira Mezini, and Eric Bodden. 2016. Jumping through Hoops: Why Do Java Developers Struggle with Cryptography APIs?. In Proceedings of the 38th International Conference on Software Engineering (ICSE). ACM, 935–946. https://doi.org/10.1145/2884781.2884790
- Nguyen and Khoo (2011) Anh Cuong Nguyen and Siau-Cheng Khoo. 2011. Extracting Significant Specifications from Mining through Mutation Testing. In Proceedings of the 13th International Conference on Formal Engineering Methods (ICFEM). Springer, 472–488. https://doi.org/10.1007/978-3-642-24559-6_32
- Nguyen et al. (2009a) Hoan Anh Nguyen, Tung Thanh Nguyen, Nam H. Pham, Jafar M. Al-Kofahi, and Tien N. Nguyen. 2009a. Accurate and Efficient Structural Characteristic Feature Extraction for Clone Detection. In Proceedings of the 12th International Conference on Fundamental Approaches to Software Engineering (FASE). Springer, 440–455. https://doi.org/10.1007/978-3-642-00593-0_31
- Nguyen et al. (2020) Tam Nguyen, Phong Vu, and Tung Nguyen. 2020. Code Recommendation for Exception Handling. In Proceedings of the 28th Joint Meeting of the European Software Engineering Conference/Foundations of Software Engineering (ESEC/FSE). ACM, 1027–1038. https://doi.org/10.1145/3368089.3409690
- Nguyen et al. (2009b) Tung Thanh Nguyen, Hoan Anh Nguyen, Nam H. Pham, Jafar M. Al-Kofahi, and Tien N. Nguyen. 2009b. Graph-Based Mining of Multiple Object Usage Patterns. In Proceedings of the 7th Joint Meeting of the European Software Engineering Conference/Foundations of Software Engineering (ESEC/FSE). ACM, 383–392. https://doi.org/10.1145/1595696.1595767
- Nielebock et al. (2021a) Sebastian Nielebock, Paul Blockhaus, Jacob Krüger, and Frank Ortmeier. 2021a. An Experimental Analysis of Graph-Distance Algorithms for Comparing API Usages. In Proceedings of the 21st International Working Conference on Source Code Analysis and Manipulation (SCAM) - RENE Track. IEEE, 214–225. https://doi.org/10.1109/SCAM52516.2021.00034
- Nielebock et al. (2021b) Sebastian Nielebock, Paul Blockhaus, Jacob Krüger, and Frank Ortmeier. 2021b. AndroidCompass: A Dataset of Android Compatibility Checks in Code Repositories. In Proceedings of the 18th International Workshop on Mining Software Repositories (MSR). IEEE, 535–539. https://doi.org/10.1109/MSR52588.2021.00069
- Nielebock et al. (2020) Sebastian Nielebock, Robert Heumüller, Jacob Krüger, and Frank Ortmeier. 2020. Cooperative API Misuse Detection Using Correction Rules. In Proceedings of the 42nd International Conference on Software Engineering - New Ideas and Emerging Results (ICSE-NIER). ACM, 73–76. https://doi.org/10.1145/3377816.3381735
- Nielebock et al. (2021c) Sebastian Nielebock, Robert Heumüller, Kevin Michael Schott, and Frank Ortmeier. 2021c. Guided Pattern Mining for API Misuse Detection by Change-Based Code Analysis. Springer Automated Software Engineering (ASEJ) 28, 15 (2021), 1–48. https://doi.org/10.1007/s10515-021-00294-x
- Oliveira et al. (2018) Daniela Seabra Oliveira, Tian Lin, Muhammad Sajidur Rahman, Rad Akefirad, Donovan Ellis, Eliany Perez, Rahul Bobhate, Lois A. DeLong, Justin Cappos, and Yuriy Brun. 2018. API Blindspots: Why Experienced Developers Write Vulnerable Code. In Proceedings of the 14th Symposium on Usable Privacy and Security (SOUPS). USENIX Association, 315–328. https://www.usenix.org/conference/soups2018/presentation/oliveira
- Paul and Prakash (1994) Santanu Paul and Atul Prakash. 1994. A Framework for Source Code Search using Program Patterns. IEEE Transactions on Software Engineering (TSE) 20, 6 (1994), 463–475. https://doi.org/10.1109/32.295894
- Pradel and Gross (2012) Michael Pradel and Thomas R. Gross. 2012. Leveraging test generation and specification mining for automated bug detection without false positives. In Proceedings of the 34th International Conference on Software Engineering (ICSE). IEEE, 288–298. https://doi.org/10.1109/ICSE.2012.6227185
- Pradel et al. (2012) Michael Pradel, Ciera Jaspan, Jonathan Aldrich, and Thomas R. Gross. 2012. Statically checking API protocol conformance with mined multi-object specifications. In Proceedings of the 34th International Conference on Software Engineering (ICSE). IEEE, 925–935. https://doi.org/10.1109/ICSE.2012.6227127
- Reiss (2009) Steven P Reiss. 2009. Semantics-Based Code Search. In Proceedings of the 31st International Conference on Software Engineering (ICSE). IEEE, 243–253. https://doi.org/10.1109/ICSE.2009.5070525
- Ren et al. (2020) Xiaoxue Ren, Xinyuan Ye, Zhenchang Xing, Xin Xia, Xiwei Xu, Liming Zhu, and Jianling Sun. 2020. API-Misuse Detection Driven by Fine-Grained API-Constraint Knowledge Graph. In Proceedings of the 35th International Conference on Automated Software Engineering (ASE). ACM, 461–472. https://doi.org/10.1145/3324884.3416551
- Roy et al. (2009) Chanchal K Roy, James R Cordy, and Rainer Koschke. 2009. Comparison and Evaluation of Code Clone Detection Techniques and Tools: A Qualitative Approach. Elsevier Science of Computer Programming (SCP) 74, 7 (2009), 470–495. https://doi.org/10.1016/j.scico.2009.02.007
- Sahavechaphan and Claypool (2006) Naiyana Sahavechaphan and Kajal Claypool. 2006. XSnippet: Mining For Sample Code. In Proceedings of the 21st Conference on Object-Oriented Programming, Systems, Languages and Applications (OOPSLA). ACM, 413–430. https://doi.org/10.1145/1167473.1167508
- Saini et al. (2018) Vaibhav Saini, Farima Farmahinifarahani, Yadong Lu, Pierre Baldi, and Cristina V. Lopes. 2018. Oreo: Detection of Clones in the Twilight Zone. In Proceedings of the 26th Joint Meeting of the European Software Engineering Conference/Foundations of Software Engineering (ESEC/FSE). ACM, 354–365. https://doi.org/10.1145/3236024.3236026
- Sajnani et al. (2016) Hitesh Sajnani, Vaibhav Saini, Jeffrey Svajlenko, Chanchal K Roy, and Cristina V Lopes. 2016. SourcererCC: Scaling Code Clone Detection to Big-Code. In Proceedings of the 38th International Conference on Software Engineering (ICSE). IEEE, 1157–1168. https://doi.org/10.1145/2884781.2884877
- Stolee et al. (2014) Kathryn T. Stolee, Sebastian Elbaum, and Daniel Dobos. 2014. Solving the Search for Source Code. ACM Transactions on Software Engineering and Methodology (TOSEM) 23, 3, Article 26 (2014), 45 pages. https://doi.org/10.1145/2581377
- Tan and Li (2020) Shin H. Tan and Ziqiang Li. 2020. Collaborative Bug Finding for Android Apps. In Proceedings of the 42nd International Conference on Software Engineering (ICSE). ACM, 1335–1347. https://doi.org/10.1145/3377811.3380349
- Thummalapenta and Xie (2009a) Suresh Thummalapenta and Tao Xie. 2009a. Alattin: Mining Alternative Patterns for Detecting Neglected Conditions. In Proceedings of the 24th International Conference on Automated Software Engineering (ASE). IEEE, 283–294. https://doi.org/10.1109/ASE.2009.72
- Thummalapenta and Xie (2009b) Suresh Thummalapenta and Tao Xie. 2009b. Mining exception-handling rules as sequence association rules. In Proceedings of the 31st International Conference on Software Engineering (ICSE). IEEE, 496–506. https://doi.org/10.1109/ICSE.2009.5070548
- Tufano et al. (2019) Michele Tufano, Cody Watson, Gabriele Bavota, Massimiliano Di Penta, Martin White, and Denys Poshyvanyk. 2019. An Empirical Study on Learning Bug-Fixing Patches in the Wild via Neural Machine Translation. ACM Transactions on Software Engineering and Methodology (TOSEM) 28, 4, Article 19 (2019), 29 pages. https://doi.org/10.1145/3340544
- Wasylkowski and Zeller (2011) Andrzej Wasylkowski and Andreas Zeller. 2011. Mining temporal specifications from object usage. Springer Automated Software Engineering (ASEJ) 18, 3 (2011), 263–292. https://doi.org/10.1007/s10515-011-0084-1
- Wasylkowski et al. (2007) Andrzej Wasylkowski, Andreas Zeller, and Christian Lindig. 2007. Detecting Object Usage Anomalies. In Proceedings of the 6th Joint Meeting of the European Software Engineering Conference/Foundations of Software Engineering (ESEC/FSE). ACM, 35–44. https://doi.org/10.1145/1287624.1287632
- Weimer and Necula (2005) Westley Weimer and George C. Necula. 2005. Mining Temporal Specifications for Error Detection. In Proceedings of the 11th International Conference on Tools and Algorithms for the Construction and Analysis of Systems (TACAS). Springer, 461–476. https://doi.org/10.1007/978-3-540-31980-1_30
- Wen et al. (2021) Ming Wen, Junjie Chen, Yongqiang Tian, Rongxin Wu, Dan Hao, Shi Han, and Shing-Chi Cheung. 2021. Historical Spectrum Based Fault Localization. ACM Transactions on Software Engineering and Methodology (TOSEM) 47, 11 (2021), 2348–2368. https://doi.org/10.1109/TSE.2019.2948158
- White et al. (2016) Martin White, Michele Tufano, Christopher Vendome, and Denys Poshyvanyk. 2016. Deep Learning Code Fragments for Code Clone Detection. In Proceedings of the 31st International Conference on Automated Software Engineering (ASE). ACM, 87–98. https://doi.org/10.1145/2970276.2970326
- Wohlin et al. (2012) Claes Wohlin, Per Runeson, Martin Höst, Magnus C. Ohlsson, Björn Regnell, and Anders Wesslén. 2012. Experimentation in Software Engineering. Number 1. Springer. https://doi.org/10.1007/978-3-642-29044-2
- Xin and Reiss (2017) Qi Xin and Steven P. Reiss. 2017. Leveraging syntax-related code for automated program repair. In Proceedings of the 32nd International Conference on Automated Software Engineering (ASE). IEEE, 660–670. https://doi.org/10.1109/ASE.2017.8115676
- Zhong and Su (2015) Hao Zhong and Zhendong Su. 2015. An Empirical Study on Real Bug Fixes. In Proceedings of the 37th International Conference on Software Engineering (ICSE), Vol. 1. IEEE, 913–923. https://doi.org/10.1109/ICSE.2015.101
- Zhong et al. (2009) Hao Zhong, Tao Xie, Lu Zhang, Jian Pei, and Hong Mei. 2009. MAPO: Mining and Recommending API Usage Patterns. In Proceedings of the 23rd European Conference on Object-Oriented Programming (ECOOP). Springer, 318–343. https://doi.org/10.1007/978-3-642-03013-0_15