Limits on X-ray Polarization at the Core of Centaurus A as Observed with the Imaging X-ray Polarimetry Explorer
Abstract
We present measurements of the polarization of X-rays in the band from the nucleus of the radio galaxy Centaurus A (Cen A), using a 100 ks observation from the Imaging X-ray Polarimetry Explorer (IXPE ). Nearly simultaneous observations of Cen A were also taken with the Swift, NuSTAR, and INTEGRAL observatories. No statistically significant degree of polarization is detected with IXPE. These observations have a minimum detectable polarization at confidence (MDP99) of using a weighted, spectral model-independent calculation in the band. The polarization angle is consequently unconstrained. Spectral fitting across three orders of magnitude in X-ray energy () demonstrates that the SED of Cen A is well described by a simple power law with moderate intrinsic absorption () and a Fe K emission line, although a second unabsorbed power law is required to account for the observed spectrum at energies below . This spectrum suggests that the reprocessing material responsible for this emission line is optically thin and distant from the central black hole. Our upper limits on the X-ray polarization are consistent with the predictions of Compton scattering, although the specific seed photon population responsible for production of the X-rays cannot be identified. The low polarization degree, variability in the core emission, and the relative lack of variability in the Fe K emission line support a picture where electrons are accelerated in a region of highly disordered magnetic fields surrounding the innermost jet.
1 Introduction
Particle acceleration is ubiquitous in astrophysical systems, with charged particles routinely being accelerated to energies orders of magnitude larger than those attainable in terrestrial experiments. Supermassive black holes () at the centers of galaxies are known to be among the most prominent particle acceleration sites in the universe, although details of the acceleration and radiative mechanisms in active galactic nuclei (AGN) remain ambiguous: multiple models of these processes can fit the spectral energy distributions (SEDs) of AGN equally well. Polarimetry, which more directly constrains the magnetic field geometry of the regions where acceleration takes place, is able to break many of these degeneracies. Polarization measurements of high-energy, non-thermal emission provide an additional means to determine the radiative processes and the nature of the populations of energetic particles that produce them.
Centaurus A is the most nearby radio galaxy (), and the radio jets in its nucleus have been studied in great detail. Radio observations of the core of Cen A indicate complex velocity and polarization structures. Long-term observations of Cen A with Very Long Baseline Interferometry (VLBI, Tingay et al., 2001; Müller et al., 2014) suggest that within the central the jets have an apparent velocity (normalized to the speed of light) of , with a jet viewing angle of with respect to the line of sight. On larger scales of , Hardcastle et al. (2003) measured apparent velocities of . Cen A has also recently been resolved on an angular scale of arcsec at a wavelength of 1.3 mm with the Event Horizon Telescope (EHT, Janssen et al., 2021). These observations reveal both an edge-brightened jet northeast of the core and a fainter counter-jet to the southwest. The surface brightness structure of these jets is interpreted in Janssen et al. (2021) as evidence for a helical magnetic field wrapped around the jets. The jet and counter-jet each have two branches that are clearly separated from one another. For the jet these two branches have position angles of and (measured eastward from north), which is nearly identical to the jet position angle on larger scales (55∘ 7∘; e.g. Schreier et al., 1979; Burns et al., 1983; Jones et al., 1996). X-ray observations of the nucleus of Cen A with Chandra and XMM-Newton show that the X-rays are mainly generated within a small region around the nucleus, as the core has previously been measured to vary in luminosity by on time scales of days (Evans et al., 2004). A distance of 20 light-days () corresponds to an angular scale of at the distance of Cen A, far smaller than the best angular resolution provided by Chandra () for X-ray imaging, but well matched to the resolution of the EHT radio observations. The position angle of the inner radio jet can therefore be compared with the electric-vector position angle (EVPA, itself perpendicular to the local magnetic field) of Cen A.
Measurements of radio polarization by Burns et al. (1983) at show that the polarization degree varies between in different regions in the vicinity of the nucleus, although the nucleus itself is only polarized at the level. The core region of Cen A was measured to have a polarization of at in the same study. The morphology of the polarization vectors throughout the larger scale () jet regions suggests that the magnetic field lines are consistently parallel to the jet axis, with no evidence of field lines transverse to the jet near its outer edges (Clarke et al., 1986; Hardcastle et al., 2003). More recent ALMA results find that the core of Cen A has no measurable polarization at 221 GHz (Goddi et al., 2021), with a upper limit to the linear polarization of . Far-infrared polarimetry with SOFIA/HAWC+ (89 m) measured a polarization of 0.2% with an EVPA of , consistent with dichroic absorption and emission (Lopez-Rodriguez, 2021). After correction for the stellar component of the host galaxy, the core of Cen A was previously observed to have a polarization degree of at a wavelength of m (Capetti et al., 2000), with an EVPA of east of north, which is perpendicular to the jet position angle.
Past observations have shown that the X-ray spectrum is affected by absorption below , with a column density of . At hard X-rays the continuum photon flux is characterized by a power law with slope (e.g. Fürst et al., 2016, and references therein). The presence of a narrow Fe K emission line, combined with the absence of a strong Compton hump, suggests reflection from Compton-thin material. The detection of a high energy cut-off or continuum curvature, from hard X-ray satellites such as CGRO/OSSE, Suzaku, INTEGRAL, and NuSTAR (Kinzer et al., 1995; Steinle et al., 1998; Markowitz et al., 2007; Beckmann et al., 2011; Fürst et al., 2016), is under debate, which prevents an unambiguous determination of the origin of the primary X-ray emission. It could be dominated either by thermal Compton emission from a hot X-ray “corona”, as in radio-quiet AGN (Stern et al., 1995; Zdziarski et al., 1997, 2000), or by non-thermal emission from the base of the jet, or a combination of the two.
Here we report polarimetric observations of Cen A obtained with the Imaging X-ray Polarimetry Explorer (IXPE), a NASA mission in partnership with the Italian Space Agency (ASI). As described in detail elsewhere (Weisskopf et al. (2022) and references therein), IXPE includes three identical X-ray telescopes, each comprising an X-ray mirror assembly and a polarization-sensitive pixelated detector (Soffitta et al., 2021), to provide imaging polarimetry over a nominal band. IXPE data telemetered to ground stations in Malindi (primary) and in Singapore (secondary) are transmitted to the Mission Operations Center (MOC, at the Laboratory for Atmospheric and Space Physics, University of Colorado) and then to the Science Operations Center (SOC, at NASA Marshall Space Flight Center). The SOC processes science and relevant engineering and ancillary data, to produce data products that are archived at the High-Energy Astrophysics Science Archive Research Center (HEASARC, at NASA Goddard Space Flight Center), for use by the international astrophysics community. Cen A was observed for a net exposure time of , from 2022 February 15 (01:00 UT) to 17 (13:00 UT).
In addition to the IXPE observations, Cen A was also observed simultaneously (or nearly simultaneously) by the NuSTAR, Swift, and INTEGRAL missions in order to provide broad-band (0.3–400 keV) measurements of the X-ray spectrum.
2 Observations
IXPE observations of Cen A were taken starting at 00:00 UTC on 2022 February 15. Simultaneous (or nearly so) observations with other X-ray telescopes are summarized in Table 1. Operational constraints limited the ability of NuSTAR and Swift to observe Cen A simultaneously with IXPE. Given that Cen A has not been previously observed to exhibit substantial variability in the X-rays on timescales of days, we do not anticipate this offset in time to introduce any major systematic errors in our joint spectral analysis. The light curve during each of these observations also show no evidence for significant intra-observation variability in the emission from Cen A.
| Mission | Obs ID | Energy | Start date | End date | Exposure |
|---|---|---|---|---|---|
| (YYYY-MM-DD) | (YYYY-MM-DD) | (ks) | |||
| IXPE | 01004301 | 2022-02-15 | 2022-02-17 | ||
| NuSTAR | 60701033002 | 2022-02-17 | 2022-02-17 | ||
| NuSTAR | 10802601002 | 2022-02-18 | 2022-02-18 | ||
| Swift | 00096451017 | 2022-02-24 | 2022-02-25 | ||
| Swift | 00096451018 | 2022-02-25 | 2022-02-25 | ||
| INTEGRAL/ISGRI | 2022-02-11 | 2022-02-18 | |||
| INTEGRAL/SPI | 2022-01-11 | 2022-02-18 |
2.1 IXPE
We refer interested readers to Weisskopf et al. (2016, 2022) for a complete description of the hardware deployed upon IXPE and its performance, and here only summarize the most relevant details for this work. IXPE data were processed using a pipeline that applies estimates of the photoelectron emission direction (and hence the polarization), location, and energy of each event after applying corrections for charging effects, detector temperature, and Gas Electron Multiplier (GEM) gain non-uniformity. Spurious modulation is removed using the algorithm of Rankin et al. (2022).
The output of this pipeline processing is an event file for each of the three IXPE Detector Units (DUs) that contains, in addition to the typical information related to spatially resolved X-ray astronomy, the event-by-event Stokes parameters, from which the polarization of the radiation can be derived. In addition to the standard pipeline processing for IXPE data, three additional corrections were applied to the data: small time-dependent changes to the gain correction, obtained from data taken with the on-board calibration sources (Ferrazzoli et al., 2020) close to the actual time of observation; further corrections to the aspect solution to remove apparent positional shifts in sources arising from small motions of the IXPE boom; and the weights of each event, updated to reflect the results of Di Marco et al. (2022) and to fix a known error in the data processing pipeline at the time of processing.
Analysis of the processed IXPE event lists utilizing both weighted and unweighted data was carried out with multiple independent analysis tools, most notably ixpeobssim (Baldini et al., 2022). The ixpeobssim software suite was designed specifically to operate with both simulated and real IXPE data; Baldini et al. (2022) describe these algorithms in detail. For Cen A, the core region was filtered from the rest of the event list by using a radius aperture111This radius corresponds to half-power diameters for the IXPE optics. around the centroid of the X-ray data.
We have attempted to measure the polarization degree and angle and their uncertainties along with the minimum detectable polarization at 99% confidence () of the region using several different techniques in order to test the robustness of the final result. The simplest calculation was performed with a polarization cube, which is constructed using the xpbin tool on the selected event list with the PCUBE algorithm. The polarization properties and their uncertainties were calculated according to the equations contained in Kislat et al. (2015). No treatment of the expected background counts in the source region was performed for this calculation. Estimates derived from multiple source-free regions of the sky using an identical radius aperture suggest that background is of the total counts within the source aperture. We have constructed two polarization cubes from these observations - one that utilizes the event-specific weights and one that does not.
Spectro-polarimetric fitting was also used to determine the polarization degree and angle of the Cen A core. Spectra were extracted using the xpbin tool on the same event list by using the PHA algorithm to create OGIP-compliant spectra for the total (Stokes I) and Stokes parameters. For the spectral extraction, a local source-free circular aperture with a radius of was used to construct background Stokes spectra. Two variants of the 9 IXPE spectra (3 detectors spectra per detector) were produced: one variant that includes the event weights and a second that does not. In this paper all references to spectro-polarimetric fitting will be based on the unweighted spectra. Tests using the weighted spectra have confirmed that both sets of spectra result in upper limits to the polarization, with no meaningful differences between them. We have also confirmed that the best-fit spectral model parameters (including polarization) are not sensitive to the particular choice of background region.
As a further independent check of the polarization measurements, we also utilized a maximum-likelihood calculation of the polarization degree and angle based on the method developed by Marshall (2021) to allow for background selected from a separate region (Marshall, in prep). Background events are accounted for in a manner similar to the calculations in Elsner et al. (2012), although this new calculation explicitly assumes Poisson rather than Gaussian statistics as assumed in Elsner et al. (2012) . These calculations were developed and executed independently of ixpeobssim. The unweighted energy-dependent modulation factor from Di Marco et al. (2022) was used and no events were excluded from the calculation. For this calculation, background was estimated from an annular region 160-320′′ from the core.
2.2 NuSTAR
To calibrate and clean the NuSTAR data, we used the NuSTAR Data Analysis Software (NuSTARDAS, v. 2.1.1). We derived level 2 cleaned event files with the nupipeline task, while high-level scientific data products were extracted using the nuproducts tool. The latest calibration data files in the NuSTAR CALDB (version 20220301) were used. These data have a significantly lower count rate than the data analyzed in Fürst et al. (2016). Our measured count rate for Cen A in the energy band is , which is a factor of lower than the value quoted for the 2013 NuSTAR observation (Fürst et al., 2016). A radius circular region (corresponding to a 90% enclosed energy fraction of the NuSTAR point-spread function) was used to extract the source spectrum222We note that this source aperture is slightly smaller than the radius used for spectral extraction in Fürst et al. (2016), but this discrepancy alone cannot account for the lower count rate we measure.. A concentric annulus with inner and outer radii of and was then adopted to estimate the background, which subtends a solid angle a factor of 2 larger than the radius circle used for the background region in Fürst et al. (2016). FPMA/B spectra were then binned to achieve a S/N ratio larger than 10 in each spectral channel.
2.3 Swift
Swift-XRT observations were performed in Windowed Timing (WT) mode, and the data were processed using the X-Ray Telescope Data Analysis Software (XRTDAS, v. 3.6.1). As for NuSTAR data, we used the latest calibration files available in the Swift/XRT CALDB (version 20210915). The X-ray source spectrum was extracted from the cleaned event file using a circular region with a radius of 20-pixels ( 46 arcsec). This region corresponds to a 90% enclosed energy fraction of the Swift point-spread function. The background was extracted using a circular region of 20-pixel radius from a blank sky WT observation available in the Swift archive. Finally, the 0.3–10 keV source spectra were binned requiring each spectral channel to have at least 25 counts.
2.4 INTEGRAL
The INTEGRAL observations used in these analyses are part of a multi-epoch program. The data reported here consists of exposures that followed a dithering pattern. Data contaminated by solar flares and pointings affected by Earth’s radiation belt have been removed.
The SPI data from 2022 January 11 to February 18 have been processed through the SPIDAI interface333Interface developed at IRAP to analyze SPI data, publicly vailable at http://sigma-2.cesr.fr/integral/spidai; see description in Burke et al. (2014). Cen A was assumed to be the only source in the sky model, and constant during the exposure duration. Due to the evolution of the background over the entire data set, its normalization was determined on a hr timescale. The spectrum was constructed in 21 channels from 20 to 500 keV and averaged over the exposure. Tests comparing the full SPI data set to the SPI spectrum extracted for a time window immediately before and after IXPE observations show no significant differences in count rate for any channel. We therefore choose to utilize data taken throughout this entire time window to maximize the spectrum’s signal-to-noise, especially for the highest energy channels.
The ISGRI data between 2022 February 11-18 were processed using the Off-line Science Analysis 11.2 version (OSA11.2), resulting in a total useful duration of 144.4 ks. The source was considered constant on a s timescale. The spectrum was averaged over the observing period and binned into 29 channels in the 30-1000 keV energy range.
3 Results
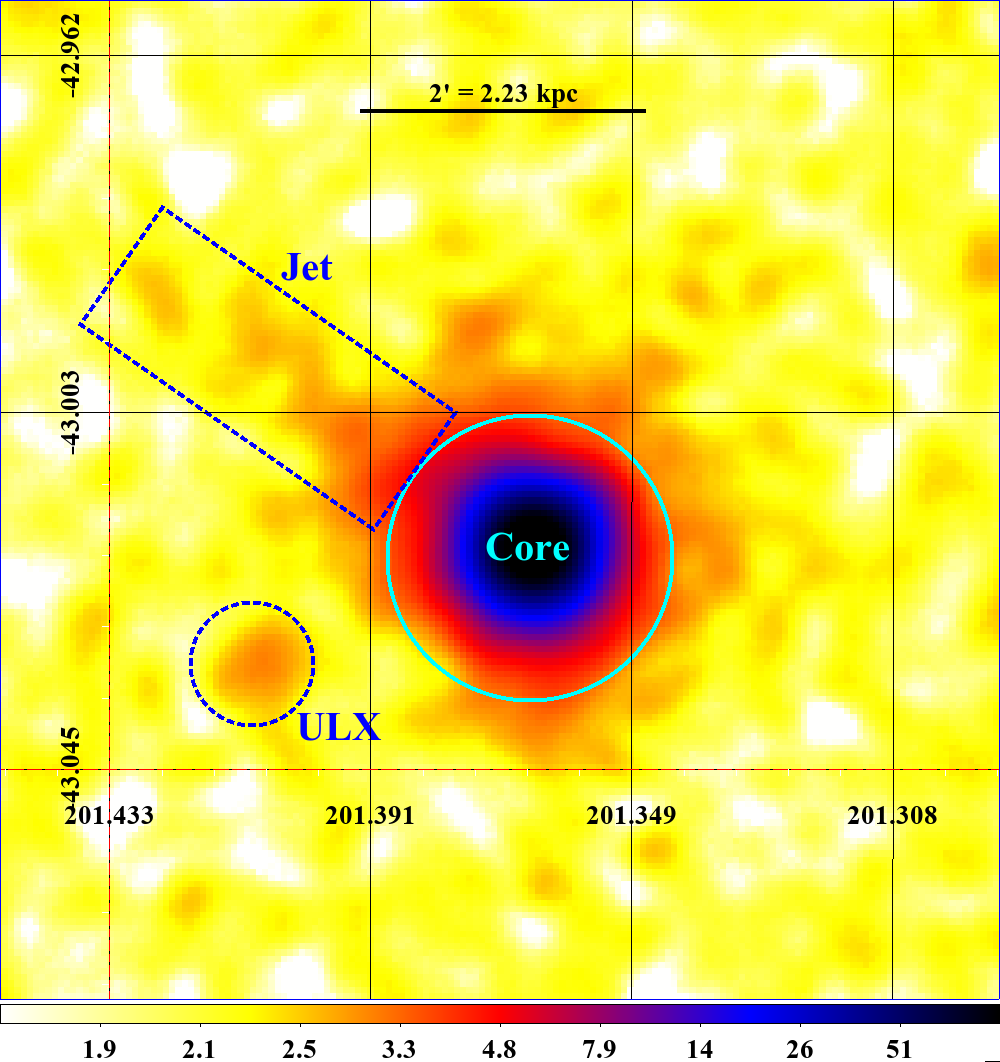
Figure 1 displays the combined image of Cen A resulting from data obtained with all three IXPE detectors. Three regions of interest are shown on this figure: the core, the X-ray jet, and a previously identified ultra-luminous X-ray source (ULX) to the southeast of the core. Between all three detectors, a total of 28179 (source + background) counts were detected in the core region, 2147 in the jet, and 469 in the vicinity of the ULX. This work will focus on the core region but briefly discuss upper limits to X-ray polarization in the other two regions as well.
3.1 Polarization
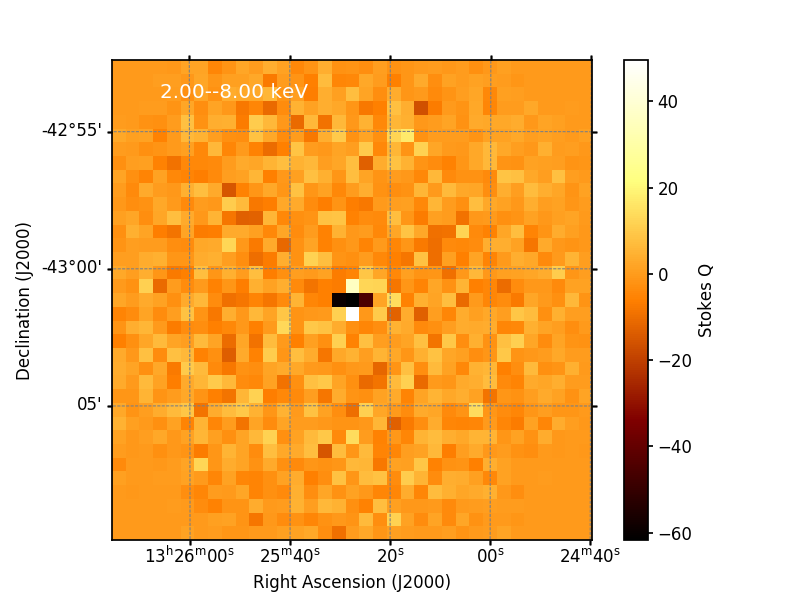
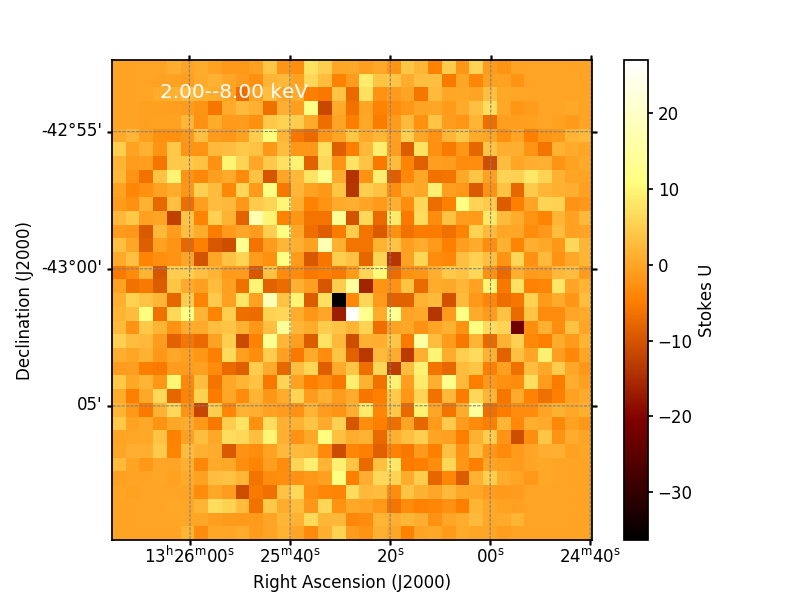
Figure 2 presents the Stokes and maps of the IXPE field of view, along with polar plots showing the limits on the broad-band polarization of Cen A’s core. In addition to the core region, two other sources are considered. Neither the X-ray jets and the ultraluminous X-ray source (ULX) near the core of Cen A have sufficient counts to measure statistically significant X-ray polarization. The broad-band polarization of the jet region has an MDP99 of , while MDP for the ULX region. Using the weighted polarization cubes gives MDP99 values of and for the jet and ULX regions, respectively. These values of MDP99 all correspond to the optimistic assumption that all events within these regions originate from the sources and not the background. Given the low signal-to-noise (S/N) ratio of the imaging data, the polarization of these two sources is effectively unconstrained. Using the likelihood base method that accounts for background (see § 2.1) from a region at comparable distance from the core but on the west side of it, the polarization of jet and ULX cannot be established even if they were fully polarized (MDPs are ). Fitting the broad band () polarization data of the Cen A core (without weighting), then combining the data from all three telescopes simultaneously, gives no statistically significant polarization signal above . Incorporating the weights into the calculation provides a stricter limit of . Dividing the IXPE data into smaller energy bins also does not yield any statistically significant polarization in any of the energy bands investigated.


3.2 Spectral Fitting
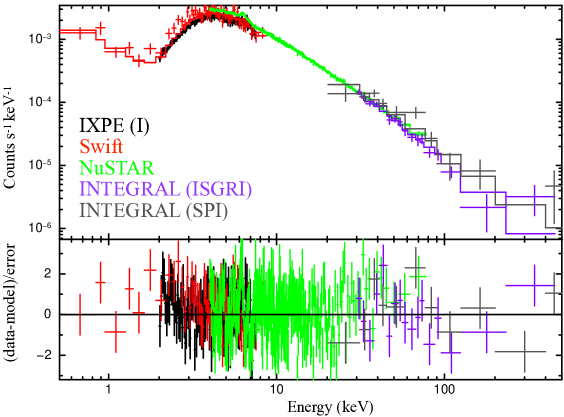
We have modelled the broad-band (0.5–400 keV) Swift + IXPE444For this spectral fit, no polarization information from IXPE was utilized, only the Stokes I parameter spectrum. + NuSTAR + INTEGRAL X-ray spectrum of the core of Cen A with several simple yet physically motivated models. The broad-band emission above 2 keV (the lower-energy bound of the IXPE data) can be well described by a simple power-law continuum plus a Gaussian-shaped Fe K emission line with moderate intrinsic absorption (). There is no apparent evidence of a high-energy cutoff within the INTEGRAL data out to 400 keV. The spectrum below 2 keV shows strong evidence for another spectral component beyond a single intrinsically absorbed power law. The presence of the Fe K line and the absence of a statistically significant Compton hump suggest that the observed spectrum originates in reflection from an optically thin plasma. Unless otherwise noted, all uncertainties correspond to () confidence intervals and all upper limits correspond to () confidence.
Our primary model fit was performed using XSPEC version 12.12.1 (Arnaud, 1996), and assumes an intrinsically absorbed cutoff power law, a second power law with only Galactic absorption, and a Gaussian emission line (const * tbabs * (ztbabs* (zcutoffpl + zgauss) + pow) in XSPEC). We assume zero intrinsic width for the Fe K line and a Galactic absorption column density of (HI4PI Collaboration et al., 2016). Our best-fit photon index for this model is . The best-fit intrinsic absorption column density is , and the cutoff energy is (the hard limit of this parameter in the zcutoffpl model in XSPEC). The cross-calibration constants for the various detectors differ from IXPE Detector Unit 1 by for the other two IXPE detectors, for the NuSTAR FPMA/FPMB spectra, for the Swift XRT spectra, and for the INTEGRAL SPI/ISGRI spectra. The overall fit statistic of this model ( for 1134 degrees of freedom) suggests that this model is a good fit to the data. The resultant model fit and its residuals can be found in Figure 3.
The line energy and flux of the Fe K line are only slightly lower than the NuSTAR-derived values quoted in Fürst et al. (2016). The line energy we measure is (cf. 6.40 keV in Fürst et al., 2016) and the total flux of the line is (c.f. in Fürst et al., 2016). We conclude that the flux of the Fe line has remained constant despite the factor of drop in the overall flux of the Cen A core. The measured Fe K flux is also consistent with results from past observations using other X-ray telescopes (e.g. Grandi et al., 2003; Evans et al., 2004; Markowitz et al., 2007; Fukazawa et al., 2011).
We added the second power-law component to fit the apparent residual counts observed at low energies () when only fitting the data with a single power-law component. The best-fit photon index for this second component is , and its normalization is approximately 2 orders of magnitude lower than the primary component. Compared to a simpler model with only the primary power-law component, including a second power law component reduces the total value of the fit by a highly significant amount ( with two fewer degrees of freedom). Converting this change in into a change in Bayesian Information Criterion () for a model fit with 1150 data points and two additional parameters () gives , strongly favoring the presence of this second power law. The corresponding calculation for the Akaike Information Criterion (AIC) is , again validating the presence of this second power-law component. This component appears to be physically separated from the primary power law, as the data strongly disfavor a model where this second power-law component is subject to same intrinsic absorption as the primary. We also attempted to fit these data to a similar model that replaces the second power law with a thermal apec model. An apec component is well motivated by the observed thermal emission in the vicinity of Cen A that would reside within the Swift point-spread function in projection observed by Chandra (e.g. Kraft et al., 2003). The temperature and metallicity of this thermal component, however, cannot be well constrained by the spectral data. Fixing the temperature to and the metallicity to with a free normalization parameter enables a fit with value statistically indistinguishable from our double power-law model.
As a further test of our spectral analysis, a Borus component (e.g. Baloković et al., 2018, 2019) was included to self-consistently model the neutral Compton reflection and Fe line. In Xspec the model reads as: constant tbabs (atable(borus02_v170323l.fits) + atable(borus02_v170323k.fits) + ztbabs cutoffpl) + pow). The reflector is assumed to have a toroidal geometry and the opening angle is fixed to . The majority of the best-fit spectral parameters are broadly consistent with past measurements of Cen A obtained with NuSTAR (e.g. Fürst et al., 2016). In particular, we find that the Compton reflection can be well explained in terms of scattering off Compton-thin material, with a column density log(. Similar to our simpler model, the BORUS modeling finds no evidence for a high-energy cutoff. At confidence the lower limit to the cutoff energy is , and at confidence.
For both of the spectral model fits described above, the only parameter that strongly disagrees with the results of Fürst et al. (2016) is the normalization of the primary continuum, which is consistently a factor of times lower than that calculated in Fürst et al. (2016). Such flux variations in this energy band are consistent with the factor of variation of the flux observed with the RXTE over a 12.5 year period (Rothschild et al., 2011). As discussed in Fürst et al. (2016), the 2013 observation took place during a time where its flux was higher than the average flux of Cen A measured between 2003 and 2009 with INTEGRAL (Beckmann et al., 2011).
3.3 Spectro-polarimetric Fitting
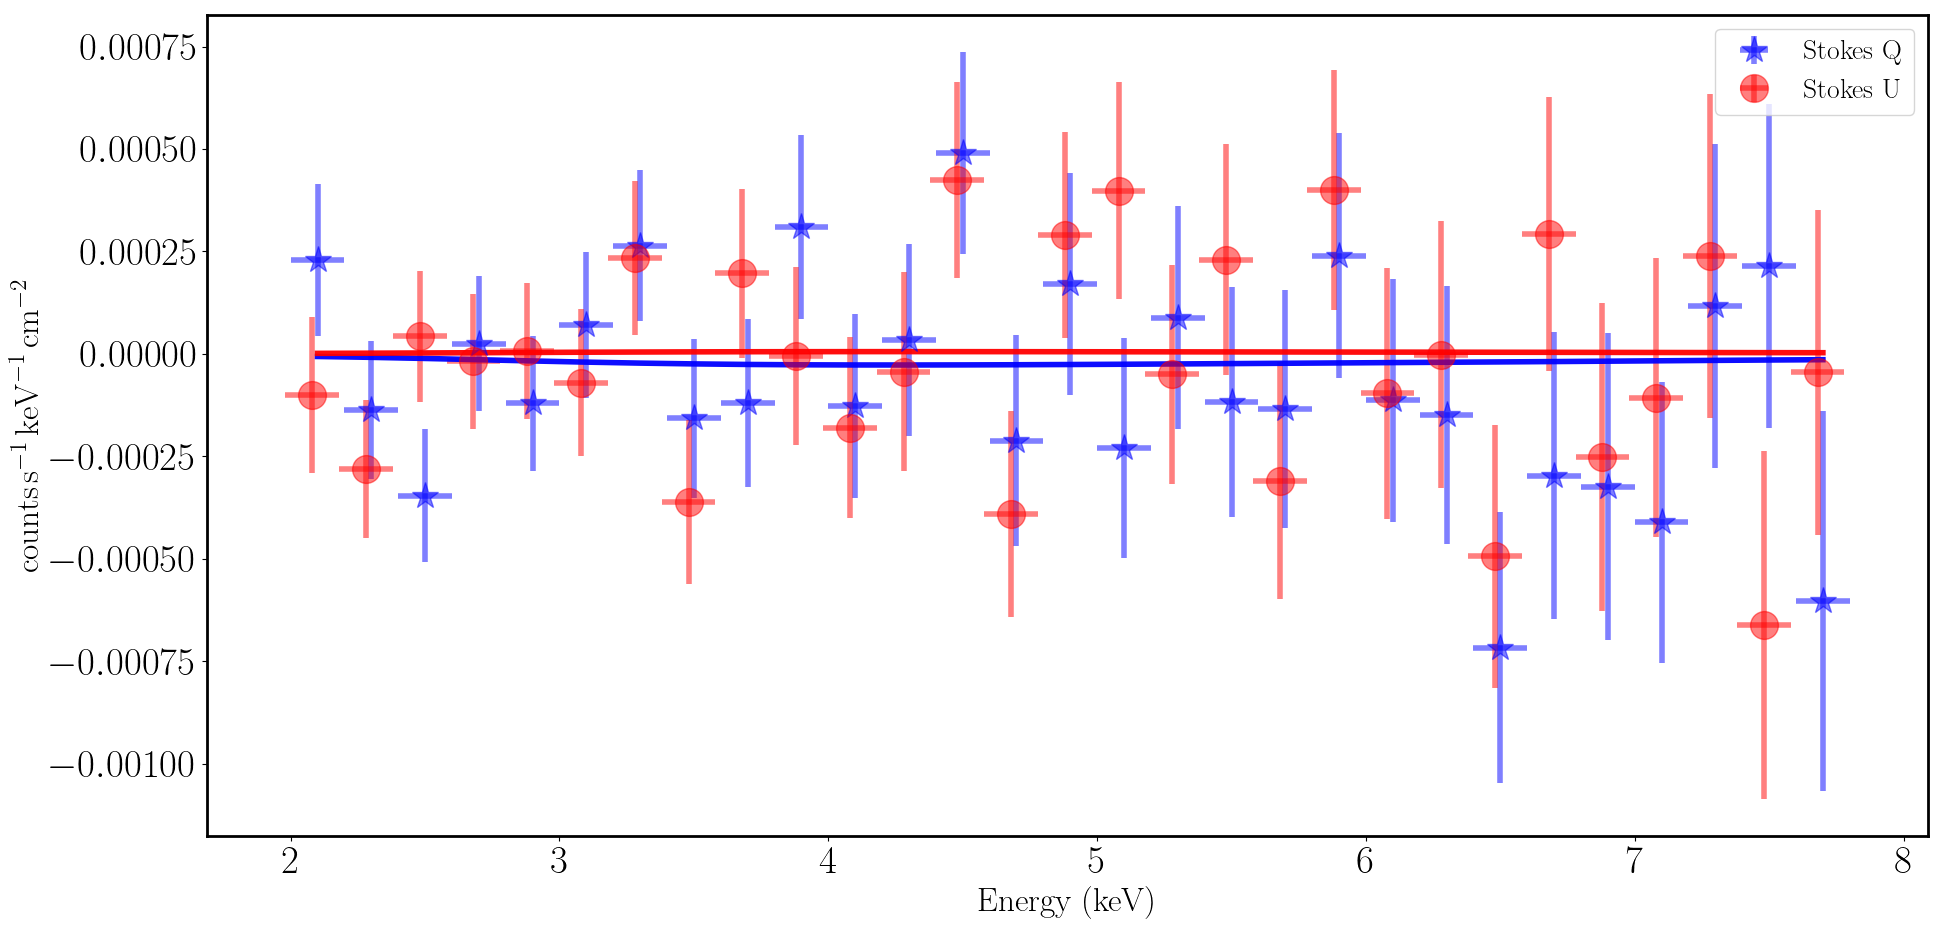
We utilized the combined data from IXPE, NuSTAR, and Swift to perform a joint spectro-polarimetric fit to the Cen A core emission, using a simpler version of our cutoff power-law model. The only modification is that the redshifted cutoff power-law model component is replaced with a simple power law, as there is no ability to constrain the cutoff energy without the INTEGRAL data. The polarization degree and angle are assumed to be constant with energy. In XSPEC this model is written as const tbabs (ztbabs (polconst pow + polconst zgauss) +polconst pow ). As stated above, no weighting was applied to the events when constructing the IXPE , , and spectra. The polarization degrees of the Gaussian component and second power law were fixed to zero, meaning that our upper limits are strictly for the primary power-law component.
We present three versions of the spectral fit: one allowing the polarization angle to be fit as a free parameter, one where the polarization angle is fixed to (parallel to the radio jets), and one where (perpendicular to the radio jets in the relevant XSPEC coordinate system). When the polarization angle is a free parameter, the confidence upper limit on the polarization degree is . Fixing the polarization angles to or results in upper limits of and , respectively. All other fit parameters are statistically consistent with those from the simpler spectral modeling performed above, and the value of the fit (1259 for 1243 degrees of freedom) is in line with expectations for a “good” fit to the data.
3.4 Summary of Results
We present the results of all six of the confidence upper limits on the X-ray polarization of Cen A in Table 2. While all of these upper limits only differ from one another by a few percent, we choose to present the weighted value of MDP99 as the “primary” upper limit for Cen A’s polarization. This choice arises from two facts of the weighted analysis. The first reason is that the value of MDP99 calculated with or without weights is independent of any assumptions or models for the SED. The second reason is that the weights have been designed and tested to increase the relative weight of events with reliable track reconstruction (Di Marco et al., 2022), therefore improving the sensitivity of the observation to polarization. This reduction in MDP99 by using weights is in good agreement with expectations from pre-launch simulations (Baldini et al., 2022).
| Method | Background | Weighting | Limit | |
|---|---|---|---|---|
| PCUBE | None | None | Free | |
| PCUBE | None | N | Free | |
| Likelihood | In Calculation | None | Free | |
| Spectro-polarimetric | Subtracted | None | Free | |
| Spectro-polarimetric | Subtracted | None | ||
| Spectro-polarimetric | Subtracted | None |
4 Discussion
The apparent lack of a Compton hump suggests that the reflection component of the X-ray spectrum in Cen A arises primarily from reflection off an optically thin medium. On the other hand, the absence of any apparent cutoff in the power-law continuum agrees with past observations (e.g., Beckmann et al., 2011; Fürst et al., 2016). This differs from the typical X-ray spectrum of Type 1 AGN (e.g. Zdziarski et al., 1997, 2000; Fabian et al., 2015; Tortosa et al., 2018; Lanzuisi et al., 2019) where a cut-off is generally interpreted as the signature of Compton scattering of seed photons in a thermal corona. Assuming that spectrum is produced by thermal Comptonization, we can estimate the lower limit to the electron temperature from the lower limit on the cutoff energy as measured by INTEGRAL, as keV (e.g. Stern et al., 1995; Petrucci et al., 2001; Middei et al., 2019). At such a high temperature, the Comptonization spectrum would deviate significantly from a single power law (Coppi, 1999). This would suggest that thermal Comptonization is not the dominant process to produce the hard X-rays in Cen A and that non-thermal emission from the jet likely plays an important role. The spectrum extending beyond 511 keV, the rest-mass energy of the electron, would be prone to photon-photon electron-positron pair-production which would affect the shape of the spectrum. Absence of any significant features the spectrum indicates that the source is not compact enough for this effect to play any role (Svensson, 1994), adding further arguments in favor of the jet origin of the spectrum.
Variability of the different spectral components of Cen A between current and past observations (in particular those of Fürst et al., 2016) can provide additional information about the structure of the X-ray emission and central black hole. The lack of variability in the Fe K line (see also e.g. Rothschild et al., 2011), despite the much higher variability in the continuum (e.g. Evans et al., 2004), is indicative of a scenario where the reflecting medium is not only optically thin, but also quite distant from the region where the non-thermal X-rays are produced.
The upper limit to the degree of polarization measured by IXPE provides important information about the particle population responsible for generating the X-rays. Given the low polarization degrees measured for Cen A in the radio and IR bands, however, it is not surprising that significant polarization was not measured in the IXPE bandpass. Even using the optimistic assumption that the polarization degree at (Capetti et al., 2000) originates entirely from synchrotron radiation (hence dismissing any polar scattering contribution), our measured limits for the X-ray polarization degree remain consistent with expectations from synchrotron self-Compton emission, where the polarization degree of the Compton scattered X-rays is predicted to be times smaller than that of the synchrotron radiation acting as seed photons for Compton scattering (Bonometto & Saggion, 1973; Poutanen, 1994; Celotti & Matt, 1994; Peirson & Romani, 2019). We note that Compton scattering of unpolarized seed photons, such as the Cosmic Microwave Background or starlight from the host galaxy of Cen A (Tanada et al., 2019) by isotropically distributed relativistic electrons in the jet would produce virtually unpolarized X-rays (Bonometto et al., 1970; Nagirner & Poutanen, 1993; Poutanen, 1994) because of relativistic aberration and resulting random rotation of polarization plane. Thus with a significantly longer exposure with IXPE, where MDP99 could reach levels of , the detection of polarization would be a strong argument in favor of synchrotron radiation as a source of seed photons for Compton scattering. The increase in exposure time would be significant, however, as MDP for the total number of observed source events . Assuming the same count rate for the IXPE observations presented here suggests a total of will be required to reach MDP. Even if future observations of Cen A were taken when the flux is a factor of higher, we would still need to reach such an MDP99. The observed limits on X-ray polarization are in tension with a physical scenario where the X-ray emission arises from hadronic jets. Processes involving hadrons in jets have been suggested as a possible source of the higher than expected emission of Cen A at TeV energies (Abdo et al., 2010; Joshi & Gupta, 2013), and such models applied to blazars predict X-ray polarization degrees as high as , much higher than our limits allow (Zhang & Böttcher, 2013).
All of the data presented in this work and in previous studies are consistent with a scenario where the majority of the X-rays observed in the core of Cen A originate from Compton scattering of lower-energy photons by non-thermal electrons, probably accelerated in regions within a few parsecs of the black hole. Since the polarization measurements for Cen A, spanning from radio to X-ray wavelengths, now sample both the synchrotron and Compton scattering components of the SED it remains plausible that the non-thermal electrons are accelerated in a region in the core with disordered magnetic fields. The observed polarization of Cen A in the 2 – 100 microns waveband (Capetti et al., 2000; Lopez-Rodriguez, 2021) likely arises from dichroic emission and absorption by aligned dust grains instead of direct emission from a non-thermal synchrotron component. Future studies of other AGN with IXPE will offer a clearer picture as to whether the low X-ray polarization degree observed in Cen A is typical of radio galaxies, or if it is an outlier among the radio galaxy population.
Acknowledgments
The Imaging X ray Polarimetry Explorer IXPE is a joint US and Italian mission. The US contribution is supported by the National Aeronautics and Space Administration (NASA) and led and managed by its Marshall Space Flight Center (MSFC), with industry partner Ball Aerospace (contract NNM15AA18C). The Italian contribution is supported by the Italian Space Agency (Agenzia Spaziale Italiana, ASI) through contract ASI-OHBI-2017-12-I.0, agreements ASI-INAF-2017-12-H0 and ASI-INFN-2017.13-H0, and its Space Science Data Center (SSDC), and by the Istituto Nazionale di Astrofisica (INAF) and the Istituto Nazionale di Fisica Nucleare (INFN) in Italy. This research used data products provided by the IXPE Team (MSFC, SSDC, INAF, and INFN) and distributed with additional software tools by the High-Energy Astrophysics Science Archive Research Center (HEASARC), at NASA Goddard Space Flight Center (GSFC). We acknowledge Dawoon E. Kim for providing the polar-plot script. J.R. acknowledges financial support under the INTEGRAL ASI-INAF agreement 2019-35-HH.0 and ASI/INAF No. 2019-35.HH.0. The research leading to these results has received funding from the European Union’s Horizon 2020 Programme under the AHEAD2020 project(grant agreement n. 871158). The INTEGRAL SPI project has been completed under the responsibility and leadership of CNES. Part of the French contribution is supported by the Scientific Research National Center (CNRS) and the French spatial agency (CNES). We are grateful to ASI, CEA, CNES, DLR, ESA, INTA, NASA and OSTC for support. The research at Boston Unviversity was supported in part by National Science Foundation grant AST-2108622. The IAA-CSIC group acknowledges financial support from the Spanish ”Ministerio de Ciencia e Innovación” (MCINN) through the “Center of Excellence Severo Ochoa” award for the Instituto de Astrofísica de Andalucía-CSIC (SEV-2017-0709) and through grants AYA2016-80889-P and PID2019-107847RB-C4
References
- Abdo et al. (2010) Abdo, A. A., Ackermann, M., Ajello, M., et al. 2010, ApJ, 719, 1433, doi: 10.1088/0004-637X/719/2/1433
- Arnaud (1996) Arnaud, K. A. 1996, in Astronomical Society of the Pacific Conference Series, Vol. 101, Astronomical Data Analysis Software and Systems V, ed. G. H. Jacoby & J. Barnes, 17
- Baldini et al. (2022) Baldini, L., Bucciantini, N., Di Lalla, N., et al. 2022, arXiv e-prints, arXiv:2203.06384. https://arxiv.org/abs/2203.06384
- Baloković et al. (2019) Baloković, M., García, J. A., & Cabral, S. E. 2019, Research Notes of the American Astronomical Society, 3, 173, doi: 10.3847/2515-5172/ab578e
- Baloković et al. (2018) Baloković, M., Brightman, M., Harrison, F. A., et al. 2018, ApJ, 854, 42, doi: 10.3847/1538-4357/aaa7eb
- Beckmann et al. (2011) Beckmann, V., Jean, P., Lubiński, P., Soldi, S., & Terrier, R. 2011, A&A, 531, A70, doi: 10.1051/0004-6361/201016020
- Bonometto et al. (1970) Bonometto, S., Cazzola, P., & Saggion, A. 1970, A&A, 7, 292
- Bonometto & Saggion (1973) Bonometto, S., & Saggion, A. 1973, A&A, 23, 9
- Burke et al. (2014) Burke, M. J., Jourdain, E., Roques, J.-P., & Evans, D. A. 2014, ApJ, 787, 50, doi: 10.1088/0004-637X/787/1/50
- Burns et al. (1983) Burns, J. O., Feigelson, E. D., & Schreier, E. J. 1983, ApJ, 273, 128, doi: 10.1086/161353
- Capetti et al. (2000) Capetti, A., Schreier, E. J., Axon, D., et al. 2000, ApJ, 544, 269, doi: 10.1086/317185
- Celotti & Matt (1994) Celotti, A., & Matt, G. 1994, MNRAS, 268, 451, doi: 10.1093/mnras/268.2.451
- Clarke et al. (1986) Clarke, D. A., Burns, J. O., & Feigelson, E. D. 1986, ApJ, 300, L41, doi: 10.1086/184599
- Coppi (1999) Coppi, P. S. 1999, in Astronomical Society of the Pacific Conference Series, Vol. 161, High Energy Processes in Accreting Black Holes, ed. J. Poutanen & R. Svensson, 375. https://arxiv.org/abs/astro-ph/9903158
- Di Marco et al. (2022) Di Marco, A., Costa, E., Muleri, F., et al. 2022, AJ, 163, 170, doi: 10.3847/1538-3881/ac51c9
- Elsner et al. (2012) Elsner, R. F., O’Dell, S. L., & Weisskopf, M. C. 2012, in Society of Photo-Optical Instrumentation Engineers (SPIE) Conference Series, Vol. 8443, Space Telescopes and Instrumentation 2012: Ultraviolet to Gamma Ray, ed. T. Takahashi, S. S. Murray, & J.-W. A. den Herder, 84434N, doi: 10.1117/12.924889
- Evans et al. (2004) Evans, D. A., Kraft, R. P., Worrall, D. M., et al. 2004, ApJ, 612, 786, doi: 10.1086/422806
- Fabian et al. (2015) Fabian, A. C., Lohfink, A., Kara, E., et al. 2015, MNRAS, 451, 4375, doi: 10.1093/mnras/stv1218
- Ferrazzoli et al. (2020) Ferrazzoli, R., Muleri, F., Lefevre, C., et al. 2020, Journal of Astronomical Telescopes, Instruments, and Systems, 6, 048002, doi: 10.1117/1.JATIS.6.4.048002
- Fukazawa et al. (2011) Fukazawa, Y., Hiragi, K., Yamazaki, S., et al. 2011, ApJ, 743, 124, doi: 10.1088/0004-637X/743/2/124
- Fürst et al. (2016) Fürst, F., Müller, C., Madsen, K. K., et al. 2016, ApJ, 819, 150, doi: 10.3847/0004-637X/819/2/150
- Goddi et al. (2021) Goddi, C., Martí-Vidal, I., Messias, H., et al. 2021, ApJ, 910, L14, doi: 10.3847/2041-8213/abee6a
- Grandi et al. (2003) Grandi, P., Fiocchi, M., Perola, C. G., et al. 2003, ApJ, 593, 160, doi: 10.1086/376443
- Hardcastle et al. (2003) Hardcastle, M. J., Worrall, D. M., Kraft, R. P., et al. 2003, ApJ, 593, 169, doi: 10.1086/376519
- HI4PI Collaboration et al. (2016) HI4PI Collaboration, Ben Bekhti, N., Flöer, L., et al. 2016, A&A, 594, A116, doi: 10.1051/0004-6361/201629178
- Janssen et al. (2021) Janssen, M., Falcke, H., Kadler, M., et al. 2021, Nature Astronomy, 5, 1017, doi: 10.1038/s41550-021-01417-w
- Jones et al. (1996) Jones, D. L., Tingay, S. J., Murphy, D. W., et al. 1996, ApJ, 466, L63, doi: 10.1086/310183
- Joshi & Gupta (2013) Joshi, J. C., & Gupta, N. 2013, Phys. Rev. D, 87, 023002, doi: 10.1103/PhysRevD.87.023002
- Kinzer et al. (1995) Kinzer, R. L., Johnson, W. N., Dermer, C. D., et al. 1995, ApJ, 449, 105, doi: 10.1086/176036
- Kislat et al. (2015) Kislat, F., Clark, B., Beilicke, M., & Krawczynski, H. 2015, Astroparticle Physics, 68, 45, doi: 10.1016/j.astropartphys.2015.02.007
- Kraft et al. (2003) Kraft, R. P., Vázquez, S. E., Forman, W. R., et al. 2003, ApJ, 592, 129, doi: 10.1086/375533
- Lanzuisi et al. (2019) Lanzuisi, G., Gilli, R., Cappi, M., et al. 2019, ApJ, 875, L20, doi: 10.3847/2041-8213/ab15dc
- Lopez-Rodriguez (2021) Lopez-Rodriguez, E. 2021, Nature Astronomy, 5, 604, doi: 10.1038/s41550-021-01329-9
- Markowitz et al. (2007) Markowitz, A., Takahashi, T., Watanabe, S., et al. 2007, ApJ, 665, 209, doi: 10.1086/519271
- Marshall (2021) Marshall, H. L. 2021, ApJ, 907, 82, doi: 10.3847/1538-4357/abcfc3
- Middei et al. (2019) Middei, R., Bianchi, S., Marinucci, A., et al. 2019, A&A, 630, A131, doi: 10.1051/0004-6361/201935881
- Müller et al. (2014) Müller, C., Kadler, M., Ojha, R., et al. 2014, A&A, 569, A115, doi: 10.1051/0004-6361/201423948
- Nagirner & Poutanen (1993) Nagirner, D. I., & Poutanen, J. 1993, A&A, 275, 325
- Peirson & Romani (2019) Peirson, A. L., & Romani, R. W. 2019, ApJ, 885, 76, doi: 10.3847/1538-4357/ab46b1
- Petrucci et al. (2001) Petrucci, P. O., Haardt, F., Maraschi, L., et al. 2001, ApJ, 556, 716, doi: 10.1086/321629
- Poutanen (1994) Poutanen, J. 1994, ApJS, 92, 607, doi: 10.1086/192024
- Rankin et al. (2022) Rankin, J., Muleri, F., Tennant, A. F., et al. 2022, AJ, 163, 39, doi: 10.3847/1538-3881/ac397f
- Rothschild et al. (2011) Rothschild, R. E., Markowitz, A., Rivers, E., et al. 2011, ApJ, 733, 23, doi: 10.1088/0004-637X/733/1/23
- Schreier et al. (1979) Schreier, E. J., Feigelson, E., Delvaille, J., et al. 1979, ApJ, 234, L39, doi: 10.1086/183105
- Soffitta et al. (2021) Soffitta, P., Baldini, L., Bellazzini, R., et al. 2021, The Astronomical Journal, 162, 208, doi: 10.3847/1538-3881/ac19b0
- Steinle et al. (1998) Steinle, H., Bennett, K., Bloemen, H., et al. 1998, A&A, 330, 97
- Stern et al. (1995) Stern, B. E., Poutanen, J., Svensson, R., Sikora, M., & Begelman, M. C. 1995, ApJ, 449, L13, doi: 10.1086/309617
- Svensson (1994) Svensson, R. 1994, ApJS, 92, 585, doi: 10.1086/192020
- Tanada et al. (2019) Tanada, K., Kataoka, J., & Inoue, Y. 2019, ApJ, 878, 139, doi: 10.3847/1538-4357/ab2233
- Tingay et al. (2001) Tingay, S. J., Preston, R. A., & Jauncey, D. L. 2001, AJ, 122, 1697, doi: 10.1086/323097
- Tortosa et al. (2018) Tortosa, A., Bianchi, S., Marinucci, A., Matt, G., & Petrucci, P. O. 2018, A&A, 614, A37, doi: 10.1051/0004-6361/201732382
- Weisskopf et al. (2016) Weisskopf, M. C., Ramsey, B., O’Dell, S., et al. 2016, in Society of Photo-Optical Instrumentation Engineers (SPIE) Conference Series, Vol. 9905, Space Telescopes and Instrumentation 2016: Ultraviolet to Gamma Ray, ed. J.-W. A. den Herder, T. Takahashi, & M. Bautz, 990517, doi: 10.1117/12.2235240
- Weisskopf et al. (2022) Weisskopf, M. C., Soffitta, P., Baldini, L., et al. 2022, Journal of Astronomical Telescopes, Instruments, and Systems, 8, 1, doi: 10.1117/1.JATIS.8.2.026002
- Zdziarski et al. (1997) Zdziarski, A. A., Johnson, W. N., Poutanen, J., Magdziarz, P., & Gierlinski, M. 1997, in ESA Special Publication, Vol. 382, The Transparent Universe, ed. C. Winkler, T. J. L. Courvoisier, & P. Durouchoux, 373. https://arxiv.org/abs/astro-ph/9612104
- Zdziarski et al. (2000) Zdziarski, A. A., Poutanen, J., & Johnson, W. N. 2000, ApJ, 542, 703, doi: 10.1086/317046
- Zhang & Böttcher (2013) Zhang, H., & Böttcher, M. 2013, ApJ, 774, 18, doi: 10.1088/0004-637X/774/1/18