Compact and variable radio emission from an active galaxy with supersoft X-ray emission
Abstract
RX J1301.9+2747 is a unique active galaxy with supersoft X-ray spectrum that lacks significant emission at energies above 2 keV. In addition, it is one of few galaxies displaying quasi-periodic X-ray eruptions that recur on a timescale of 13-20 ks. We present multi-epoch radio observations of RX J1301.9+2747 using GMRT, VLA and VLBA. The VLBA imaging at 1.6 GHz reveals a compact radio emission unresolved at a scale of 0.7 pc, with a brightness temperature of K. The radio emission is variable by more than a factor of 2.5 over a few days, based on the data taken from VLA monitoring campaigns. The short-term radio variability suggests that the radio emitting region has a size as small as pc, resulting in an even higher brightness temperature of K. A similar limit on the source size can be obtained if the observed flux variability is not intrinsic and caused by the interstellar scintillation effect. The overall radio spectrum is steep with a time-averaged spectral index between 0.89 GHz and 14 GHz. These observational properties rule out a thermal or star-formation origin of the radio emission, and appear to be consistent with the scenario of episodic jet ejections driven by magnetohydrodynamic process. Simultaneous radio and X-ray monitoring observations down to a cadence of hours are required to test whether the compact and variable radio emission is correlated with the quasi-periodic X-ray eruptions.
1 Introduction
Active galactic nuclei (AGNs) are powered by accretion of gas onto supermassive black holes (SMBHs) with M⊙. They are considered to be scaled-up versions of Galactic black hole X-ray binaries (XRBs, 10 M⊙), because of the similarities seen from the accretion flow, such as rapid X-ray variability (Markowitz & Uttley, 2005; McHardy et al., 2006), the relation between the X-ray and radio emission (Merloni et al., 2003; King et al., 2013), and the correlation between the X-ray spectral index and Eddington ratio (Yang et al., 2015; Ruan et al., 2019; Ai et al., 2020). X-ray observations of XRBs have revealed the existence of two characteristic accretion states, namely soft and hard states (Done et al., 2007). The soft state is dominated by the thermal emission from an inner accretion disk. As accretion rate drops, the Comptonized coronal emission at higher energies comes to dominate the X-ray spectrum (hard state). It is well established that a flat-spectrum, compact jet is commonly observed during the hard state, which is however significantly quenched in the soft state (Fender et al., 2004). When sources transition from the hard to the soft accretion state, the radio emission begins to vary more dramatically, showing episodic jet ejection events (Miller-Jones et al., 2012; Bright et al., 2020). Such spectral state transitions and the relationships between jet ejections and accretion disk emission are still poorly understood in AGNs.
AGNs can be divided into radio-loud and radio-quiet populations according to the radio loudness parameter, which is defined as the ratio of the flux densities between 6 cm and optical 4400Å (). Radio-loud AGNs are conventionally classified as those with (Kellermann et al., 1989). It has been found that the radio loudness is anti-correlated with the Eddington ratios (Ho, 2002; Greene et al., 2006), albeit with a larger scatter, implying that the jet radiation may be dependent on the accretion process. This seems supported by the low radio-loud fraction (7%, Stepanian et al., 2003; Zhou et al., 2006) observed in narrow-line Seyfert 1 galaxies (NLSy1s), a population of AGNs characterized by high accretion rates (Collin & Kawaguchi, 2004; Komossa et al., 2008). However, there are a few radio-loud NLSy1s exhibiting blazar properties (Zhou et al., 2007; Yuan et al., 2008; Abdo et al., 2009; Foschini, 2020), indicating that a relativistic jet can be formed at high accretion rate. This challenges canonical theories of jet formation that have been established in XRBs. Strictly speaking, the accretion states in NLSy1s are not analogous to the high-soft states seen in XRBs, as their X-ray spectra are still dominated by power-law emission originating from the corona.
The discovery of AGNs with supersoft X-ray emission in the past decade has drawn a considerable attention, including 2XMM J123103.2+110648 (Terashima et al., 2012), GSN 069 (Miniutti et al., 2013), and RX J1301.9+2747 (hereafter J1302, Sun et al., 2013). Their X-ray spectra have weak or no hard X-ray emission at energies above 2 keV, and can be described by a dominant blackbody component with a temperature of keV. This appears to be a close analog to the disk-dominated spectrum that is typically seen in the high and soft states of XRBs (Shu et al., 2017). While such an extreme soft emission is unprecedented among AGNs or NLSy1s, they are more commonly seen in stellar tidal disruption event (TDE; Komossa, 2015; Saxton et al., 2020). Indeed, two out of three known supersoft AGNs, 2XMM J123103.2+110648 and GSN 069, could be associated with TDEs (Lin et al., 2017; Shu et al., 2018; Sheng et al., 2021). Of particular interest, all supersoft AGNs are found to show regular X-ray variability in the form of quasi-periodic oscillations (QPOs, Lin et al., 2013; Song et al., 2020) or quasi-periodic eruptions (QPEs, Miniutti et al., 2019; Giustini et al., 2020). The latter are characterized by short-lived flares of supersoft X-ray emission over a stable (quiescent) flux level, and recur on time scales of hours, representing a new cosmic phenomenon associated with extreme variability close to SMBHs, e.g., the radiation pressure instability in the accretion disk (Pan et al., 2022). This suggests a possible link on the part of the extreme variability phenomenon to the supersoft X-ray component.
J1302 is the only supersoft AGN in which both QPOs and QPEs are detected (Song et al., 2020; Giustini et al., 2020). The QPO frequency is stable over almost two decades, suggesting that it may correspond to the high-frequency QPOs found in XRBs, adding further evidence of the similarity of J1302 to the XRBs. In this paper, we report the detection of a compact, variable radio emission in J1302, possibly originating from optically-thin jet ejections. We adopt a cosmology of = 0.3, = 0.7, and = 70 km s-1 Mpc-1 when computing luminosity distance.
| Project | Date | Array | obs | Sint. | Speak | rms | Beam Size (PA) |
|---|---|---|---|---|---|---|---|
| GHz | Jy | Jy/Beam | Jy/Beam | arcsec × arcsec(deg) | |||
| 15A-349 | 05 July 2015 | VLA | 9.0 | 119.2 | 115.1 | 10.1 | 0.23 0.18 (84.21) |
| 07 Aug 2015 | VLA | 9.0 | 154.7 | 154.4 | 10.4 | 0.18 0.17 (-22.89) | |
| 07 Aug 2015 | VLA | 9.0 | 123.3 | 126.4 | 10.3 | 0.18 0.17 (-62.03) | |
| 07 Aug 2015 | VLA | 9.0 | 141.6 | 143.4 | 9.8 | 0.19 0.18 (-87.24) | |
| 08 Aug 2015 | VLA | 9.0 | 78.4 | 57.9 | 11.1 | 0.39 0.17 (68.58) | |
| 09 Aug 2015 | VLA | 9.0 | 89.0 | 84.6 | 10.7 | 0.18 0.17 (-23.63) | |
| 10 Aug 2015 | VLA | 9.0 | 90.4 | 98.2 | 10.0 | 0.18 0.18 (-65.56) | |
| 10 Aug 2015 | VLA | 9.0 | 144.5 | 131.2 | 10.4 | 0.20 0.18 (88.07) | |
| 17B-027 | 04 Sep 2017 | VLA | 6.0 | 295 | 304 | 10.2 | 2.43 0.84 (-63.19) |
| 18B-115 | 05 Jan 2019 | VLA | 14.0 | 183.7 | 174.8 | 9.2 | 2.12 1.19 (-69.92) |
| 06 Jan 2019 | VLA | 14.0 | 162.6 | 173.6 | 11.5 | 2.09 1.19 (-67.75) | |
| 07 Jan 2019 | VLA | 14.0 | 188.5 | 154.8 | 9.0 | 2.16 1.22 (-68.15) | |
| 08 Jan 2019 | VLA | 14.0 | 176.5 | 180.6 | 9.3 | 2.33 1.21 (-65.13) | |
| 09 Jan 2019 | VLA | 14.0 | 183.4 | 158.9 | 8.4 | 2.00 1.24 (-69.84) | |
| 10 Jan 2019 | VLA | 14.0 | 147.7 | 116.7 | 8.7 | 2.14 1.25 (-67.12) | |
| 12 Jan 2019 | VLA | 14.0 | 179 | 139.8 | 9.2 | 2.08 1.24 (-67.62) | |
| 28039 | 31 May 2015 | GMRT | 1.4 | 764 | 735 | 23.2 | 2.40 1.97 (92.7) |
| BS255 | 14 Feb 2017 | VLBA | 1.6 | 670 | 559 | 32.5 | 0.012 0.0066 (25.22) |
| AM868 | 18 June 2006 | VLA | 1.4 | 866 | 779 | 117.2 | † |
| VLASS‡ | 25 Nov 2017 | VLA | 3.0 | 894 | 513 | 107 | 2.60 2.16 (-54.25) |
| AS110 | 17 Oct 2020 | ASKAP | 0.89 | 1880 | 1896 | 348.2 | 25.0 25.0 (0.00) |
Note. — †Due to the poor imaging quality, the beam size cannot be measured using CASA. ‡VLA Sky Survey (VLASS) consists of three-epoch observations, each separated by approximately a period of 32 months (Lacy et al., 2020). Only the epoch I data are used in this paper. The last three rows represent the archival VLA and Australian Square Kilometre Array Pathfinder (ASKAP) data (Section 3.3).
2 OBSERVATION AND DATA REDUCTION
2.1 VLA
J1302 was not detected by Faint Images of the Radio Sky at Twenty cm (FIRST) using Karl G. Jansky Very Large Array (VLA), with a 5 upper limit on the peak flux of 0.95 mJy/beam. It was serendipitously detected in the deeper VLA 1.4 GHz imaging of Coma cluster, with a peak flux density of mJy (Miller et al., 2009). To further study the origin of the radio emission, we observed J1302 with the VLA in three different bands, C, X, and Ku, centered at 6.0 GHz, 9.0 GHz, and 14.0 GHz, respectively. The C-band observation was performed in the B configuration on 2017 Sep 4 (project code: 17B-027), and the data were divided into 16 spectral windows with a total bandwidth of 2 GHz. The X-band observations were carried out eight times in the A configuration between 2015 July 5 and Aug 10 (project code: 15A-349). At the Ku-band, monitoring observations with a daily cadence were carried out in the C configuration between 2019 Jan 5 and Jan 12 (project code: 18B-115). All the observations were phase-calibrated using the calibrator J1310+3220, and 3C 286 was used for bandpass and flux density calibration. The total integration time is 30-35 min per band, with on-source time of 20 min at C-band, 10 min at X-band, and 12 min at Ku-band, respectively.
The data were reduced using the Common Astronomy Software Applications (CASA, version 5.3.0) and the standard VLA data reduction pipeline (version 5.3.1). For the reduced data product, we inspected each spectral window and manually flagged channels affected by radio frequency interference (RFI). The calibrated data were imaged using the CLEAN algorithm with Briggs weighting and ROBUST parameter of 0, which helps to reduce side-lobes and achieve a good sensitivity. The final cleaned maps have a typical synthesized beam of 2408, 0202, 2112 and an rms noise of 10, 10-11, 8-12 Jy/beam at C, X, and Ku-band, respectively. J1302 was clearly detected in all observations. We used the IMFIT task in CASA to fit the radio emission component with a two-dimensional elliptical Gaussian model to determine the position, integrated and peak flux density. The radio emission at the three bands is unresolved and no extended emission is detected. The compactness of the radio emission is confirmed by the ratios of integrated and peak flux density, which are in the range 0.92–1.35, with a median of 1.09. For consistency, only peak flux densities are used in our following analysis. The VLA observation log and flux density measurements are presented in Table 1.
2.2 GMRT
J1302 was observed with the Giant Metrewave Radio Telescope (GMRT) at band 5 (central frequency of 1.37 GHz) on 2015 May 31 (project code: 28039). The GMRT band 5 data were divided into 512 channels across a bandwidth of 33.3 MHz. Flux calibration was conducted using 3C 147 and 3C 286, whereas the nearby source 3C 286 was also used to determine the complex gain solutions. 3C 147 was observed for 30 minutes in the beginning while 3C 286 was observed for 4 minutes after every 55 minutes of the J1302 scan and 30 minutes at the end of observation. 3C 147, 3C 286, and J1302 were observed for 30 min, 65 min and 9.2 h, respectively. The data from the GMRT observations were reduced using CASA (version 5.6.1) following standard procedures and by using a pipeline adapted from the CAsa Pipeline-cum-Toolkit for Upgraded Giant Metrewave Radio Telescope data REduction (CAPTURE; Kale & Ishwara-Chandra, 2021). We began our reduction by flagging known bad channels, and the remaining RFI was flagged with the flagdata task using the clip and tfcrop modes. In total, we flagged 20 of the data. We ran the task tclean with the options of the MS-MFS (multi-scale multi-frequency synthesis, Rau & Cornwell, 2011) deconvolver, two Taylor terms (nterms=2), and W-Projection (Cornwell et al., 2008) to accurately model the wide bandwidth and the non-coplanar field of view of GMRT. We also used a robust parameter of 0, imsize of 2500 pixels and cellsize of 0.5 in task tclean. In addition, we performed a few rounds of phase-only self-calibration to improve the fidelity of imaging. The final image has a synthesized beam of 2420. The GMRT flux density measurements are shown in Table 1.
2.3 VLBA
We observed J1302 on 2017 Feb 14 using the Very Long Baseline Array (VLBA) with its 10 antennas (project code: BS255). The observing frequency was centered at 1.576 GHz in the L band. The observation was performed in the phase-referencing mode to a nearby strong compact radio source (J1300+28). Phase-reference cycle times were 4.5 minutes, with 3 minutes on-source and 1.5 minutes for the phase calibrator. We also inserted several scans of the bright radio source 3C 273 for fringe and bandpass calibration with an integration time of 2 minutes for each scan. The resulting total on-source time was 6 hours. To achieve sufficiently high imaging sensitivity, we adopted the observational mode RDBE/DDC to use the largest recording rate of 2 Gbps, corresponding to a recording bandwidth of 256 MHz in each of the dual circular polarizations. The data from the VLBA experiment were correlated with the DiFX software correlator (Deller et al., 2011). We used the NRAO AIPS software to calibrate the amplitudes and phases of the visibility data, following the standard procedure from the AIPS Cookbook111http://www.aips.nrao.edu/cook.html. The calibrated data were imported into the Caltech DIFMAP package (Shepherd, 1997) for imaging and model-fitting. The results are given in Table 1.
3 Results
3.1 Radio variability analysis
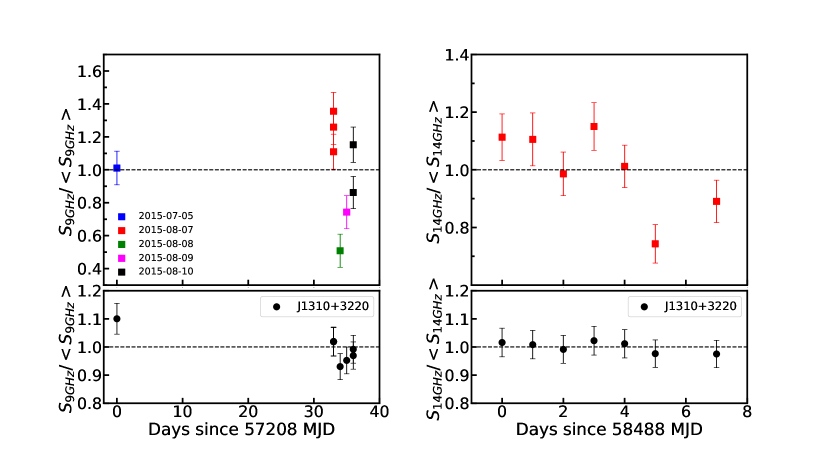
Using the flux density between 6 cm and optical 4400 (Shu et al., 2017), we derived the radio-loudness parameter R 3.3. This suggests that J1302 is formally radio quiet, because a radio-loud object is usually defined to have R 10 (Kellermann et al., 1989). We investigated the radio variability based on the radio flux measurements from the VLA monitoring observations at X and Ku-band. As shown in Table 1, the radio emission of J1302 is variable on timescales of days to month (as short as a few hours within one day). Specifically, the maximum flux density is higher than minimum one by a factor of 2.6 at X-band, and the variability amplitude is a factor of 1.5 at Ku-band. To further inspect the radio variability in individual observations, we plot in Figure 1 the radio flux densities normalized to their time-average value for X-band (left) and Ku-band (right), respectively. We note that the error on the peak flux density given by IMFIT task in CASA is likely underestimated, as it is smaller than the image off-source root-mean-square (rms). To be conservative, the flux errors shown in Figure 1 were calculated as the sum in quadrature of map rms and calibration uncertainty that is assumed to be of 5% of the flux density (e.g., Panessa et al., 2022). It can be seen that the variability amplitude in the percent change in flux relative to the averaged one can be as high as 50% at X-band, while it is 30% at Ku-band. In the lower panel, we also show the percent flux changes for the phase calibrator (J1310+3220), which are at a level of only 10%. This flux variability does not significantly correlated with that of J1302, indicating that the observed variability can not be dominated by the variability of phase or flux calibrators.
To quantify the radio variability pattern of J1302 we calculated the debiased variability index (e.g., Barvainis et al., 2005). is similar to the fractional variability that is commonly used in analyzing X-ray light curves (e.g., Vaughan et al., 2003). quantifies the variability amplitude in excess of uncertainties as a percentage of the mean flux,
| (1) |
where is the variance of the light curve, is the mean squared flux errors which are the sum in quadrature of map rms and 5% flux calibration uncertainty, and is the mean flux density. A source is considered to be variable when by a significant amount. For J1302 we measured 4 per cent and 3 per cent, respectively (Table 2).
In addition, we performed analysis to test the significance of variability in the light curve differing from a constant. For a non-variable source, the value of reduced (i.e., /d.o.f) is expected to be 1. For a given value, we can derive the variability significance P(, where ( is the probability to observe a larger than expected under the null hypothesis of no variability. According to the test, the X-band and Ku-band light curves shown in Figure 1 are variable at a confidence level of 99.99% and 99.94%, respectively, providing further evidence for the variability of J1302. Note that J1302 was observed three times on 2015 Aug 7 at 9 GHz, separated by 1-2 hours, but the intraday variability amplitude was marginal with (9 GHz)= 4.88.4 per cent. However, a larger intraday variability amplitude of (9 GHz)= 207 per cent was found for the observations performed between 2015 Aug 9 and 2015 Aug 10, indicating that the radio emission can vary on a timescale as short as a few hours.
| Peak flux | Mean | Std. dev. | /d.o.f | () | |
|---|---|---|---|---|---|
| J1302 (Jy) | 113.9 | 32 | 51/7 | % | 264 |
| J1302 (Jy) | 157 | 23 | 24/6 | % | 123 |
| Calibrator (Jy) | 1.6 | 0.08 | 7/7 | 0.57 | 1.64.3 |
| Calibrator (Jy) | 1.38 | 0.03 | 0.9/6 | 0.01 |
Note. — Calibrator refers to J1310+3220.
3.2 Parsec-scale radio morphology
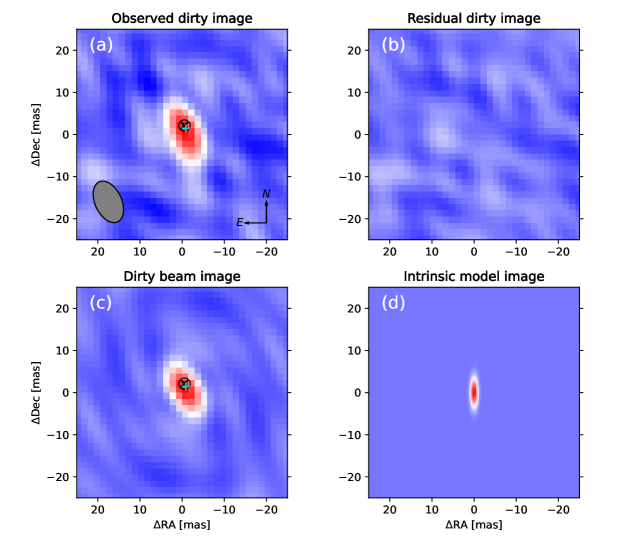
In Figure 2 (a), we show the VLBA image of J1302 at 1.6 GHz. The source appears to be unresolved which is very similar to the beam shape in size. Other than the central peak, no extended emission was seen above the image sensitivity of 0.098 mJy beam-1 (). To measure the source size more accurately, we performed source fitting in the uv-plane to the total polarization intensity data using the UV_FIT task in the GILDAS software package. We found no additional components in the residual map (Figure 2 (b)). The integrated flux density for the source in the uv-plane is 655 Jy, in good agreement with the flux density measured in the image plane using the DIFMAP package (Table 1). As shown in Figure 2 (d), the VLBA source has a deconvolved size of 5.61 mas 1.43 mas, indicating the extreme compactness of radio emission (0.7 pc at the redshift of J1302, ). This is also consistent with the size measured using DIFMAP. The optical centroid reported by the Gaia DR3 (Gaia Collaboration et al., 2021) is marked as a black cross in Figure 2, which is RA(J2000), Dec(J2000), with mas, mas, and the astrometric excess noise of 1.35 mas222Since J1302 is an extragalactic galaxy, we used the Gaia position without taking into account proper motions.. Considering the positional uncertainties of Gaia, the radio peak does not show any positional offset with respect to the optical centroid, indicating that the emission components at the two bands arises probably from the same region very close to SMBH.
The brightness temperature of compact radio emission can be estimated as (e.g., Ulvestad et al., 2005)
| (2) |
where is the peak flux density in mJy at the observing frequency in GHz, with and are the fitted FWHM of the major and minor axes of the Gaussian component in units of mas. Using the deconvolved size () derived from the VLBA image, we obtained a brightness temperature of 5.0 K. Note that the pc-scale structure of J1302 is very compact and not resolved with the VLBA, only the upper limit on the source size can be constrained. Hence, the brightness temperature should be considered as a lower limit. Such a high brightness temperature allows us to exclude the star-formation origin for the radio emission since is typically lower than K as expected from star-forming processes (Pérez-Torres et al., 2021). The emission from young supernova remnants can also be ruled out, as the 1.4 GHz radio luminosity of J1302 ( W Hz-1) is higher than the majority of the radio supernova remnants, such as those studied in the starburst galaxy Arp 220 (Varenius et al., 2019). In fact, despite different resolutions, the radio flux densities measured with the VLBA and GMRT are comparable to that obtained with the VLA about a decade ago at the similar band (Miller et al., 2009), disfavoring the scenario of transients as the origin of the radio emission, such as a supernova explosion, gamma-ray burst or TDE.
3.3 Radio spectrum
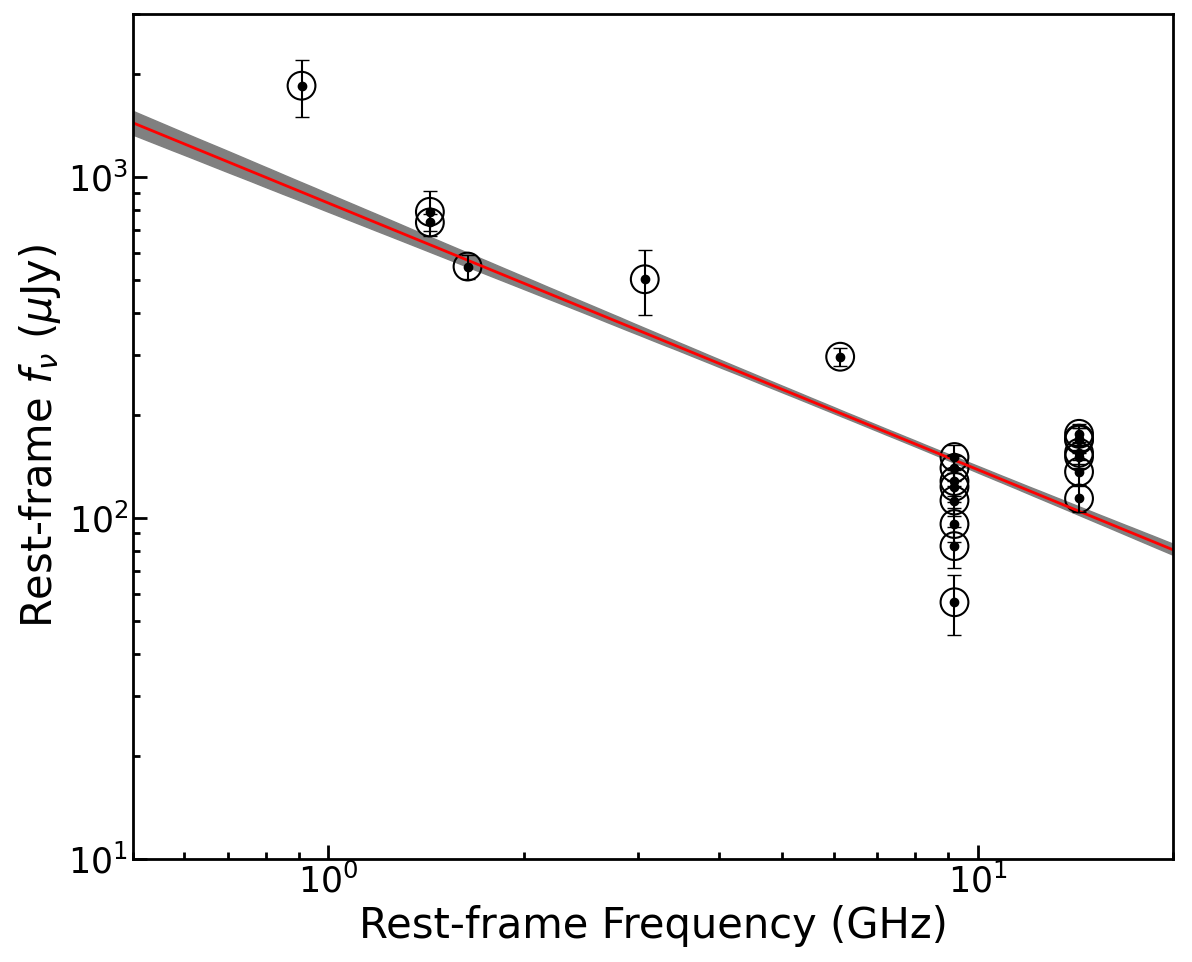
Figure 3 shows all the radio measurements available for J1302 based on our GMRT, VLA and VLBA projects. We also included the publicly available data from archival radio surveys such as Rapid ASKAP Continuum Survey (RACS, McConnell et al., 2020), VLA-Coma (Miller et al., 2009), and VLASS (Lacy et al., 2020). We retrieved the public radio maps and then measured the integrated and peak flux density with CASA, following the same procedures described in Section 2.1. The results are shown in Table 1. Although most observations were taken at different epochs and various resolutions, the radio flux density appear to decrease with frequency, indicating a steep radio spectrum between 0.89 GHz and 14 GHz. By fitting a power law spectrum () to the data points, we obtained a spectral index 0.03 (red line in Figure 3). This value is consistent with the typical radio spectral index of for the Palomar Seyfert galaxies (Ho & Ulvestad, 2001). Note that using the data obtained from the quasi-simultaneous observations only, i.e., the GMRT and VLA observations performed on 2015 May-Aug, the radio spectrum of J1302 can still be described by a steep power law with slope 0.04. Therefore, the emission from J1302 has a steep radio spectrum, even considering the time variability, suggesting that it may be related to optically thin synchrotron emission. We will discuss the implications of the steep radio spectrum in Section 4.
4 Discussion
We report radio variability on daily to month timescales in the supersoft AGN J1302 through VLA monitoring campaigns in 15 epochs on 2015 July-Aug and 2019 Jan. In addition, we detect an unresolved radio emission at a mas-scale with the VLBA, corresponding to 0.7 pc at the redshift of J1302. J1302 is one of few AGNs with X-ray QPEs, and has a low black hole mass ( M⊙) accreting at a high rate (0.1, Shu et al., 2017). The radio light curve is variable with a rms amplitude of 26 4 per cent and 12 3 per cent with respect to the mean flux density at X-band (9 GHz) and Ku-band (14 GHz), respectively. Daily flux variation up to a factor of 2.6 is also observed at X-band. Such highly variable radio emission is an unusual property for J1302 as a radio-quiet AGN (Section 3.1). Radio emission from radio-quiet AGNs could arise from different physical processes (Panessa et al., 2019), including star-formation, outflow, jet and accretion-disk corona. We will discuss these scenarios in detail according to the radio flux variability, morphology, size, brightness temperature, and time-averaged spectral index.
4.1 Extrinsic variability caused by interstellar scintillation?
The radio flux variability, if it is intrinsic to the AGN, would be useful to distinguish the sources of radio emission. We first consider whether the observed variability might be induced by the effect of refractive interstellar scintillation (ISS). This process occurs when radio waves propagate through an inhomogeneous plasma of our Galaxy, which could cause intraday variability in some AGNs with compact radio emission (Lovell et al., 2003; Rickett, 2007). The amount and timescale of radio variation caused by ISS depend on the Galactic electron column density along the line of sight and the observing frequency. Using the NE2001 free electron density model developed by Cordes & Lazio (2002)333https://pypi.org/project/pyne2001/, and the Galactic dispersion measure (DM)444 J1302 has a galactic coordinate of . We used the DM of 9.25 cm-3 pc for J1302, which was derived from the pulsar J1239+2453 () in the ATNF Pulsar Catalogue. along the line of sight to J1302, we find that, at the position of J1302, the transition frequency between strong and weak scattering regime is 4.9 GHz. Hence J1302 is in the weak-scattering regime at 9 GHz and 14 GHz. In this case, we computed the fractional modulation index due to ISS (Walker, 1998)555In Walker (1998), the modulation index is used to calculate the variability amplitude caused by ISS, which is defined as the ratio of the rms deviation to the mean value of the observed flux densities, . which is at 9 GHz and at 14 GHz, respectively, comparable to that observed in J1302. This amount of modulation is expected to occur on a time-scale of h 1-2 h. While J1302 is found to vary at 9 GHz on a timescale as short as a few hours, the variability amplitude can be as low as per cent, which seems inconsistent with the prediction of the ISS effect. On the other hand, if ISS is the main mechanism responsible for the flux density variation, the angular size of the radio source should be similar to the first Fresnel zone, 2.4-3.0 as, where (in kpc) is taken as the NE2001 model distance for DM cm-3 pc, and is the observed frequency.
4.2 Sub-kpc outflow
Although the radio emission is variable and observed at different epochs and resolutions, we can obtain a time-averaged radio spectral index of 0.03 between 0.89 GHz and 14 GHz (Figure 3), suggestive of an optically-thin steep spectrum. Note that if using the data from GMRT 1.4 GHz, VLA 3 GHz, 6 GHz, and 14 GHz observations which have similar resolutions (i.e., 2″), a consistent radio steep spectrum can be obtained ( 0.03). Laor et al. (2019) suggested that a sub-kpc outflow interaction with the ambient interstellar medium could cause the optically-thin radio emission in radio-quiet AGNs. However, if such a nuclear outflow interaction were present, it would be resolved by our high-resolution VLBA observation into a number of clumpy structures or extended diffused emission (e.g., Yang et al., 2021; Yao et al., 2021). It is obviously incompatible with the VLBA imaging of J1302. On the other hand, there are no blue-shifted absorption or emission lines in the X-ray and optical spectra suggestive of outflows. Hence the outflow interpretation for the radio emission seems disfavored.
4.3 Steady and continuous jet
Based on the high-resolution VLBA observation, J1302 has a high brightness temperature of 5 K, which rules out the origin of radio emission from star-forming region or thermal processes (Section 3.2). Such a brightness temperature can place J1302 at the high end of the range for the radio cores detected in local Seyfert galaxies ( Mpc, Panessa & Giroletti, 2013). If the flux variations in the radio light curve (Figure 1) are intrinsic to the AGN, the minimum variability on a timescale of one day can place a constraint on the source size of less than pc using the light-crossing time. Such a small source size suggests that the radio variability might originate from the innermost region of the AGN. Adopting the mean flux density at 9 GHz, this implies that the brightness temperature of the variable radio emission is 9.4 K. Therefore, the brightness temperature is comparable to the inverse Compton catastrophe limit of K (Kellermann & Pauliny-Toth, 1969), at which an emission region will radiate away most of its energy in X-rays via inverse Compton scattering in a timescale of days. The brightness temperature is however an order of magnitude higher than the equipartition temperature of 5 K (Readhead, 1994), which is also usually used to indicate the intrinsic brightness temperature of the radio core in AGNs. The value was estimated by assuming that there is equipartition of energy between the radiating particles and the magnetic field, which is derived from a spectral cutoff due to synchrotron self-absorption (see details in Readhead, 1994). Note that if the radio variability is extrinsic and caused by ISS, a similar limit on source size ( pc constrained by the first Fresnel zone) hence the brightness temperature can be obtained. This implies that the radio emission could be associated with a jet. In this case, the jet could have a Doppler factor of 1–10, depending on which intrinsic brightness temperature is taken. Hence, the beaming effect is not significant.
If the radio emission is from a steady and continuous jet, standard presumptions (by analog with XRBs) would be that J1302 is in the low-hard state which is dominated by a hard X-ray power-law component at energies above 2 keV (Fender et al., 2004). However, X-ray emissions from J1302 have been supersoft, with more than 90 per cent of photons having energies below 1 keV (Sun et al., 2013; Shu et al., 2017; Giustini et al., 2020), resembling the high/soft state observed in XRBs. High-resolution VLBI observations have found evidence of the presence of a jet feature in many local Seyfert galaxies (Panessa & Giroletti, 2013) as well as radio quiet NLSy1s with high accretion rates (e.g., Doi et al., 2013; Yao et al., 2021), either extending up to kpc scales or being confined to the inner pc regions due to the jet interaction with the circumnuclear gas medium. We do not find any extended structures in J1302 predicated by steady jets with the high-resolution VLBA observation. This suggests that the steady-jet model cannot account for the radio emission.
4.4 Episodic jet ejections
Given its high accretion rate (0.1) and steep radio spectrum, one possible identity for J1302 is transitioning from the hard to soft state accompanied by an isolated radio ejection event, as observed in some XRBs (Corbel et al., 2001; Fender et al., 2004; Bright et al., 2020). It should be noted that J1302 is one of the few AGNs with X-ray QPEs detected, which are characterized by repetitive short-lived eruptions in the light curves. Strictly speaking, the X-ray eruptions in J1302 seem to be irregularly spaced in time rather than quasi-periodic (Giustini et al., 2020), which may be linked to the evolving corona as well as jet launching process (Wilkins & Gallo, 2015; Gallo et al., 2019). Although no hard X-ray detected in J1302, the ratio of 5 GHz to X-ray (0.3-2 keV) luminosity in the flare state is , consistent with the relation for stars with active coronae (Laor & Behar, 2008). In the quiescent state, the luminosity ratio is an order of magnitude higher (), but still much lower than for radio-loud AGNs. This analog suggests that a magnetically heated corona may be responsible for the radio emission of J1302. However, theoretical studies suggest that a flat synchrotron radio spectrum (between GHz) would be expected from an X-ray corona (Raginski & Laor, 2016), which seems inconsistent with the steep spectrum observed in J1302 (Section 3.3). It should be noted that steep radio cores at mas scales have also detected in other Seyfert galaxies, though not being prevalent (e.g., Panessa & Giroletti, 2013; Congiu et al., 2020), which usually indicate the presence of optically thin synchrotron emission.
On the other hand, episodic ejections of magnetized plasmoids in the innermost region of the AGN could be invoked to explain the radio emission. By analogy with the coronal mass ejection in solar physics (Lin & Forbes, 2000), Yuan et al. (2009) proposed a magnetohydrodynamical model for episodic ejection of plasmoids from black holes associated with the closed magnetic fields in an accretion flow. In the model, magnetic field loops are twisted to form flux ropes because of the turbulence of the accretion flow. With the magnetic energy gradually accumulated to reach a threshold, the flux rope loses its equilibrium and is thrust outwards in a catastrophic way, leading to magnetic reconnection. The magnetic energy is released in this process and converted into the energy of thermal electrons in plasmoids associated with the ejection of the flux rope, which then emit strong synchrotron radiation. Since the plasmoid ejecta can be considered as single blobs, they expand almost adiabatically after leaving the accretion disk and can quickly become optically thin in the radio band (Yuan et al., 2009), explaining the steep spectrum. If this is the case, the episodic X-ray eruptions in J1302 may be regulated by magnetohydrodynamic process as well (Li et al., 2017). A high degree of polarization and polarization angle change would also be expected during the multi-band flares. Simultaneous radio and X-ray monitoring observations, particularly in the X-ray eruption state, are required to search for any correlated variability between the two bands, which is a hallmark of the coronal ejections as the origin of short-lived X-ray flares and will be presented elsewhere.
4.5 Comparison to other supersoft AGNs
In addition to J1302, two other AGNs having supersoft X-ray spectra666Note that while two more galaxies are found to show QPEs with similar supersoft X-ray spectra (Arcodia et al., 2021), they are possibly not be associated with AGNs. are 2XMM J123103.2+110648 and GSN069. The latter two sources were also observed with the VLA on 2017 Nov, in the same program as J1302 (17B-027). GSN 069 has weak radio emission, with a flux density of Jy, while J1231+1106 was not detected with a 5 upper limit of 38.6 Jy. Following the X-ray QPEs detected in GSN 069, an X-ray/radio campaign has been carried out, and no significant radio variability during QPEs is found (Miniutti et al., 2019). The inferred radio spectral index is steep (0.7), consistent with that measured in J1302, suggesting a radio origin from optically thin synchrotron emission. However, the ratio of 5 GHz to X-ray (0.3-2 keV) luminosity in the QPE state is , about two orders of magnitude lower than that for J1302, indicating either the radio emission or the flaring X-ray emission has different origins between the two objects. Owing to its faint radio flux density (100 Jy), using the VLBA to image the pc-scale structure of radio emission in GSN 069 is challenging.
5 Conclusion
We present GMRT, VLA, and VLBA observations of the supersoft AGN J1302, which revealed compact radio emission with a size of 0.7 pc. The radio emission is variable on a daily timescale at both 9 GHz and 14 GHz, implying that the radio emitting region can have a size as small as pc, with a high brightness temperature of K. If the observed flux variability is not intrinsic and caused by the interstellar scintillation effect, a similar limit on the source size can also be obtained ( pc). The radio spectrum is steep with a time-averaged spectral index between 0.89 and 14 GHz, suggesting that it may be related to optically thin synchrotron emission. These observational properties rule out the radio origin from star-formation activities, sub-kpc outflows, or AGN corona. Optically thin jet ejection driven by magnetohydrodynamic process seems to be the most favored scenario. The magnetohydrodynamic model can be tested with future more sensitive polarimetric observations, which predicts a high degree of polarization in the radio emission.
References
- Abdo et al. (2009) Abdo, A. A., Ackermann, M., Ajello, M., et al. 2009, ApJ, 707, L142
- Ai et al. (2020) Ai, Y., Dou, L., Yang, C., et al. 2020, ApJ, 890, L29
- Arcodia et al. (2021) Arcodia, R., Merloni, A., Nandra, K., et al. 2021, Nature, 592, 704
- Barvainis et al. (2005) Barvainis, R., Lehár, J., Birkinshaw, M., et al. 2005, ApJ, 618, 108
- Bright et al. (2020) Bright, J. S., Fender, R. P., Motta, S. E., et al. 2020, Nature Astronomy, 4, 697
- Collin & Kawaguchi (2004) Collin, S. & Kawaguchi, T. 2004, A&A, 426, 797
- Congiu et al. (2020) Congiu, E., Kharb, P., Tarchi, A., et al. 2020, MNRAS, 499, 3149
- Corbel et al. (2001) Corbel, S., Kaaret, P., Jain, R. K., et al. 2001, ApJ, 554, 43
- Cordes & Lazio (2002) Cordes, J. M. & Lazio, T. J. W. 2002, arXiv:astro-ph/0207156
- Cornwell et al. (2008) Cornwell, T. J., Golap, K., & Bhatnagar, S. 2008, IEEE Journal of Selected Topics in Signal Processing, 2, 647.
- Deller et al. (2011) Deller, A. T., Brisken, W. F., Phillips, C. J., et al. 2011, PASP, 123, 275
- Done et al. (2007) Done, C., Gierliński, M., & Kubota, A. 2007, A&A Rev., 15, 1
- Doi et al. (2013) Doi, A., Asada, K., Fujisawa, K., et al. 2013, ApJ, 765, 69
- Fender et al. (2004) Fender, R. P., Belloni, T. M., & Gallo, E. 2004, MNRAS, 355, 1105
- Foschini (2020) Foschini, L. 2020, Universe, 6, 136.
- Gallo et al. (2019) Gallo, L. C., Gonzalez, A. G., Waddell, S. G. H., et al. 2019, MNRAS, 484, 4287
- Gaia Collaboration et al. (2021) Gaia Collaboration, Brown, A. G. A., Vallenari, A., et al. 2021, A&A, 649, A1
- Giustini et al. (2020) Giustini, M., Miniutti, G., & Saxton, R. D. 2020, A&A, 636, L2
- Greene et al. (2006) Greene, J. E., Ho, L. C., & Ulvestad, J. S. 2006, ApJ, 636, 56
- Greisen (2003) Greisen, E. W. 2003, Information Handling in Astronomy - Historical Vistas, 285, 109
- Ho & Ulvestad (2001) Ho, L. C. & Ulvestad, J. S. 2001, ApJS, 133, 77
- Ho (2002) Ho, L. C. 2002, ApJ, 564, 120
- Lacy et al. (2020) Lacy, M., Baum, S. A., Chandler, C. J., et al. 2020, PASP, 132, 035001
- Lin & Forbes (2000) Lin, J. & Forbes, T. G. 2000, J. Geophys. Res., 105, 2375
- Kale & Ishwara-Chandra (2021) Kale, R. & Ishwara-Chandra, C. H. 2021, Experimental Astronomy, 51, 95
- Kellermann & Pauliny-Toth (1969) Kellermann, K. I. & Pauliny-Toth, I. I. K. 1969, ApJ, 155, L71
- Kellermann et al. (1989) Kellermann, K. I., Sramek, R., Schmidt, M., et al. 1989, AJ, 98, 1195
- King et al. (2013) King, A. L., Miller, J. M., Reynolds, M. T., et al. 2013, ApJ, 774, L25
- Komossa et al. (2008) Komossa, S., Xu, D., Zhou, H., et al. 2008, ApJ, 680, 926
- Komossa (2015) Komossa, S. 2015, Journal of High Energy Astrophysics, 7, 148
- Laor & Behar (2008) Laor, A. & Behar, E. 2008, MNRAS, 390, 847
- Laor et al. (2019) Laor, A., Baldi, R. D., & Behar, E. 2019, MNRAS, 482, 5513
- Li et al. (2017) Li, Y.-P., Yuan, F., & Wang, Q. D. 2017, MNRAS, 468, 2552
- Lin et al. (2013) Lin, D., Irwin, J. A., Godet, O., et al. 2013, ApJ, 776, L10
- Lin et al. (2017) Lin, D., Godet, O., Ho, L. C., et al. 2017, MNRAS, 468, 783
- Lovell et al. (2003) Lovell, J. E. J., Jauncey, D. L., Bignall, H. E., et al. 2003, AJ, 126, 1699
- Markowitz & Uttley (2005) Markowitz, A. & Uttley, P. 2005, ApJ, 625, L39
- McConnell et al. (2020) McConnell, D., Hale, C. L., Lenc, E., et al. 2020, PASA, 37, e048
- McHardy et al. (2006) McHardy, I. M., Koerding, E., Knigge, C., et al. 2006, Nature, 444, 730
- Merloni et al. (2003) Merloni, A., Heinz, S., & di Matteo, T. 2003, MNRAS, 345, 1057
- Miller et al. (2009) Miller, N. A., Hornschemeier, A. E., & Mobasher, B. 2009, AJ, 137, 4436
- Miller-Jones et al. (2012) Miller-Jones, J. C. A., Sivakoff, G. R., Altamirano, D., et al. 2012, MNRAS, 421, 468.
- Miniutti et al. (2013) Miniutti, G., Saxton, R. D., Rodríguez-Pascual, P. M., et al. 2013, MNRAS, 433, 1764
- Miniutti et al. (2019) Miniutti, G., Saxton, R. D., Giustini, M., et al. 2019, Nature, 573, 381
- McMullin et al. (2007) McMullin, J. P., Waters, B., Schiebel, D., et al. 2007, Astronomical Data Analysis Software and Systems XVI, 376, 127
- Pan et al. (2022) Pan, X., Li, S.-L., Cao, X., et al. 2022, ApJ, 928, L18
- Panessa & Giroletti (2013) Panessa, F. & Giroletti, M. 2013, MNRAS, 432, 1138
- Panessa et al. (2019) Panessa, F., Baldi, R. D., Laor, A., et al. 2019, Nature Astronomy, 3, 387
- Panessa et al. (2022) Panessa, F., Pérez-Torres, M., Hernández-García, L., et al. 2022, MNRAS, 510, 718
- Pérez-Torres et al. (2021) Pérez-Torres, M., Mattila, S., Alonso-Herrero, A., et al. 2021, A&A Rev., 29, 2
- Rau & Cornwell (2011) Rau, U. & Cornwell, T. J. 2011, A&A, 532, A71.
- Readhead (1994) Readhead, A. C. S. 1994, ApJ, 426, 51
- Rickett (2007) Rickett, B. J. 2007, Astronomical and Astrophysical Transactions, 26, 429
- Raginski & Laor (2016) Raginski, I. & Laor, A. 2016, MNRAS, 459, 2082
- Ruan et al. (2019) Ruan, J. J., Anderson, S. F., Eracleous, M., et al. 2019, ApJ, 883, 76
- Saxton et al. (2020) Saxton, R., Komossa, S., Auchettl, K., et al. 2020, Space Sci. Rev., 216, 85
- Sheng et al. (2021) Sheng, Z., Wang, T., Ferland, G., et al. 2021, ApJ, 920, L25
- Shepherd (1997) Shepherd, M. C. 1997, Astronomical Data Analysis Software and Systems VI, 125, 77
- Shu et al. (2017) Shu, X. W., Wang, T. G., Jiang, N., et al. 2017, ApJ, 837, 3
- Shu et al. (2018) Shu, X. W., Wang, S. S., Dou, L. M., et al. 2018, ApJ, 857, L16
- Sun et al. (2013) Sun, L., Shu, X., & Wang, T. 2013, ApJ, 768, 167
- Song et al. (2020) Song, J. R., Shu, X. W., Sun, L. M., et al. 2020, A&A, 644, L9
- Stepanian et al. (2003) Stepanian, J. A., Benítez, E., Krongold, Y., et al. 2003, ApJ, 588, 746
- Terashima et al. (2012) Terashima, Y., Kamizasa, N., Awaki, H., et al. 2012, ApJ, 752, 154
- Ulvestad et al. (2005) Ulvestad, J. S., Antonucci, R. R. J., & Barvainis, R. 2005, ApJ, 621, 123
- Vaughan et al. (2003) Vaughan, S., Edelson, R., Warwick, R. S., et al. 2003, MNRAS, 345, 1271
- Varenius et al. (2019) Varenius, E., Conway, J. E., Batejat, F., et al. 2019, A&A, 623, A173
- Wilkins & Gallo (2015) Wilkins, D. R. & Gallo, L. C. 2015, MNRAS, 449, 129
- Walker (1998) Walker, M. A. 1998, MNRAS, 294, 307
- Yang et al. (2015) Yang, Q.-X., Xie, F.-G., Yuan, F., et al. 2015, MNRAS, 447, 1692
- Yang et al. (2020) Yang, J., Gurvits, L. I., Paragi, Z., et al. 2020, MNRAS, 495, L71
- Yang et al. (2021) Yang, J., Paragi, Z., Nardini, E., et al. 2021, MNRAS, 500, 2620
- Yao et al. (2021) Yao, S., Yang, X., Gu, M., et al. 2021, MNRAS, 508, 1305
- Yuan et al. (2008) Yuan, W., Zhou, H. Y., Komossa, S., et al. 2008, ApJ, 685, 801
- Yuan et al. (2009) Yuan, F., Lin, J., Wu, K., et al. 2009, MNRAS, 395, 2183
- Zhou et al. (2006) Zhou, H., Wang, T., Yuan, W., et al. 2006, ApJS, 166, 128
- Zhou et al. (2007) Zhou, H., Wang, T., Yuan, W., et al. 2007, ApJ, 658, L13