Detection of diffuse gamma-ray emission towards a massive star forming region hosting Wolf-Rayet stars
Abstract
Isotopic and elemental abundances seen in Galactic cosmic rays imply that of the cosmic-ray (CR) nuclei are probably synthesized by massive Wolf-Rayet (WR) stars. Massive star clusters hosting WR and OB-type stars have been proposed as potential Galactic cosmic-ray accelerators for decades, in particular via diffusive shock acceleration at wind termination shocks. Here we report the analysis of Fermi Large Area Telescope’s data towards the direction of Masgomas-6a, a young massive star cluster candidate hosting two WR stars. We detect an extended -ray source with in the vicinity of Masgomas-6a, spatially coincident with two unassociated Fermi 4FGL sources. We also present the CO observational results of molecular clouds in this region, using the data from the Milky Way Imaging Scroll Painting project. The -ray emission intensity correlates well with the distribution of molecular gas at the distance of Masgomas-6a, indicating that these gamma rays may be produced by CRs accelerated by massive stars in Masgomas-6a. At the distance of of Masgomas-6a, the luminosity of the extended source is . With a kinetic luminosity of in the stellar winds, the WR stars are capable of powering the -ray emission via neutral pion decay resulted from cosmic ray interactions. The size of the GeV source and the energetic requirement suggests a CR diffusion coefficient smaller than that in the Galactic interstellar medium, indicating strong suppression of CR diffusion in the molecular cloud.
1 Introduction
The elemental composition of Galactic cosmic rays (GCRs) has been investigated with several experiments (IMP7 (Garcia-Munoz et al., 1979), ISEE-3 (Wiedenbeck & Greiner, 1981), Voyager (Lukasiak et al., 1994), ACE-CRIS (Binns et al., 2005), DAMPE (An et al., 2019), AMS (Aguilar et al., 2020) and etc.). For most elements, the isotopic ratios seen in GCRs are similar to those in the solar wind (Wiedenbeck et al., 1979). The most notable exception to this is 22Ne/20Ne, where the CR value is about 5 times that of the solar wind (Binns et al., 2005, 2008). According to the most recent models of nucleosynthesis, a large amount of 22Ne is generated in Wolf-Rayet (WR) stars (Higdon & Lingenfelter, 2003; Kalyashova et al., 2019). The interacting winds of massive stars have been recognized as potential CR accelerators as early as in the 1980s (Bykov & Toptygin, 1982; Cesarsky & Montmerle, 1983). The acceleration could take place in the vicinity of the stars (Bykov, 2014; Aharonian et al., 2019), in the colliding wind region of WR and OB binary systems (Benaglia & Romero, 2003), or in superbubbles, multi-parsec structures caused by the collective activity of massive stars (Parizot et al., 2004; Bykov, 2014). Higdon & Lingenfelter (2003) found that the observed value of 22Ne/20Ne can be achieved with a mixture of WR star material and material with standard composition. Using state-of-the-art stellar evolution models, Kalyashova et al. (2019) calculated the amount of neon isotopes produced by interacting winds of OB-type and WR stars and also concluded that massive star clusters can produce a significant fraction of GCRs and 22Ne.
Spectroscopic data show that WR stars, along with OB-type stars, have powerful stellar winds with velocities of 1000-3000 km/s (Hamann et al., 2019). Due to their small size and high star density (Portegies Zwart et al., 2010), young massive star clusters are likely to have strong colliding magnetohydrodynamic shock flows, where efficient particle acceleration can take place. Recently, Seo et al. (2018) estimated the total power of OB-type and WR stars’ winds in the Galaxy as . If of the wind luminosity is converted to GCRs, these stellar winds can provide a significant contribution to the GCR production below the knee. The conversion of stellar wind power to CRs might be traced by secondary -rays, the products of interactions of CRs with the surrounding gas. The diffuse GeV -rays detected by Fermi-LAT telescope around some compact clusters, such as Cygnus OB2(Ackermann et al., 2011), NGC 3603 (Yang & Aharonian, 2017), Westerlund 2 (Yang et al., 2018) and RSGC 1 (Sun et al., 2020), can be naturally interpreted within this scenario. Detection of TeV or higher energy photons from some massive star clusters (e.g., the Cygus region) may suggest that cosmic rays are accelerated up to energy of 100 TeV to PeV (Aharonian et al., 2002; Abeysekara et al., 2021; Amenomori et al., 2021)
Recently, Ramírez Alegría et al. (2018) identified two groups of massive stars aligned in the Galactic direction. They find more than 20 massive stars, including two Wolf-Rayets (WR122-11 and the new WR122-16), OB-type stars and one transitional object (the Luminous Blue Variable (LBV) candidate IRAS 18576+0341 (Pasquali & Comerón, 2002)). The individual distances and radial velocities of these massive stars indicate two populations of massive stars in the same line of sight: Masgomas-6a and Masgomas-6b. Masgomas-6a is reported as a massive star cluster candidate with a total mass (lower limit) of , located at kpc, contains both Wolf-Rayets and several OB-type stars. Masgomas-6b, located at kpc, has a total mass (lower limit) of and hosts a LBV candidate and an evolved population of supergiants. For both objects, the presence of evolved massive stars (the WN8-9h Wolf-Rayet in Masgomas-6a and the LBV candidate in Masgomas-6b) sets an age limit of 5 Myr (Ramírez Alegría et al., 2018).
In this paper, we report the detection of an extended -ray source towards the direction of Masgomas-6 with the Fermi Large Area Telescope. We also present the CO observational results of molecular clouds (MCs) in this region, using the data from the Milky Way Imaging Scroll Painting (MWISP) project, which is a multi-line survey in 12CO/13CO/C18O along the northern Galactic plane with the Purple Mountain Observatory (PMO) 13.7 m telescope. The correlation between the -ray intensity and the molecular gas at the distance of Masgomas-6a suggests that the GeV -ray source is likely related with the massive stars in Masgomas-6a. The paper is organized as follows. We first present the Fermi/LAT data analysis result of the -ray source in §2. We then present the MWISP observational results of molecular clouds in this region in §3. In §4, the interpretation of the GeV source and the implication is presented. Finally, we give a summary in §5.
2 Fermi/LAT Data Analysis
The Fermi-LAT is a wide field-of-view, high-energy -ray telescope, covering the energy range from below 20 MeV to more than 300 GeV, and it has continuously monitored the sky since 2008 (Atwood et al., 2009). The Pass 8 data taken from 2008 August 4 to 2022 April 9 are used to study the GeV emission towards Masgomas-6, where two Fermi sources (4FGL J1900.4+0339 and 4FGL J1858.0+0354) are found in the vicinity. All -ray photons within a region of interest (ROI) centered on the position of Masgomas-6 are considered for the binned maximum likelihood analysis. The publicly available software Fermipy (ver.1.0.1) and Fermitools (ver.2.0.8) are used to perform the data analysis. The event type FRONT + BACK and the instrument response functions (IRFs) () are used. We only consider the -ray events in the energy range, with the standard data quality selection criteria “”. To minimize the contamination from -rays from the Earth limb, the maximum zenith angle is adopted to be 90. We include all sources listed in the fourth Fermi-LAT catalog(Abdollahi et al., 2020) and the diffuse Galactic interstellar emission (IEM, ), isotropic emission (“” ) in the background model. The spectral parameters of the sources within of Masgomas-6, Galactic and isotropic diffuse emission components are all set free. The significance of -ray sources are estimated by maximum likelihood test statistic (TS), which is defined by TS, where and are maximum likelihood values for the background with target source and without the target source (null hypothesis). The square root of the TS is approximately equal to the detection significance of a given source.
2.1 Morphological analysis
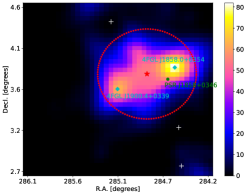
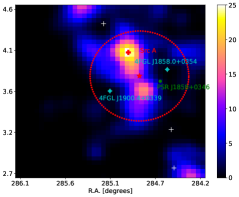
To obtain a sufficiently good angular resolution for the morphology analysis, we use the LAT data in 3-500 GeV. Figure 1 shows the 3-500 GeV TS map in the the vicinity of Masgomas-6 with the binned likelihood analysis. The two 4FGL point-like sources near Masgomas-6, 4FGL J1900.4+0339 and 4FGL J1858.0+0354, are located and away from the center of Masgomas-6, respectively. We plan to investigate what appear to be diffuse emissions beyond the two 4FGL point-like sources. Since these two point-like sources are unassociated with any known counterparts and there is diffuse emission in the vicinity, we investigate whether the -ray emission in this region represents a spatially extended source. We use the Fermipy tool to quantitatively evaluate the extension and location of this -ray emission. A uniform disk model and a two-dimensional (2D) Gaussian model are used to evaluate the extension. The results are shown in Table 1. We find that the uniform disk model describes well the GeV morphology, with the best-fit extension of and the best-fit position at ()=(,) in the energy band above 3 GeV. This position is away from the position of Masgomas-6. The extension represents the radius containing 68% of the intensity. The is estimated to be 129.80 for the disk model, which is defined as , where is the maximum likelihood value for the extend model and is the maximum likelihood value for the point-like model (Ackermann et al., 2017). According to Ackermann et al. (2017), the criterion to define a source as being extended is and (here represents the improvement when adding a second point source). We find that the -ray source, assuming a uniform disk model, meets the criterion with and (see Table 1). We also test the 2D Gaussian model and find that it is also better than the the point-like model. Therefore, the GeV emission in this region is described better by an extended source.
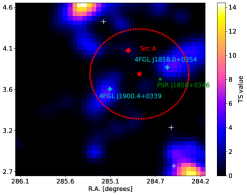
Furthermore, we compare the residual TS maps after subtracting the disk component and the two point-like source component. We find that there is bright (maximum ) emission (referred to as Src A, see Figure 1) at the top left corner of the residual TS map in the two point-like source model, but the significance of this emission is significantly reduced in the disk model. This implies that the extended source model fits the GeV emission better than the two point-like sources model, consistent with our above analysis.
2.2 Energy Spectrum
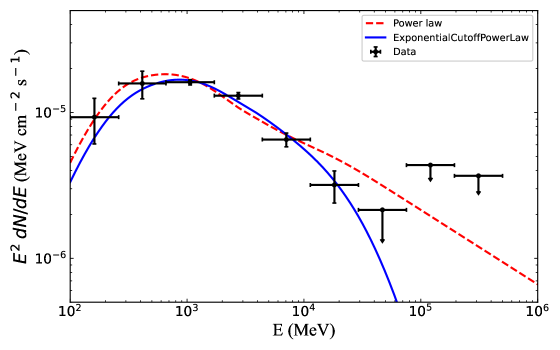
After the morphology was fixed, the extended disk model is used to study the spectrum of the source. The spectral energy distribution (SED) of the source in the energy band 0.1 GeV, shown in Figure 2, is derived by gtlike assuming the best-fit uniform disk extension. When the TS value of spectra data point is less than 4, an upper limit is calculated at 95% confidence level using a Bayesian method (Helene, 1983). Compared to a single power-law, the spectrum is better described by a log parabola empirical function . The spectral index and break energy are found to be , and . The energy flux is in 0.1-500 GeV. Assuming a distance of , the total -ray luminosity of the source in 0.1-500 GeV is . The preference of a curved spectrum over a single power-law is supported by (), where is defined as . In the energy band greater than 3 GeV, however, the spectra of the disk model is well described by a single power-law function with ( corresponding to (Abdollahi et al., 2020)).
3 CO observations
We make use of the data from the Milky Way Imaging Scroll Painting (MWISP111http://english.dlh.pmo.cas.cn/ic/) project, which is a multi-line survey in 12CO/13CO/C18O observed simultaneously using the 13.7 m millimeter-wavelength telescope of the Purple Mountain Observatory at Delingha. The detailed observing strategy, the instrument, the spectral resolution, and the quality of the CO observations can be found in Su et al. (2019). In this work, we present the results of the MWISP CO survey for regions centering at . We estimated the kinematic distance to the MCs using the Milky Way’s rotation curve suggested by Sofue (2015), assuming the Sun’s Galactocentric distance to be 8.0 kpc and Solar rotation velocity to be .
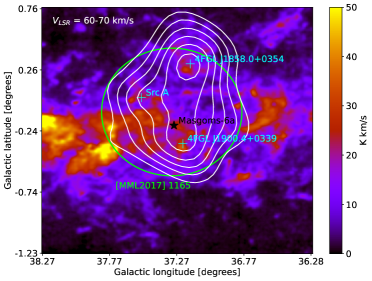
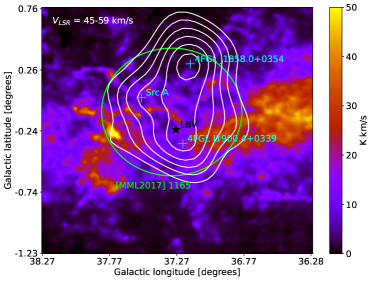
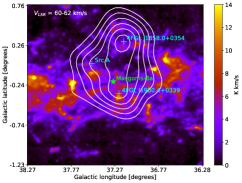
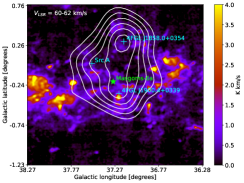
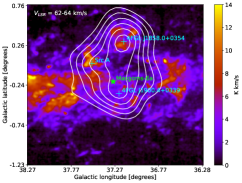
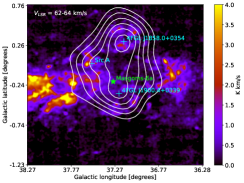
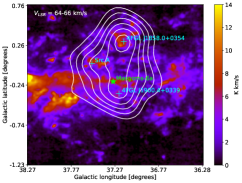
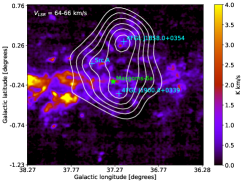
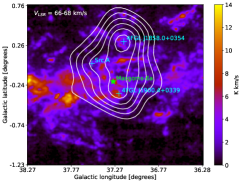
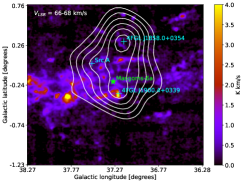
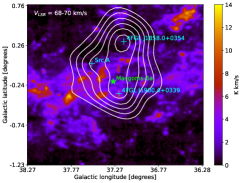
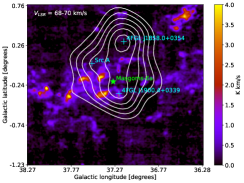
The distance of Masgomas-6a is estimated to be kpc (Ramírez Alegría et al., 2018), corresponding to a velocity in the range of for the MC CO emission. Note that, the velocity of each MC could indicates two candidate kinematic distances, the near side one and the far side one. The far distance of the MC in is 8.4–9.0 kpc. The distance of Masgomas-6b is estimated to be , corresponding to a velocity in the range of . The 12CO(J = 1-0) maps for the velocity range 60 to 70 and 45 to 59 are, respectively, shown in the left and right panel of Figure 3. The intensity maps of the gamma-ray emission correlate more strongly with the gas distribution in the velocity range of 60 to 70 . Particularly, the two point-like 4FGL sources (4FGL J1900.4+0339 and 4FGL J1858.0+0354) and Src A each coincide with one of the densest regions of the gas distribution. On the other hand, -ray emission intensity correlates poorly with gas distribution in the 45-59 velocity range compared to that in the 60-70 velocity range. This indicates that the extended -ray source is more likely to be related to Masgomas-6a. Miville-Deschênes et al. (2017) produced a catalog of 8107 molecular clouds that covers the entire Galactic plane and includes 98% of the 12CO emission observed within , using a hierarchical cluster identification method applied to the result of a Gaussian decomposition of CO data. We note that a molecular cloud in this catalog (named “[MML2017] 1165”) 222http://simbad.u-strasbg.fr/simbad/sim-ref?querymethod=bib&simbo=on&submit=submit+bibcode&bibcode=2017ApJ...834...57M is located in the velocity range of , consistent with our measurement. The angular radius of this cloud is (see the magenta circle in the left panel of Figure 3). Interestingly, the position and size of this MC agree well with those of the extended GeV source, supporting the association between the GeV source and the MC.
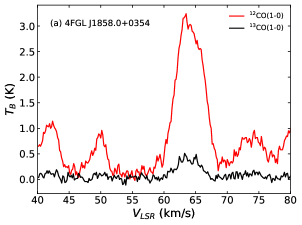
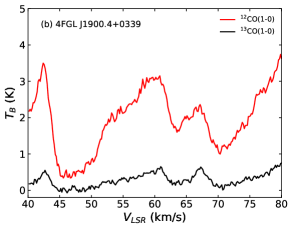
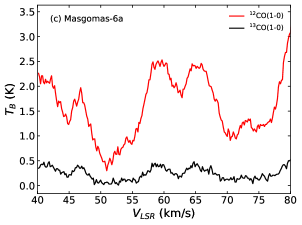
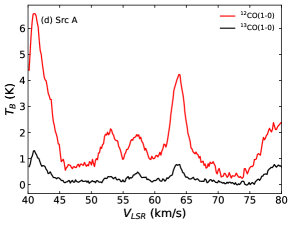
The spectra of 12CO and 13CO emission toward the two 4FGL sources, Masgomas-6a and Src A are shown in Figure 4. We use a Gaussian function to fit the spectra of 12CO emission around toward the two 4FGL sources, Src A and Masgomas-6a. The line center and the full width at half maximum (FWHM) in the four regions are, respectively, with FWHM for 4FGL J1858.0+0354, with FWHM for 4FGL J1900.4+0339, with FWHM for Masgomas-6a and with FWHM for Src A. Thus, one peak at is seen in the direction of 4FGL J1858.0+0354 and Src A, and another peak at is seen in the direction of 4FGL J1900.4+0339 and Masgomas-6a. This strengthens our confidence on the aforementioned correlation between the intensity of -ray emission and the gas distribution in the velocity range of 60 to 70 . In addition, We do not find any significant evidence of broadenings or asymmetries in 12CO line with respect to the narrow 13CO line, indicating no shock interaction.
Figure 5 displays the 12CO(J = 1-0) and 13CO(J = 1-0) maps for five consecutive velocity ranges from 60 to 70 , with a step of for each map. We find that the molecular gas are observed to be spatially associated with the GeV emission in all the velocity range. In particular, the correlation is the best in the velocity ranges of and .
Adopting the mean CO-to- mass conversion factor (Bolatto et al., 2013), we estimate that the total mass of gas within the disk of the GeV source is about . If we assume the -ray emission region is spherical in geometry, then the radius is estimated to be . Then the average atom density of the cloud in this region is about .
4 Interpretation of the GeV emission
The correlation between the -ray intensity and the molecular gas density favors the hadronic origin of the -ray emission, where GeV -rays are produced by the interaction between the CRs and the gas. We fit the -ray spectra of the source with the hadronic model using the Markov Chain Monte Carlo fitting routines of Naima, a package for the calculation of nonthermal emission from relativistic particles (Zabalza, 2015). First, we assume the parent proton spectrum is a single power-law given by . The derived parameters are , and the total energy is for the protons above , assuming the gas density is 70 . The best-fit result is shown by the red dashed line in Figure 2. Below 1 GeV, the hard spectrum is due to the bump. At higher energies (), the theoretical flux exceeds the LAT data slightly (but still within the uncertainty). This could indicate a possible cutoff in the proton spectrum around 100 GeV . Then, we consider a cutoff power-law function for the parent proton spectrum, i.e. . The derived parameters are and for the protons above 1 GeV, if we take , , and . The fitting result is shown by the blue line in Figure 2.
The young massive star cluster candidate Masgomas-6a contains two Wolf–Rayet stars (WR122-11 and WR122-16) and several OB-type stars. WR122-11 is classified as WN6 and WR122-16 is classified as WN8-9h (Ramírez Alegría et al., 2018). These WR stars have a mass loss rate and the wind velocity is , so the kinetic luminosity of the stellar wind is about , which is sufficient to power the -ray emission. As the mass-loss of WR stars are quasi-continuous over the lifetime , one could expect a quasi-continuous injection of CRs into the interstellar medium over the age of WR stars (). The stellar wind from Masgomas-6a may drive a termination shock by interacting with the surrounding gas. The termination shock then accelerates cosmic rays, which produce gamma-ray emission by colliding with the molecular cloud.
The efficiency of production of -rays in the cloud is determined by the ratio between the diffusion timescale and the energy loss timescale of cosmic rays, i.e., . The energy loss time of cosmic ray protons colliding with the molecular gas is , where is the cross section of collisions, is the inelasticity of pion production and is the gas number density. The diffusion time depends on the diffusion coefficient in the cloud, i.e. , where is the size of the source and is the diffusion coefficient. The diffusion coefficient for CRs propagating in the molecular cloud is poorly known. In the interstellar medium, the diffusion coefficient is of order of for 10–100 GeV protons (see e.g. (Strong et al., 2007)) responsible for 1–10 GeV -rays. We assume a homogeneous diffusion coefficient and parameterize it as for CRs with energy of , with being the ratio between the CR diffusion coefficient in the cloud and the average one of the Galactic ISM. The diffusion time is then given by yr for . Thus, the required CR injection rate to power the -ray emission is . To account for the CR injection rate with the stellar wind power of WRs, is required for a reasonable CR acceleration efficiency, implying that the diffusion coefficient is significantly suppressed in the molecular cloud. We also note that a significant part of CRs could have already escaped out of the -ray emission region. The relation between the total injected CR energy and the CR energy remained in the -ray emission region can be expressed as , where is the the total diffusion length of CRs corresponding to the age of the WR stars.
Supernova remnants (SNRs) could also be a potential accelerator of cosmic rays in this region, since the energy release in CRs from a single SNR is . The CRs escaping from SNRs can produce -rays by interacting with the surrounding gas(Aharonian & Atoyan, 1996; Rodriguez Marrero et al., 2008; Aharonian et al., 2008; Gabici et al., 2009; Uchiyama et al., 2012; Zhang et al., 2021). No recorded SNRs is found in this region and future multi-wavelength observations may be helpful to determine this scenario. The radial distribution of -rays can provide key information for the injection history of CRs, which is useful to distinguish between the continuous stellar wind scenario and the single SNR scenario (Aharonian et al., 2019). Pulsar wind nebulae (PWN) are another potential sources for the -ray emission. There is a middle-aged pulsar PSR J1858+0346 located positionally close to the center of the -ray sources, as marked by the grey dot in Figure 1, with a characteristic age of 2 Myr and a distance of 5.5 kpc (Manchester et al., 2005). If the -ray source is related to the PWN of the pulsar, the -ray luminosity would be about , and cannot be explained based on the current spin-down power of PSR J1858+0346, which is . However, we note that the cooling timescale of GeV-emitting electrons, Myr, is comparable to or even longer than the age of the pulsar assuming a typical interstellar magnetic field strength. As a result, considering a much higher spin-down power of the pulsar at its early age, we cannot exclude the pulsar/PWN origin of the -ray source.
5 Summary
Massive star clusters hosting WR and OB-type stars have been suggested to be accelerators of Galactic CRs. We analyzed the Fermi Large Area Telescope’s data towards the direction of Masgomas-6a, a young massive star cluster candidate hosting two WR stars, which is located at a distance of . An extended -ray source with a radius of degree is found in the vicinity of Masgomas-6a. Our analysis shows a correlation between the intensity of -ray emission and the density of molecular gas in the region. Combined with the fact that the distance of the molecular cloud inferred from the velocity distribution is consistent with that of Masgomas-6a, the correlation indicates that the -ray emission is related with Masgomas-6a. A natural scenario is that the two WR stars in Masgomas-6a accelerate cosmic rays, which produce the -ray emission through inelastic proton-proton collisions with the molecular gas. With a kinetic luminosity of in the stellar winds, the two WR stars are capable of powering the -ray emission. The radius of the GeV source is about for a source distance of . Assuming a normal CR diffusion coefficient, the vast majority of CRs accelerated by WR stars in their lifetime must have escaped out of the source as the injection of CRs is expected to last million years. The energy budget constraint suggests a CR diffusion coefficient smaller than that in the Galactic ISM, indicating a strong suppression of CR diffusion when they are propagating in the molecular cloud. The spectral data shown in Figure 2 seems to suggest the presence of a cutoff in the proton spectrum around 100 GeV, but we note that the errors of the data at high energies are rather large, so one can not exclude a single power-law spectrum. Thus, the maximum energy of cosmic rays accelerated by Masgomas-6a should be least GeV.
References
- Abdollahi et al. (2020) Abdollahi, S., Acero, F., Ackermann, M., et al. 2020, ApJS, 247, 33. doi:10.3847/1538-4365/ab6bcb
- Abeysekara et al. (2021) Abeysekara, A. U., Albert, A., Alfaro, R., et al. 2021, Nature Astronomy, 5, 465. doi:10.1038/s41550-021-01318-y
- Ackermann et al. (2011) Ackermann, M., Ajello, M., Allafort, A., et al. 2011, Science, 334, 1103. doi:10.1126/science.1210311
- Ackermann et al. (2017) Ackermann, M., Ajello, M., Baldini, L., et al. 2017, ApJ, 843, 139. doi:10.3847/1538-4357/aa775a
- Aguilar et al. (2020) Aguilar, M., Ali Cavasonza, L., Ambrosi, G., et al. 2020, Phys. Rev. Lett., 124, 211102. doi:10.1103/PhysRevLett.124.211102
- Aharonian & Atoyan (1996) Aharonian, F. A. & Atoyan, A. M. 1996, A&A, 309, 917
- Aharonian et al. (2002) Aharonian, F., Akhperjanian, A., Beilicke, M., et al. 2002, A&A, 393, L37. doi:10.1051/0004-6361:20021171
- Aharonian et al. (2008) Aharonian, F., Akhperjanian, A. G., Bazer-Bachi, A. R., et al. 2008, A&A, 481, 401. doi:10.1051/0004-6361:20077765
- Aharonian et al. (2019) Aharonian, F., Yang, R., & de Oña Wilhelmi, E. 2019, Nature Astronomy, 3, 561. doi:10.1038/s41550-019-0724-0
- Amenomori et al. (2021) Amenomori, M., Bao, Y. W., Bi, X. J., et al. 2021, Phys. Rev. Lett., 127, 031102. doi:10.1103/PhysRevLett.127.031102
- An et al. (2019) An, Q., Asfandiyarov, R., Azzarello, P., et al. 2019, Science Advances, 5, eaax3793. doi:10.1126/sciadv.aax3793
- Atwood et al. (2009) Atwood, W. B., Abdo, A. A., Ackermann, M., et al. 2009, ApJ, 697, 1071. doi:10.1088/0004-637X/697/2/1071
- Benaglia & Romero (2003) Benaglia, P. & Romero, G. E. 2003, A&A, 399, 1121. doi:10.1051/0004-6361:20021854
- Binns et al. (2005) Binns, W. R., Wiedenbeck, M. E., Arnould, M., et al. 2005, ApJ, 634, 351. doi:10.1086/496959
- Binns et al. (2008) Binns, W. R., Wiedenbeck, M. E., Arnould, M., et al. 2008, New A Rev., 52, 427. doi:10.1016/j.newar.2008.05.008
- Bolatto et al. (2013) Bolatto, A. D., Wolfire, M., & Leroy, A. K. 2013, ARA&A, 51, 207. doi:10.1146/annurev-astro-082812-140944
- Bykov & Toptygin (1982) Bykov, A. M. & Toptygin, I. N. 1982, Akademiia Nauk SSSR Izvestiia Seriia Fizicheskaia, 46, 1659
- Bykov (2014) Bykov, A. M. 2014, A&A Rev., 22, 77. doi:10.1007/s00159-014-0077-8
- Gabici et al. (2009) Gabici, S., Aharonian, F. A., & Casanova, S. 2009, MNRAS, 396, 1629. doi:10.1111/j.1365-2966.2009.14832.x
- Garcia-Munoz et al. (1979) Garcia-Munoz, M., Simpson, J. A., & Wefel, J. P. 1979, ApJ, 232, L95. doi:10.1086/183043
- Cesarsky & Montmerle (1983) Cesarsky, C. J. & Montmerle, T. 1983, Space Sci. Rev., 36, 173. doi:10.1007/BF00167503
- Helene (1983) Helene, O. 1983, Nuclear Instruments and Methods in Physics Research, 212, 319. doi:10.1016/0167-5087(83)90709-3
- Higdon & Lingenfelter (2003) Higdon, J. C. & Lingenfelter, R. E. 2003, ApJ, 590, 822. doi:10.1086/375192
- Hamann et al. (2019) Hamann, W.-R., Gräfener, G., Liermann, A., et al. 2019, A&A, 625, A57. doi:10.1051/0004-6361/201834850
- Kalyashova et al. (2019) Kalyashova, M. E., Bykov, A. M., Osipov, S. M., et al. 2019, Journal of Physics Conference Series, 1400, 022011. doi:10.1088/1742-6596/1400/2/022011
- Lukasiak et al. (1994) Lukasiak, A., Ferrando, P., McDonald, F. B., et al. 1994, ApJ, 426, 366. doi:10.1086/174072
- Manchester et al. (2005) Manchester, R. N., Hobbs, G. B., Teoh, A., et al. 2005, AJ, 129, 1993. doi:10.1086/428488
- Miville-Deschênes et al. (2017) Miville-Deschênes, M.-A., Murray, N., & Lee, E. J. 2017, ApJ, 834, 57. doi:10.3847/1538-4357/834/1/57
- Parizot et al. (2004) Parizot, E., Marcowith, A., van der Swaluw, E., et al. 2004, A&A, 424, 747. doi:10.1051/0004-6361:20041269
- Pasquali & Comerón (2002) Pasquali, A. & Comerón, F. 2002, A&A, 382, 1005. doi:10.1051/0004-6361:20011667
- Portegies Zwart et al. (2010) Portegies Zwart, S. F., McMillan, S. L. W., & Gieles, M. 2010, ARA&A, 48, 431. doi:10.1146/annurev-astro-081309-130834
- Ramírez Alegría et al. (2018) Ramírez Alegría, S., Herrero, A., Rübke, K., et al. 2018, A&A, 614, A116. doi:10.1051/0004-6361/201731720
- Rodriguez Marrero et al. (2008) Rodriguez Marrero, A. Y., Torres, D. F., de Cea del Pozo, E., et al. 2008, ApJ, 689, 213. doi:10.1086/592562
- Seo et al. (2018) Seo, J., Kang, H., & Ryu, D. 2018, Journal of Korean Astronomical Society, 51, 37. doi:10.5303/JKAS.2018.51.2.37
- Sofue (2015) Sofue, Y. 2015, PASJ, 67, 75. doi:10.1093/pasj/psv042
- Strong et al. (2007) Strong, A. W., Moskalenko, I. V., & Ptuskin, V. S. 2007, Annual Review of Nuclear and Particle Science, 57, 285. doi:10.1146/annurev.nucl.57.090506.123011
- Su et al. (2019) Su, Y., Yang, J., Zhang, S., et al. 2019, ApJS, 240, 9. doi:10.3847/1538-4365/aaf1c8
- Sun et al. (2020) Sun, X.-N., Yang, R.-Z., & Wang, X.-Y. 2020, MNRAS, 494, 3405. doi:10.1093/mnras/staa947
- Tatischeff et al. (2021) Tatischeff, V., Raymond, J. C., Duprat, J., et al. 2021, MNRAS, 508, 1321. doi:10.1093/mnras/stab2533
- Uchiyama et al. (2012) Uchiyama, Y., Funk, S., Katagiri, H., et al. 2012, ApJ, 749, L35. doi:10.1088/2041-8205/749/2/L35
- Wiedenbeck et al. (1979) Wiedenbeck, M. E., Greiner, D. E., Bieser, F. S., et al. 1979, International Cosmic Ray Conference, 1, 412
- Wiedenbeck & Greiner (1981) Wiedenbeck, M. E. & Greiner, D. E. 1981, Phys. Rev. Lett., 46, 682. doi:10.1103/PhysRevLett.46.682
- Yang & Aharonian (2017) Yang, R.-. zhi . & Aharonian, F. 2017, A&A, 600, A107. doi:10.1051/0004-6361/201630213
- Yang et al. (2018) Yang, R.-. zhi ., de Oña Wilhelmi, E., & Aharonian, F. 2018, A&A, 611, A77. doi:10.1051/0004-6361/201732045
- Zabalza (2015) Zabalza, V. 2015, 34th International Cosmic Ray Conference (ICRC2015), 34, 922
- Zhang et al. (2021) Zhang, H.-M., Liu, R.-Y., Su, Y., et al. 2021, ApJ, 923, 106. doi:10.3847/1538-4357/ac36c6
| Morphology ( 3 GeV) | R.A.(degrees) | Decl.(degrees) | Extension | loglikelihood | TS | ||
|---|---|---|---|---|---|---|---|
| Null | – | – | – | 119936.52 | – | – | – |
| PS+PS | – | – | – | 120016.56 | 160.08 | – | 8 |
| Disk | 120028.15 | 183.26 | 129.80 | 5 | |||
| Gaussian | 120025.90 | 178.76 | 125.30 | 5 |