HST/WFC3 H Direct-Imaging Detection of a Point-like Source in the Disk Cavity of AB Aur
Abstract
Accreting protoplanets enable the direct characterization of planet formation. As part of a high-contrast imaging search for accreting planets with the Hubble Space Telescope (HST) Wide Field Camera 3, we present H images of AB Aurigae (AB Aur), a Herbig Ae/Be star harboring a transition disk. The data were collected in two epochs of direct-imaging observations using the F656N narrow-band filter. After subtracting the point spread function of the primary star, we identify a point-like source located at a P.A. of and a separation of mas relative to the host star. The position is consistent with the recently identified protoplanet candidate AB Aur b. The source is visible in two individual epochs separated by days and the H intensities in the two epochs agree. The H flux density is mJy, times of the optical continuum determined by published HST/STIS photometry. In comparison to PDS 70 b and c, the H excess emission is weak. The central star is accreting and the stellar H emission has a similar line-to-continuum ratio as seen in AB Aur b. We conclude that both planetary accretion and scattered stellar light are possible sources of the H emission, and the H detection alone does not validate AB Aur b as an accreting protoplanet. Disentangling the origin of the emission will be crucial for probing planet formation in the AB Aur disk.
1 Introduction
Two of the most fundamental goals of planet formation studies are to understand how and when planets gain mass. The planetary mass assembly process can be directly constrained by characterizing actively accreting protoplanets. So far, the discoveries of protoplanets are limited to PDS 70 b and c, two gas giants directly imaged within the same planetary system (Keppler et al., 2018; Haffert et al., 2019). A plethora of follow-up studies on this system confirmed the presence of circumplanetary disks (Isella et al., 2019; Benisty et al., 2021), estimated the mass accretion rates (e.g., Wagner et al., 2018; Haffert et al., 2019; Hashimoto et al., 2020; Zhou et al., 2021), investigated the planet-disk interactions (e.g., Bae et al., 2019), and constrained the planetary orbits (Wang et al., 2021). Despite this steady progress, these studies are confined to one protoplanetary system and only represent a single outcome of the planet formation process observed at an instant in time.
To expand the sample of accreting planets, we launched the Hubble Accreting Luminous Protoplanets in H-Alpha (HALPHA) Survey (Program ID: 16651111Program information can be found at https://www.stsci.edu/cgi-bin/get-proposal-info?id=16651&observatory=HST, PI: Zhou) to search for accreting planets in ten transition disk systems. We are exploiting the recently demonstrated optical and ultraviolet (UV) high-contrast imaging capibility of Wide Field Camera 3 (WFC3) UVIS (Zhou et al., 2021; Sanghi et al., 2022) and using the narrow-band F656N (H) filter to look for H-emitting planets. Accretion onto planets produces strong hydrogen line emission, reduces planet-star contrasts, and can in principle improve search efficiency. Any detections result in H luminosities () and accretion rate estimates of candidate planets.
The strategy of observing transition disk systems is motivated by models showing that the disk gaps and cavities are consistent with being sculpted by multiple giant planets (Dodson-Robinson & Salyk, 2011; Close, 2020). These models are broadly supported by the discoveries and characteristics of PDS 70 b and c (Bae et al., 2019). We identified ten systems that harbor giant cavities demonstrated in ALMA dust continuum images (Francis & van der Marel, 2020). The host stars are generally faint or located in the northern hemisphere and, consequently, are not easily accessible by ground-based visible-light adaptive-optics (AO) systems.
The first target of the survey is AB Aurigae (AB Aur), a Herbig Ae/Be star (DeWarf et al., 2003) with a spectral type of A0, a mass of , and an isochronal age of Myr222The age is estimated with the PARSEC isochrones (Bressan et al., 2012) and the observationally constrained and spectral type of AB Aur (Herczeg & Hillenbrand, 2014).. It is actively accreting at a rate of (Garcia Lopez et al., 2006) and exhibits significant variability () in both broadband photometry and the H line (Harrington & Kuhn, 2007; Cody et al., 2013). AB Aur hosts a transition disk that includes a highly structured inner disk with multiple spirals (e.g., Boccaletti et al., 2020; Jorquera et al., 2022) and a cavity with an outer edge at 156 AU (Francis & van der Marel, 2020). Several spiral structures have been identified in the inner disk and their presence has been attributed to ongoing planet formation (Fukagawa et al., 2004; Oppenheimer et al., 2008; Boccaletti et al., 2020). Specifically, Tang et al. (2017) identified two spirals in high-resolution ALMA 12CO emission observations and suggested that the spiral morphology could be explained by tidal disturbance caused by a companion located at 60 to 80 AU ( to angular separation) and a position angle (P.A.). Recently, Currie et al. (2022) presented evidence for an embedded protoplanet, referred to as AB Aur b, in visible and infrared images near the location predicted by Tang et al. (2017). In this Letter, we report results from two epochs of HST/WFC3 F656N (H) high-contrast imaging observations of AB Aur.
2 Observations
2.1 HST Observations
AB Aur was observed by HST/WFC3/UVIS on UT 2022-02-07 (Epoch 1) and 2022-03-28 (Epoch 2) for three (Orbits 1 to 3) and two orbits (Orbits 4 and 5), respectively. A 0.5-pixel (20 mas), four-point-box dithering strategy was adopted in all five orbits to enable the reconstruction of Nyquist-sampled images. In every orbit, HST sequentially pointed at each position and took eleven identical 2.7 s exposures in the F656N filter (H narrow-band; , ). The exposures were captured by the c512c subarray, which has a native pixel scale of 40 mas and a field of view of . Due to guide star acquisition failures, the first frame of Epoch 1 and the first two frames of Epoch 2 did not acquire the target. We discarded these images in our analysis. In total, the HST observations comprised 217 raw frames, amounting to 586 s of on-source exposure time.
HST’s roll angles (the V3 axis orientation) were , , , , and in Orbits 1 to 5, respectively. The angular differentials between any two distinct roll angles are , , and . At a separation of , these correspond to spatial displacements of 108, 149, and 262 mas, or 1.6, 2.2, and 3.7 times the full width at half maximum (FWHM) of the F656N point spread function (PSF), respectively. These large azimuthal displacements enable the use of angular differential imaging (ADI, e.g., Marois et al. 2006) to subtract the PSF of the host star between any pair of images with different telescope rolls.
The 2022-03-28 observations were a repeat of the first and third orbits of the 2022-02-07 observations that suffered from a fine-guiding sensor failure resulting in 0.1 to 0.3 pixel pointing errors. This issue impairs image reconstruction accuracy at small scales () but is not detrimental to this study. Therefore, we present results from all five orbits.
2.2 High-resolution Spectroscopy of AB Aur
The HST images do not constrain the continuum or resolve the H line. To precisely characterize the H emission from the host star, we obtained an optical échelle spectrum of AB Aur using the Tull Coudé spectrograph (Tull et al., 1995) on the 2.7-m Harlan J. Smith Telescope at McDonald Observatory on UT 2019-09-26. The exposure time was 600 s and conducted with a slit, resulting in a resolving power of and a wavelength span from to in a total of 56 orders. The wavelength calibration was carried out with a ThAr emission lamp spectrum.
The Tull spectrum is reduced with a custom pipeline. We adopt the order that spans from to and contains the H line. The spectrum is normalized by the continuum determined by the best-fitting fifth order polynomial of the line-excluded region ( or ). We compute the synthetic photometry in the F656N filter using the pysynphot package and find that the band-average flux is 2.58 times of the continuum.
3 Data Reduction
Our data reduction starts with the flc files downloaded from the HST archive. The nominal bias, dark, flat field calibrations, as well as charge transfer efficiency correction are performed by the CalWFC3 pipeline. We first identify cosmic-ray (CR) affected pixels using the data quality flag (DQ=1024) and replace these pixels with two-dimensional linear interpolations of the respective neighboring pixels. Every set of four-point dithered and CR-corrected frames are processed by a Fourier-interlacing pipeline (Lauer, 1999; Zhou et al., 2021) to construct one finer sampled image. This pipeline is optimized for point-source PSFs and distinct from the drizzling method that is part of the regular data reduction performed at STScI.
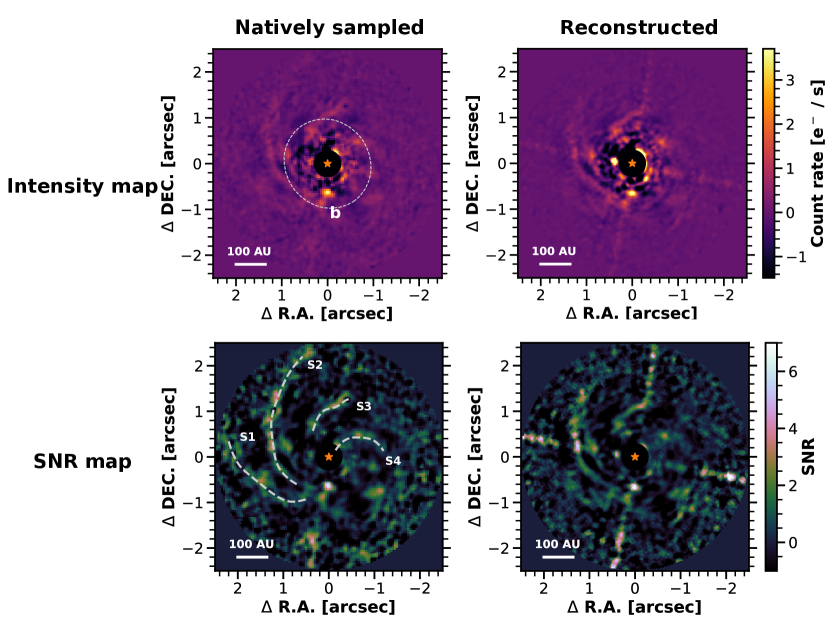
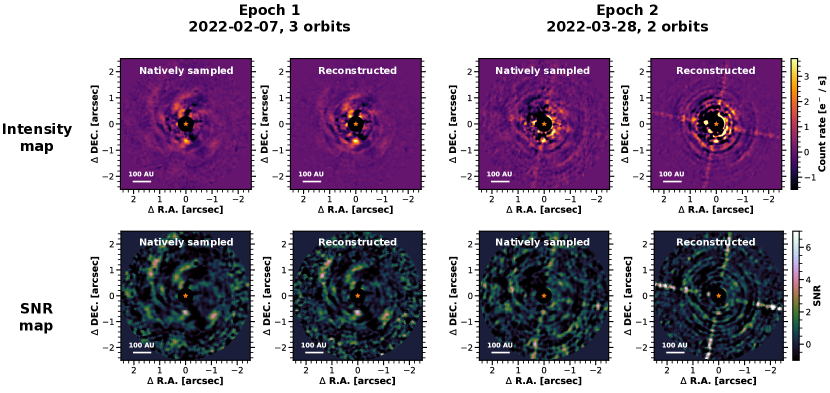
We then independently perform a complete set of primary subtraction procedures on the natively sampled (pixel scale mas) and reconstructed (pixel scale mas) image sets. First, the image cube is registered by the primary star centroids determined by the photutils package’s centroid_2dg function (Robitaille et al., 2013). Then, the images are split into two annuli that have inner/outer radii of and , respectively. We subtract the host star PSF in each annulus using the Karhunen-Loève Image Projection (KLIP, Soummer et al. 2012) algorithm with a custom pipeline. For each image, all frames obtained at a different roll angle are used as references and the number of KLIP components is equal to the number of reference frames. We have also experimented with limiting the KLIP components to 5, 10, and 15 and find that the variation has negligible effect on the subtraction results. After primary subtraction, we rotate all frames to align their -axes to the true north and co-add the aligned frames to form the final image. The co-adding step is also performed for the two epochs individually. In total, we create six primary-subtracted images for two pixel scales each with three sets of co-adds (the combined set: Figure 1; individual epochs: Figure 2).
We convert the primary-subtracted images into signal-to-noise ratio (SNR) maps for point-source detections. The SNR is defined as the ratio between the flux integrated in a 1 FWHM radius aperture and the standard deviation of fluxes along the remaining azimuthal region sampled by non-overlapping apertures. Biases induced by small-number statistics were corrected based on Mawet et al. (2014). The SNR maps are shown in Figures 1 and 2 under the respective primary-subtracted images. Substantial residuals appear near the diffraction spikes in the reconstructed images, which are related to the telescope pointing errors.
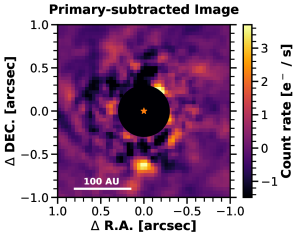
A point-like source emerges in every PSF-subtracted image at an identical location mas south of the primary star. We apply the KLIP forward modeling method (Pueyo, 2016) on the natively sampled images to precisely determine the astrometry and photometry of this source and correct measurement biases introduced by primary subtraction. Synthetic WFC3 UVIS2 F656N PSFs are generated with the TinyTim package (Krist et al., 2011) as the point-source model. We inject a negative-flux PSF to the original frames and optimize the P.A., separation, and flux of the injection so that the residual sum of squares in a 3-pixel radius circular aperture minimizes.
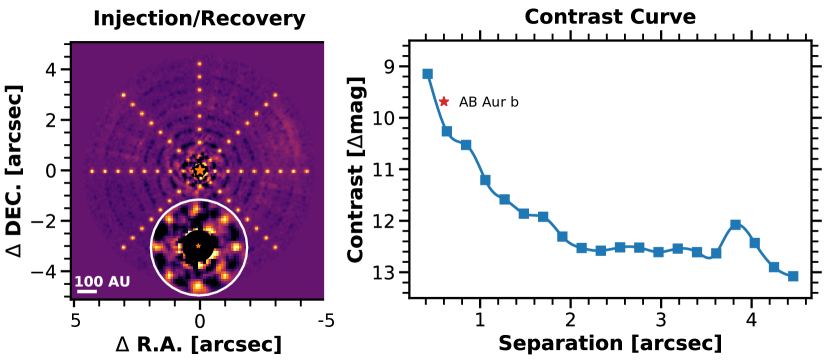
To estimate the astrometric and photometric uncertainties, as well as the KLIP throughput, we conduct injection-and-recovery tests on the natively sampled images. Positive-flux TinyTim PSFs are injected at P.A.s of , , , and spanning eight equal-interval separations between and (Figure 3). These PSFs have the same flux as the point-like source. We subtract the primary PSF and then measure the positions and fluxes of the injected sources. At a specified separation, the average ratio between the injected and recovered fluxes is adopted as the throughput, and the standard deviations of the recovered fluxes, P.A.s, and separations are adopted to be the photometric and astrometric uncertainties.
Figure 3 includes the contrast curve that characterizes our detection sensitivity at angular separations spanning to . In deriving the contrast curve, we calculate the mean and standard deviation of the fluxes in non-overlapping 1-FWHM-radius apertures centered at a given separation. At 600 mas, the resolution element containing the detected point source is excluded. We follow the SNR definition in Mawet et al. (2014) to convert the mean and standard deviation into a flux corresponding to and normalize this value by the flux of AB Aur. Finally, we divide the contrast by the KLIP throughput determined by positive PSF injections (Figure 3) to correct for flux loss in primary subtraction.
4 Results
We detect a point-like source near AB Aur in the primary-subtracted image (Figure 4). In the natively sampled frames, the detection SNRs are 5.4, 3.8, and 6.4 in Epoch 1, Epoch 2, and the combined image, respectively; in the reconstructed images, the SNRs are 5.6, 4.4, and 7.8. The consistent results in natively sampled and reconstructed images, as well as in individual epochs, further strengthen the confidence in the detection. The source is located at a separation of mas ( AU in projected physical distance) away from AB Aur with a P.A. of . This position is consistent with the protoplanet candidate AB Aur b reported in Currie et al. (2022). Photometry on the combined image yields /s, corresponding to a band-averaged flux density of mJy or erg/s/cm2/Å. Fitting a 2D Gaussian to the source yields a FWHM of 150 mas in the tangential direction and 127 mas in the radial direction, which are 2.1 and 1.8 times the FWHM of a F656N PSF. The FWHMs of recovered artificial companions are between 85 to 120 mas. The larger size of the detected source suggests it may trace slightly extended emission.
The H emission from the companion is consistent between the two epochs separated by 50 days, but our constraint on variability is weak. Photometric results of the individual epochs are /s and /s. The corresponding flux densities are mJy and mJy or erg/s/cm2/Å and erg/s/cm2/Å. Based on the joint flux uncertainty between the two epochs, we reject variability with amplitude greater than 50%. Using the same HST images, we precisely determine the H variability of the star AB Aur to be , consistent with the known variability of the host star (Harrington & Kuhn, 2007; Cody et al., 2013).
Four spiral-like scattered-light features are detected at values between 2 to 3. In Figure 1, we mark these structures as S1 to S4. These spiral features have all been previously identified in high-contrast imaging observations of AB Aur (e.g., Fukagawa et al., 2004; Boccaletti et al., 2020). Notably, the leading knots of S1 and S2 point towards the position of the point-like source.
We do not detect any sources at or reported in Currie et al. (2022). The upper limits in our combined WFC3 frames are mJy and mJy, respectively, and are 4.8 and 22 times the flux measured by HST/STIS (Currie et al., 2022). Therefore, our observations do not have sufficient sensitivity to determine the nature of the two sources.
5 Discussion
Rings and spirals in transition disks may introduce ambiguous protoplanet signals in high-contrast imaging observations. Emission from these structures may appear clumpy and even point-like after PSF-subtraction (Follette et al., 2017; Rameau et al., 2017). For example, the protoplanet candidates LkCa 15 bcd (Kraus & Ireland, 2012; Sallum et al., 2015) and HD 100546 bc (Currie et al., 2015) were later found to be consistent with disk features (LKCa 15: Currie et al. 2019; HD 100546: Follette et al. 2017 and Rameau et al. 2017). Because H emission from an accreting planet distinguishes the planet from the disk in their spectral energy distributions (SED), H images can provide an independent way of identifying protoplanets. For PDS 70 b and c, their H flux densities are over 100 times that of the estimated optical continuum, which help confirm these objects as accreting protoplanets. In contrast, in the HD 100546 case, non-detections of H-emitting point sources call into question the candidates as accreting protoplanets (Follette et al., 2017; Rameau et al., 2017). For AB Aur b, Currie et al. (2022) presented several lines of evidence to support the protoplanet identification: orbital motion has been detected, and the source’s spectrum and polarimetric intensities differ from the rest of the disk. However, the companion resides in a region of extended scattered light and photospheric features appear to be absent in the SED (Currie et al., 2022). Below, we discuss whether the H detection adds support to the protoplanet interpretation.
The H emission at the position of AB Aur b has been detected by Subaru/VAMPIRES (Currie et al., 2022) and HST/WFC3 (this work). However, it is unclear whether the VAMPIRES detection is physically associated with AB Aur b due to uncertainties in the instrument’s astrometric calibration (Currie et al., 2022). The astrometry of the WFC3 detection is well-calibrated and consistent with measurements in other bands. Therefore, we only adopt the WFC3 measurement for this discussion. The WFC3 band-averaged H flux density of mJy is higher than the optical continuum measured by HST/STIS ( mJy; m, m) and Subaru/VAMPIRES ( mJy; m), but the difference is moderate to marginal, respectively. The line-to-continuum flux ratio (defined as the band-averaged F656N flux divided by the continuum flux) is or , depending on whether the STIS or the VAMPIRES flux is adopted for the continuum, much lower than the flux ratios estimated for the PDS 70 planets, as well as several accreting planetary mass companions (Zhou et al., 2014; Eriksson et al., 2020; Stolker et al., 2021). AB Aur b’s low line-to-continuum flux ratio is inconsistent with the accretion shock models that explains the observations of PDS 70 b and c (e.g., Aoyama et al., 2018), which produce pronounced H lines. As a result, the H detection does not strengthen the interpretation that AB Aur b is an accreting protoplanet.
If the observed H emission is indeed from an accretion shock, the shock also produces strong optical continuum emission that reduces the line-to-continuum flux ratio. Follow-up characterization of this source to measure ultraviolet and optical excess emission would provide useful comparisons to model SEDs and enable a diagnosis of the accretion shock interpretation (e.g., Zhu, 2015). Assuming that the observed F656N flux is entirely produced by the accretion shock of AB Aur b, we can determine the instantaneous mass accretion rate of the protoplanet based on the observed H luminosity. Adopting a line-of-sight extinction of mag (the same as the star, Garcia Lopez et al. 2006) and assuming no additional extinction opacity, we find a H line luminosity of . At this , gas in the accretion flow should not lead to significant absorption (Marleau et al., 2022). The value corresponds to a total accretion luminosity of by assuming the planetary surface shock model (Aoyama et al., 2018; Aoyama et al., 2021) or using the empirical relation for classic T Tauri stars (Alcalá et al., 2017), respectively. Adopting a planetary mass of and radius of (Currie et al., 2022), these accretion luminosities can be translated to mass accretion rates of between and . These estimates roughly agree with the result obtained from SED fitting (Currie et al., 2022).
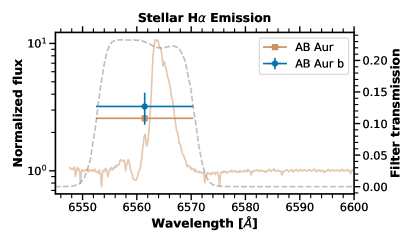
Alternatively, the observed H flux can also be stellar light scattered by a compact disk structure or an envelope surrounding the protoplanet. In this case, the optical SED of the candidate protoplanet, which requires additional multi-band photometry to precisely determine, should mimic the SED of the star. Remarkably, the line-to-continuum ratios of AB Aur (2.58) and AB Aur b (, adopting HST/STIS photometry as the continuum) are consistent within (Figure 5, bottom right panel). We note that this agreement might be serendipitous because AB Aur’s H emission is variable (Harrington & Kuhn, 2007) and our comparison is based on asynchronous observations (the stellar spectrum is obtained 15 months earlier than the HST images). Our HST observations do not measure continuum flux and thus cannot simultaneously constrain the stellar line-to-continuum flux ratios. Continuous and simultaneous H monitoring of AB Aur and AB Aur b can help test this scattering scenario. Currie et al. (2022) concluded that the scattered light could not account for the infrared emission, because AB Aur b was undetected in infrared polarized images. If the H flux is scattered light, the disk structure or dust envelope should predominantly scatter at short wavelengths such that scattered stellar emission is only significant in optical bands.
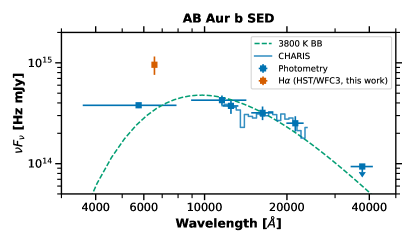
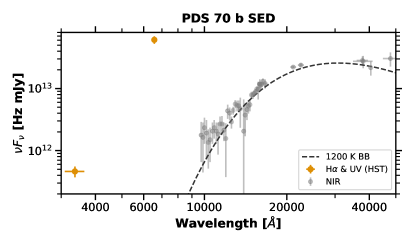
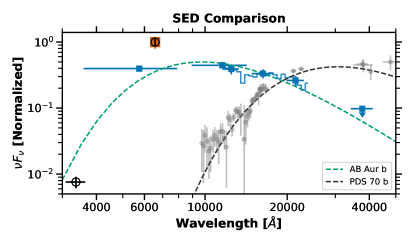
Finally, we emphasize the striking difference in the SED shape between AB Aur b and the PDS 70 planets. In Figure 5, we compare the SEDs of AB Aur b and PDS 70 b and find that AB Aur b is significantly brighter and bluer. Fitting single blackbody models to the SEDs of AB Aur b and PDS 70 b (excluding the H points) yield effective temperatures/radii of 3800 K/1.6 and 1200 K/2.7 , respectively. These results correspond to over 1 dex difference in their bolometric luminosities ( for AB Aur b 333This value is higher than the one () reported by Currie et al. (2022), because we adopted a blackbody rather than a photospheric model SED to calculate . and for PDS 70 b). We can compare the bolometric luminosity of AB Aur b to evolutionary track predictions while safely ignoring contributions from an accreting circumplanetary disk, because the expected disk luminosity is at least one order of magnitude lower444. This is estimated using Equation (5) of Zhu (2015), assuming , (Currie et al., 2022), and . Assuming a hot-start model (e.g., Burrows et al., 1997; Mordasini et al., 2017) and that AB Aur b has a planetary mass (), AB Aur b has to be younger than 3 Myr to have such a high . In contrast, of the PDS 70 planets are consistent with to planets at an age of 5 Myr (Wang et al., 2020; Stolker et al., 2020). Because the isochronal age of AB Aur ( Myr) is older than 3 Myr, the planetary interpretation of AB Aur b and the inferred young age might imply delayed planet formation in the AB Aur disk.
6 Summary
1. We observed the Herbig Ae/Be star AB Aur using HST/WFC3/UVIS in the F656N (H) band in two epochs separated by 50 days. After subtracting the primary-star PSF, we detected a point-like source away from the star in both epochs. In the most optimal reduction, the detection SNRs are 5.6, 4.4, and 7.8 in Epoch 1, Epoch 2, and the combined data-sets, respectively.
2. The P.A. and separation of the companion are and mas relative to the host star. This location is consistent with the astrometry of AB Aur b, a recently reported protoplanet candidate. The candidate companions at separations of and are below our detection limits.
3. The band-averaged H flux densities are , , and erg/s/cm2/Å () or , , mJy () in Epoch 1, Epoch 2, and the combined images, respectively.
4. In comparison to PDS 70 b and c, the H-to-continuum flux ratio of AB Aur b is significantly lower, suggesting that an accretion shock that produces strong H line that has flux density over 100 times the continuum is not visible from AB Aur b. Both planetary accretion and scattered stellar emission from either a compact disk structure or an envelope surrounding AB Aur b can contribute to the H flux, and the origin of the H emission remains unconstrained.
5. Assuming that the observed H emission is entirely powered by accretion onto the protoplanet and there is no gas or dust extinction from the disk nor from the accretion flow itself, we estimate an mass accretion rate of to , depending on the assumed relations. The accretion rate estimate suffers from significant systematic uncertainty due to the unknown origin of the H emission and unconstrained extinction.
The detection of H emission from the candidate protoplanet AB Aur b offers exciting opportunities to understand the mass assembly processes of giant planets forming in a highly structured disk. These interpretations are conditioned on definitively resolving the origin of the H emission. Disentangling the planetary accretion versus stellar scattering of H emission possibilities could not only prove to be crucial in understanding the origin of AB Aur b, but also for the interpretation of future discoveries of protoplanets embedded in the disks of their host stars.
We thank the referee for a constructive report that improves the rigor of the manuscript. We acknowledge excellent observing support from STScI staffs, especially J. Green and A. Armstrong. We thank Thayne Currie for the CHARIS spectrum and Gabriel-Dominique Marleau for helpful comments. Y.Z. acknowledges support from the Heising-Simons Foundation 51 Pegasi b Fellowship. B.P.B. acknowledges support from the National Science Foundation grant 450 AST-1909209, NASA Exoplanet Research Program grant 451 20-XRP20_2-0119, and the Alfred P. Sloan Foundation. This research has made use of the NASA Exoplanet Archive, which is operated by the California Institute of Technology, under contract with the National Aeronautics and Space Administration under the Exoplanet Exploration Program. The observations and data analysis works were supported by program HST-GO-16651. Supports for Program numbers HST-GO-16651 were provided by NASA through a grantfrom the Space Telescope Science Institute, which is operated by the Association of Universities for Research in Astronomy, Incorporated, under NASA contract NAS5-26555.
References
- Alcalá et al. (2017) Alcalá, J. M., Manara, C. F., Natta, A., et al. 2017, A&A, 600, A20
- Aoyama et al. (2018) Aoyama, Y., Ikoma, M., & Tanigawa, T. 2018, ApJ, 866, 84
- Aoyama et al. (2021) Aoyama, Y., Marleau, G.-D., Ikoma, M., et al. 2021, ApJ, 917, L30. doi:10.3847/2041-8213/ac19bd
- Bae et al. (2019) Bae, J., Zhu, Z., Baruteau, C., et al. 2019, ApJ, 884, L41
- Benisty et al. (2021) Benisty, M., Bae, J., Facchini, S., et al. 2021, ApJ, 916, L2
- Boccaletti et al. (2020) Boccaletti, A., Di Folco, E., Pantin, E., et al. 2020, A&A, 637, L5
- Bressan et al. (2012) Bressan, A., Marigo, P., Girardi, L., et al. 2012, MNRAS, 427, 127
- Burrows et al. (1997) Burrows, A., Marley, M., Hubbard, W. B., et al. 1997, ApJ, 491, 856
- Close (2020) Close, L. M. 2020, AJ, 160, 221
- Cody et al. (2013) Cody, A. M., Tayar, J., Hillenbrand, L. A., Matthews, J. M., & Kallinger, T. 2013, AJ, 145, 79
- Currie et al. (2015) Currie, T., Cloutier, R., Brittain, S., et al. 2015, ApJ, 814, L27
- Currie et al. (2019) Currie, T., Marois, C., Cieza, L., et al. 2019, ApJ, 877, L3
- Currie et al. (2022) Currie, T., Lawson, K., Schneider, G., et al. 2022, Nature Astronomy, arXiv:2204.00633
- DeWarf et al. (2003) DeWarf, L. E., Sepinsky, J. F., Guinan, E. F., Ribas, I., & Nadalin, I. 2003, ApJ, 590, 357
- Dodson-Robinson & Salyk (2011) Dodson-Robinson, S. E., & Salyk, C. 2011, ApJ, 738, 131
- Eriksson et al. (2020) Eriksson, S. C., Asensio Torres, R., Janson, M., et al. 2020, A&A, 638, L6. doi:10.1051/0004-6361/202038131
- Follette et al. (2017) Follette, K. B., Rameau, J., Dong, R., et al. 2017, AJ, 153, 264
- Francis & van der Marel (2020) Francis, L., & van der Marel, N. 2020, ApJ, 892, 111
- Fukagawa et al. (2004) Fukagawa, M., Hayashi, M., Tamura, M., et al. 2004, ApJ, 605, L53
- Garcia Lopez et al. (2006) Garcia Lopez, R., Natta, A., Testi, L., & Habart, E. 2006, A&A, 459, 837
- Haffert et al. (2019) Haffert, S. Y., Bohn, A. J., de Boer, J., et al. 2019, Nat. Astron., 3, 749
- Harrington & Kuhn (2007) Harrington, D. M., & Kuhn, J. R. 2007, ApJ, 667, L89
- Hashimoto et al. (2020) Hashimoto, J., Aoyama, Y., Konishi, M., et al. 2020, AJ, 159, 222
- Herczeg & Hillenbrand (2014) Herczeg, G. J., & Hillenbrand, L. A. 2014, ApJ, 786, 97
- Hunter (2007) Hunter, J. D. 2007, Comput. Sci. Eng., 9, 90
- Isella et al. (2019) Isella, A., Benisty, M., Teague, R., et al. 2019, ApJ, 879, L25
- Jorquera et al. (2022) Jorquera, S., Bonnefoy, M., Betti, S., et al. 2022, ApJ, 926, 71
- Keppler et al. (2018) Keppler, M., Benisty, M., Müller, A., et al. 2018, A&A, 617, A44
- Kraus & Ireland (2012) Kraus, A. L., & Ireland, M. J. 2012, ApJ, 745, 5
- Krist et al. (2011) Krist, J. E., Hook, R. N., & Stoehr, F. 2011, in Society of Photo-Optical Instrumentation Engineers (SPIE) Conference Series, Vol. 8127, Optical Modeling and Performance Predictions V, ed. M. A. Kahan, 81270J
- Lauer (1999) Lauer, T. R. 1999, PASP, 111, 227
- Marleau et al. (2022) Marleau, G.-D., Aoyama, Y., Kuiper, R., et al. 2022, A&A, 657, A38. doi:10.1051/0004-6361/202037494
- Marois et al. (2006) Marois, C., Lafrenière, D., Doyon, R., Macintosh, B., & Nadeau, D. 2006, ApJ, 641, 556
- Mawet et al. (2014) Mawet, D., Milli, J., Wahhaj, Z., et al. 2014, ApJ, 792, 97
- Mesa et al. (2019) Mesa, D., Keppler, M., Cantalloube, F., et al. 2019, A&A, 632, A25
- Mordasini et al. (2017) Mordasini, C., Marleau, G.-D., & Mollière, P. 2017, A&A, 608, A72. doi:10.1051/0004-6361/201630077
- Müller et al. (2018) Müller, A., Keppler, M., Henning, T., et al. 2018, A&A, 617, 2
- Oppenheimer et al. (2008) Oppenheimer, B. R., Brenner, D., Hinkley, S., et al. 2008, ApJ, 679, 1574
- Pueyo (2016) Pueyo, L. 2016, ApJ, 824, 117
- Rameau et al. (2017) Rameau, J., Follette, K. B., Pueyo, L., et al. 2017, AJ, 153, 244
- Robitaille et al. (2013) Robitaille, T. P., Tollerud, E. J., Greenfield, P., et al. 2013, A&A, 558, A33
- Sallum et al. (2015) Sallum, S., Follette, K. B., Eisner, J. A., et al. 2015, Nature, 527, 342
- Sanghi et al. (2022) Sanghi, A., Zhou, Y., & Bowler, B. P. 2022, AJ, 163, 119
- Soummer et al. (2012) Soummer, R., Pueyo, L., & Larkin, J. 2012, ApJ, 755, L28
- Stolker et al. (2020) Stolker, T., Marleau, G.-D., Cugno, G., et al. 2020, A&A, 644, A13
- Stolker et al. (2021) Stolker, T., Haffert, S. Y., Kesseli, A. Y., et al. 2021, AJ, 162, 286. doi:10.3847/1538-3881/ac2c7f
- Tang et al. (2017) Tang, Y.-W., Guilloteau, S., Dutrey, A., et al. 2017, ApJ, 840, 32
- Tull et al. (1995) Tull, R. G., MacQueen, P. J., Sneden, C., & Lambert, D. L. 1995, PASP, 107, 251
- van der Walt et al. (2011) van der Walt, S., Colbert, S. C., & Varoquaux, G. 2011, Comput. Sci. Eng., 13, 22
- Virtanen et al. (2020) Virtanen, P., Gommers, R., Oliphant, T. E., et al. 2020, Nature Methods, 17, 261
- Wagner et al. (2018) Wagner, K., Follete, K. B., Close, L. M., et al. 2018, ApJ, 863, L8
- Wang et al. (2015) Wang, J. J., Ruffio, J.-B., De Rosa, R. J., et al. 2015, pyKLIP: PSF Subtraction for Exoplanets and Disks, Astrophysics Source Code Library, record ascl:1506.001, , , ascl:1506.001
- Wang et al. (2020) Wang, J. J., Ginzburg, S., Ren, B., et al. 2020, AJ, 159, 263
- Wang et al. (2021) Wang, J. J., Vigan, A., Lacour, S., et al. 2021, AJ, 161, 148
- Zhou et al. (2014) Zhou, Y., Herczeg, G. J., Kraus, A. L., et al. 2014, ApJ, 783, L17. doi:10.1088/2041-8205/783/1/L17
- Zhou et al. (2021) Zhou, Y., Bowler, B. P., Wagner, K. R., et al. 2021, AJ, 161, 244
- Zhu (2015) Zhu, Z. 2015, ApJ, 799, 16