Molecules with ALMA at Planet-forming Scales (MAPS). A Circumplanetary Disk Candidate in Molecular Line Emission in the AS 209 Disk
Abstract
We report the discovery of a circumplanetary disk (CPD) candidate embedded in the circumstellar disk of the T Tauri star AS 209 at a radial distance of about 200 au (on-sky separation of 1.”4 from the star at a position angle of ), isolated via 13CO emission. This is the first instance of CPD detection via gaseous emission capable of tracing the overall CPD mass. The CPD is spatially unresolved with a mas beam and manifests as a point source in 13CO, indicating that its diameter is au. The CPD is embedded within an annular gap in the circumstellar disk previously identified using 12CO and near-infrared scattered light observations, and is associated with localized velocity perturbations in 12CO. The coincidence of these features suggests that they have a common origin: an embedded giant planet. We use the 13CO intensity to constrain the CPD gas temperature and mass. We find that the CPD temperature is K, higher than the circumstellar disk temperature at the radial location of the CPD, 22 K, suggesting that heating sources localized to the CPD must be present. The CPD gas mass is adopting a standard 13CO abundance. From the non-detection of millimeter continuum emission at the location of the CPD ( flux density Jy), we infer that the CPD dust mass is lunar masses, indicating a low dust-to-gas mass ratio of . We discuss the formation mechanism of the CPD-hosting giant planet on a wide orbit in the framework of gravitational instability and pebble accretion.
1 Introduction
One of the best and most direct ways to study planet formation processes is to observe young planets while they are forming. Although this task has long been challenging, the situation is rapidly changing. In particular, recent observations with the Atacama Large Millimeter/submillimeter Array (ALMA) have demonstrated the possibility of detecting young planets by spatially and kinematically resolving the characteristic gas flows around forming planets (see review by Pinte et al., 2022), including localized velocity perturbations associated with planet-driven spirals (Pinte et al., 2018; Casassus & Pérez, 2019) and large-scale meridional flows falling on to planet-hosting gaps (Teague et al., 2019a; Yu et al., 2021).
As a giant planet forms, it opens a radial gap in its natal circumstellar disk (Lin & Papaloizou, 1986). Within the Hill (or Bondi) sphere of the planet, a circumplanetary disk (CPD) forms in order to conserve the angular momentum of the material accreted from the circumstellar disk (Korycansky et al., 1991; Ward & Canup, 2010). The growth of a planet after gap opening is controlled by gas accretion through its CPD (Lubow et al., 1999). CPDs also play a crucial role in satellite formation. Indeed, the prograde, nearly circular and co-planar orbits of regular satellites of Jupiter and Saturn suggest that their formation must have happened within CPDs. Despite their importance, however, many attempts to search for CPDs have yielded non-detections (Isella et al., 2014; Pérez et al., 2019; Pineda et al., 2019; Andrews et al., 2021), and the detections made to date are limited in millimeter continuum observations (Isella et al., 2019; Benisty et al., 2021; Wu et al., 2022). Consequently, fundamental properties of CPDs, such as their sizes (see discussion in Paardekooper et al. 2022) and whether they are indeed rotationally-supported “disks” or instead pressure-supported envelopes (Szulágyi et al., 2016; Fung et al., 2019) are not fully understood.
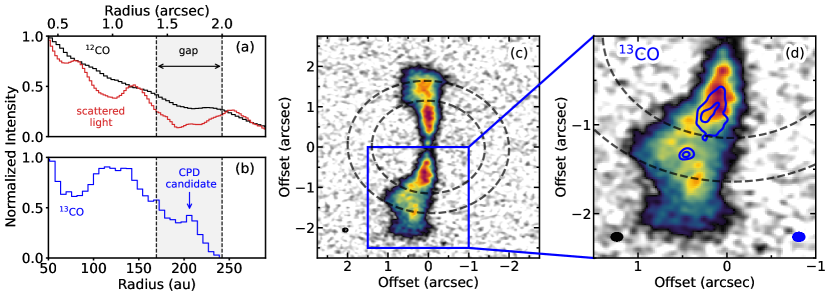
In this Letter, we report the discovery of a CPD candidate embedded in the circumstellar disk of AS 209, identified using 13CO emission. AS 209 is a T Tauri star located in the outskirts of the Ophiuchus star-forming region at a distance of 121 pc (Gaia Collaboration et al., 2020), with a stellar mass of and an age of 1–2 Myr (Andrews et al., 2009; Öberg et al., 2021, and references therein). In (sub-)millimeter continuum emission, the AS 209 disk is au in size and has pronounced multiple concentric rings and gaps (Fedele et al., 2018; Huang et al., 2018; Guzmán et al., 2018; Sierra et al., 2021). Hydrodynamic planet-disk interaction simulations showed that the continuum gaps can be explained by one or more planets embedded in the disk (Fedele et al., 2018; Zhang et al., 2018). The gas disk probed by 12CO emission extends to au, much further out than the continuum disk (Guzmán et al., 2018). In 12CO an annular gap is seen centered at a radius of 200 au, sandwiched by two bright rings whose intensities peak at 168 and 245 au (Guzmán et al., 2018; Law et al., 2021a). Near-infrared scattered light observations also revealed this gap around 200 au (Avenhaus et al., 2018). This 12CO and near-infrared gap at 200 au is within which the CPD candidate is found in this study.
This Letter is organized as follows. In Section 2, we summarize the observations. In Section 3, we present the 12CO data, which reveals an annular gap and localized kinematic perturbations, and the 13CO data, which shows a CPD candidate. We also present a null detection of C18O and continuum emission at the location of the CPD candidate. In Section 4, we place constraints on the size, temperature, and mass of the CPD, and discuss the potential formation pathway of the planet. We summarize our findings and state our conclusions in Section 5.
2 Observations
The 12CO, 13CO, and C18O data used in this study were obtained as part of the ALMA Large Program Molecules with ALMA at Planet-forming Scales (MAPS; 2018.1.01055.L; Öberg et al. 2021). We refer the reader to Öberg et al. (2021) for the observational setup and calibration process, and Czekala et al. (2021) for the imaging process including the Jorsater & van Moorsel (1995, hereafter JvM) correction, which is used to properly scale the CLEAN residual map into consistent units of Janskys per CLEAN beam (instead of Janskys per dirty beam) and is crucial for correctly estimating the flux density of faint extended emission. Throughout this paper, we use the robust = 0.5 weighted, JvM-corrected images111Publicly available from https://alma-maps.info/data.html unless stated otherwise. The 12CO, 13CO, and C18O images have synthesized beam sizes of mas, mas, and mas with position angles of , , and , respectively. The rms noise measured in line-free channels is , , and , respectively.
While the JvM correction allows the CLEAN model and residual image to have consistent units, Casassus & Carcamo (2022) cautioned that it may exaggerate the peak signal-to-noise ratio of restored images. As such, we carry out our analyses using both JvM-corrected images (presented in the main Sections) and JvM-uncorrected images (presented in the Appendix) in order to ensure that the CPD detection is statistically significant regardless of which image we use.
For the analysis of continuum data, we combined the continuum data from ALMA Large Programs MAPS and Disk Substructures at High Angular Resolution Project222In Andrews et al. (2018), the continuum data obtained as part of the DSHARP program was combined with archival data from programs 2013.1.00226.S (Huang et al., 2016) and 2015.1.00486.S (Fedele et al., 2018). (DSHARP; 2016.1.00484.L; Andrews et al. 2018), using CASA version 6.4. We refer the reader to Sierra et al. (2021) for the imaging of the MAPS continuum data and Andrews et al. (2018) for the observational setup and calibration process of the DSHARP continuum data. To account for any source proper motions or atmospheric/instrumental effects between observations, we aligned each dataset to a common phase center using the fixvis and fixplanets tasks to apply the necessary phase shifts. We then made a composite image at 240 GHz, the mean frequency of the DSHARP and MAPS continuum data. The continuum image was generated with a Briggs weighting scheme with robust = 0.5 and a mas FWHM Gaussian taper (at PA = 0°) in order to enhance the point source sensitivity near the location of the CPD candidate. The synthesized beam has FWHM of mas at a position angle of degrees. We find that the PSF of the combined data is complex due to the combined coverage of the datasets. For that reason, we do not perform the JvM correction on the continuum data. The rms noise within an elliptical annulus around the radial location of the CPD candidate (i.e., between and in the deprojected plane) is .
The DSHARP and MAPS observations were taken about two years apart. Between the two observations, the CPD candidate is expected to have moved about 8 mas on the sky, less than of the synthesized beam of the combined continuum data. We thus opt not to account for the orbital motion of the CPD candidate.
3 Results
3.1 An Annular Gap and Localized Kinematic Perturbations in 12CO
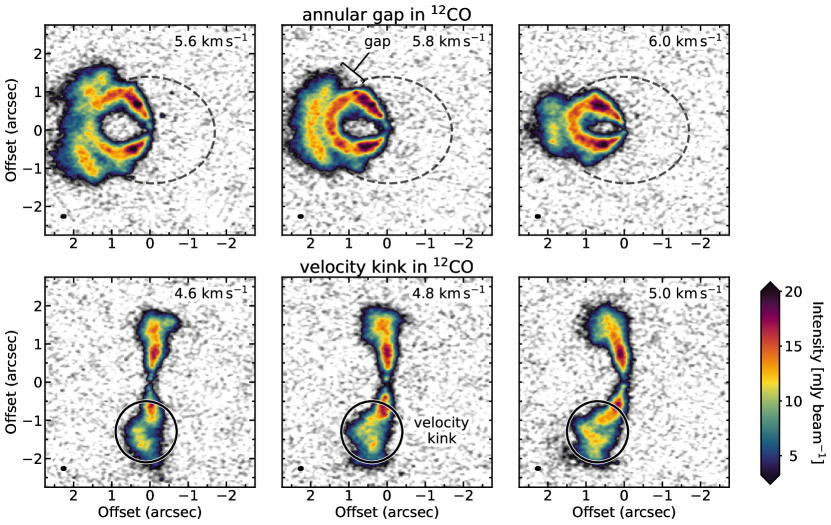
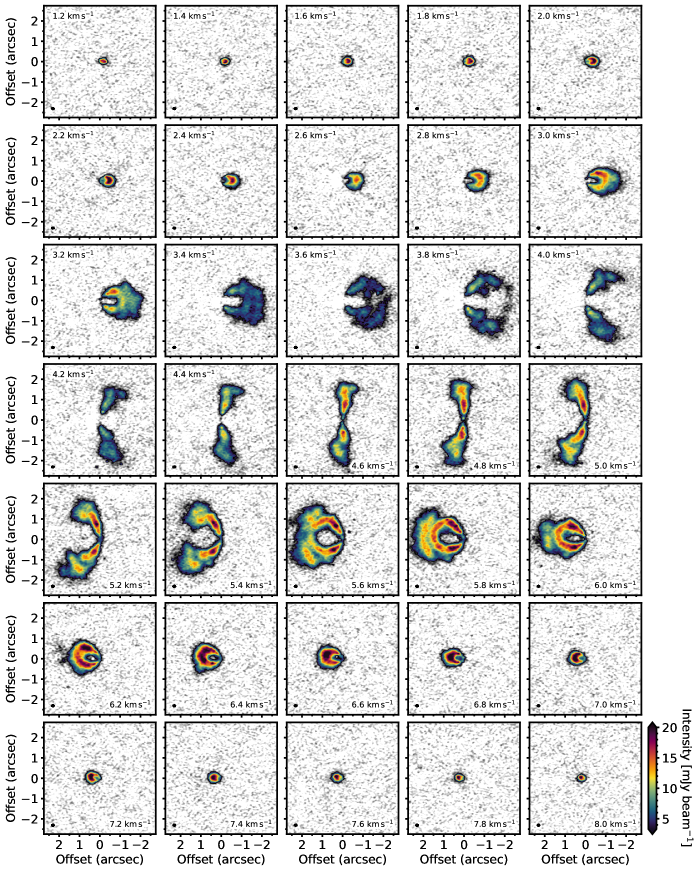
We present selected 12CO channel maps in Figure 1 (see Figure 7 in Appendix A for additional channel maps). The 12CO emission reveals a 78 au-wide gap (determined by the distance between the adjacent peaks in the radial intensity profile; Law et al. 2021a) around au, which is most clearly seen along the semi-major axis of the disk (see in Figure 1). The radial location of the gap is consistent with what is previously reported in Guzmán et al. (2018) and Teague et al. (2018) using independent 12CO datasets, and in Avenhaus et al. (2018) using near-infrared scattered light images. Teague et al. (2018) showed that the 12CO gap is associated with deviations in the rotational motion of the gas with variations of up to relative to the background Keplerian rotation, which arises from the steep radial gas pressure gradient at the edges of the gap. While we defer more comprehensive kinematic studies to a forthcoming paper (Galloway-Sprietsma et al., in prep.), comparable rotational velocity deviations are found around the 12CO gap using the MAPS 12CO data.
In addition to the annular gap, 12CO reveals a strong localized (both in space and velocity) perturbation on the southern side (see in Figure 1), reminiscent of a so-called velocity kink induced by planets (Pinte et al., 2018). Similar velocity perturbations are found at the same location and velocity in independent archival 12CO datasets presented in Guzmán et al. (2018) and Teague et al. (2018). The velocity perturbation is seen near the semi-minor axis of the disk, suggesting that the perturbation is associated with radial and/or vertical motions rather than rotational motions (Teague et al., 2019b). We note that a similar velocity perturbation is not seen on the northern side of the disk, highlighting the localized nature of the perturbation.
3.2 Point Source Emission in 13CO
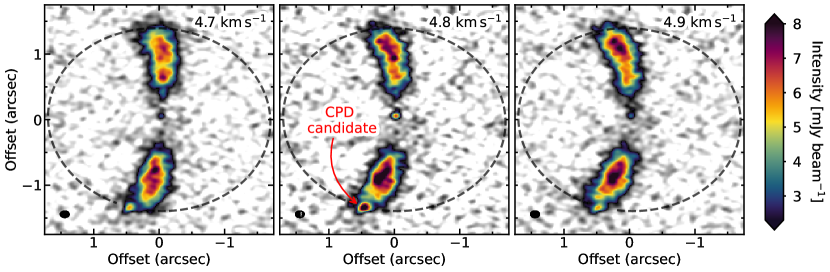
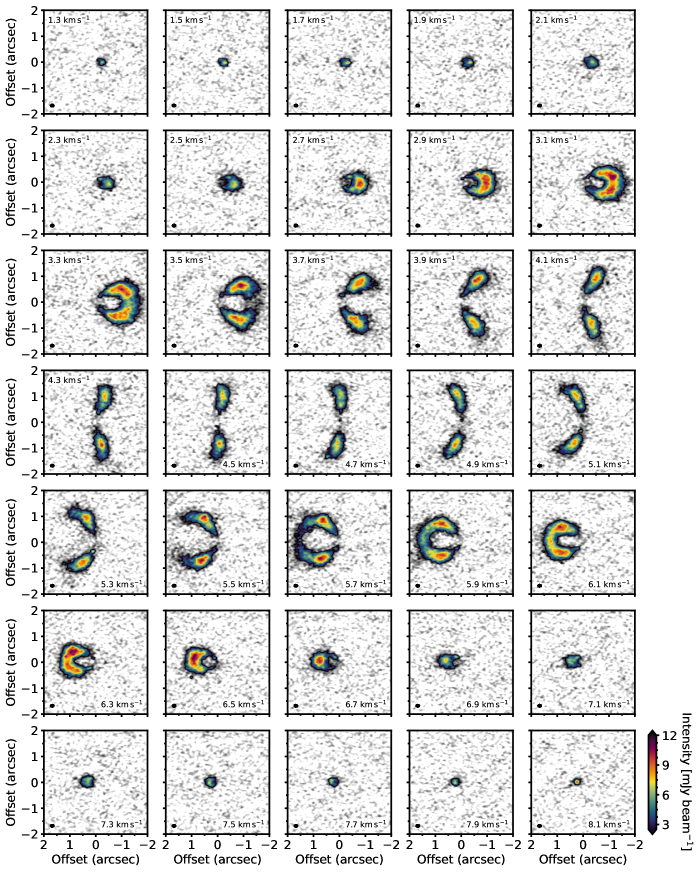
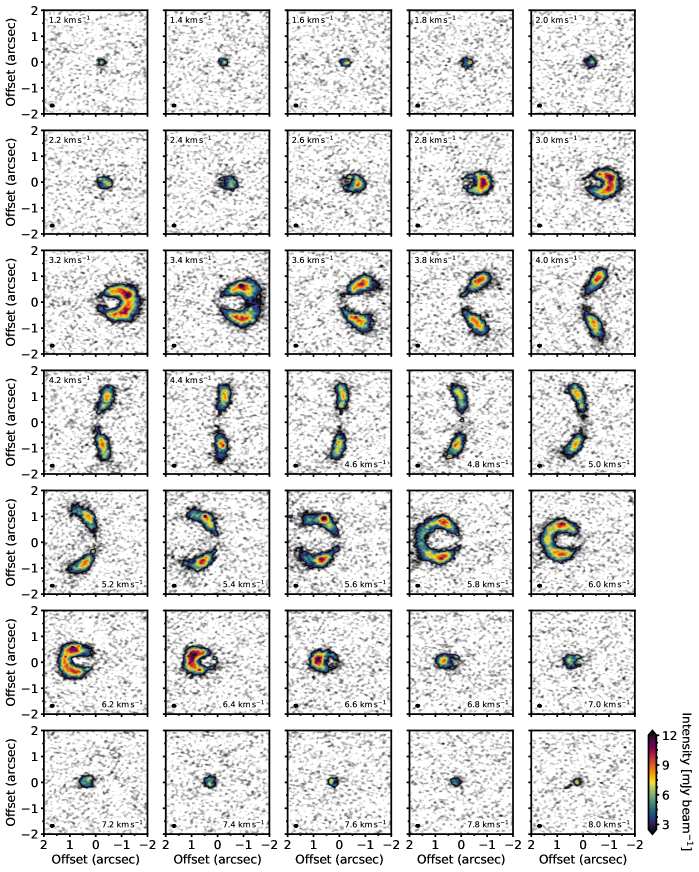
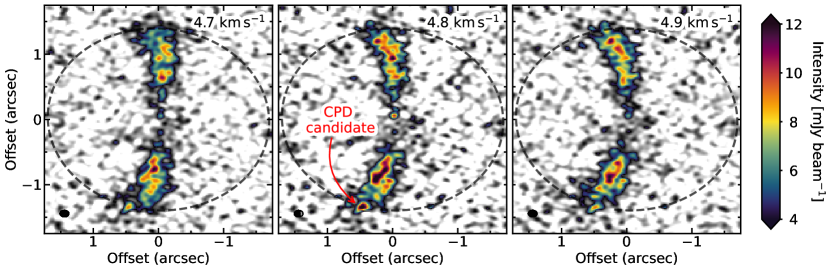
Figure 2 presents selected 13CO channel maps (see Figures 8 and 9 in Appendix A for additional channel maps). In addition to the characteristic butterfly pattern arising from Keplerian rotation of the AS 209 disk, we find a point source emission at a projected distance of and a position angle of (east from north). The offset from the star (assumed to be at the center of the concentric continuum rings) is . Assuming that the point source is embedded in the midplane of the AS 209 disk, the deprojected distance between the point source and the central star is ( au). It is worth pointing out that the 13CO point source is located at the center of the 12CO annular gap and is coincident in both radius and azimuth with the localized velocity perturbations seen in 12CO. In Section 4.1, we will discuss the potential (common) origin of these features.
The 13CO data is limited by the velocity resolution set by the MAPS program. In the fiducial image cube, the point source is found in two adjacent channels, (Figure 2 left) and (Figure 2 right). The peak intensities at the two channels are 5.75 and , respectively. While we cannot image at a finer channel spacing than the velocity resolution, we produce an additional image cube with the same channel spacing of , but with the starting velocity offset by half of the velocity resolution (). The middle panel in Figure 2 shows the channel map at from the half-channel-shifted image cube. The point source is more clearly seen, with the peak intensity of (rms noise ). Simply comparing the peak intensity with the rms noise, the point source in the three velocity channels is detected above 12, 18, and levels, respectively.
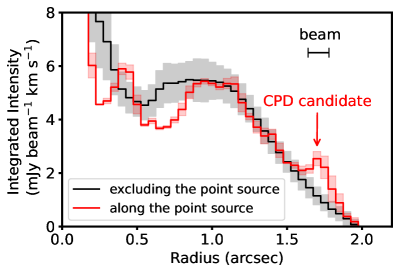
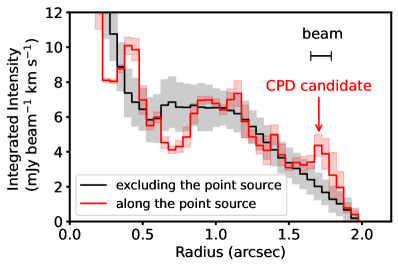
Although the 13CO emission from the AS 209 disk is less extended than the 12CO emission, 13CO emission is detected out to (in deprojected distance), beyond the radial location of the point source. If the point source is embedded in the midplane within the 12CO gap, it is thus possible that some of the emission toward the point source originates from the residual gas within the gap. To assess the potential contamination from the gas in the gap, in Figure 3 we present a radial profile of the integrated intensity averaged over the azimuthal region around the point source. We compare that to an azimuthally-averaged, radial integrated intensity profile excluding the region around the point source. At the deprojected radial distance of , the integrated intensity of the point source is , while the integrated intensity excluding the point source is with a standard deviation of .
The brightness temperature of the 13CO emission within the gap (excluding the point source) is K. For a reasonable gas temperature of K (so that CO does not freeze), the gap must be optically thin () because the brightness temperature is lower than the gas temperature. The fact that the integrated intensity toward the point source does not increase with the beam size (see Appendix B) further supports that the gap is optically thin in 13CO and the point source dominates the emission. If we assume that a similar amount of gas is present around the point source to elsewhere within the gap, the contamination from the gas in the gap is thus expected to be (because only half of the gas in front of the point source would contribute). Subtracting this from the integrated intensity toward the point source, we find that the point source is detected at a significance. We carry out the same analysis using the JvM-uncorrected image and find that the point source is detected at a significance (see Appendix C).
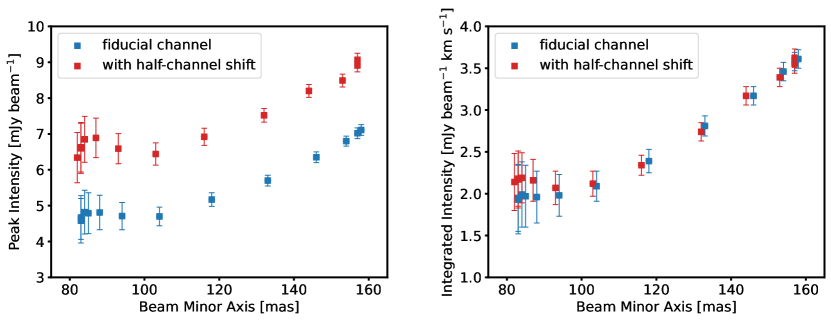
In order to determine whether or not the point source is spatially resolved, we follow Isella et al. (2019) and Benisty et al. (2021) and image the data using various robust parameters ranging from to 2. The synthesized beam size, rms noise, Gaussian fit to the point source emission are summarized in Appendix B and Tables 1 and 2. We find that the peak and integrated intensities are constant within uncertainties when the semi-minor axis of the beam is mas, indicating that the point source is spatially unresolved at those scales. For larger beam sizes, the peak and integrated intensities increase since the point source is no longer spatially separated from the AS 209 disk.
3.3 Null Detection in C18O and Continuum
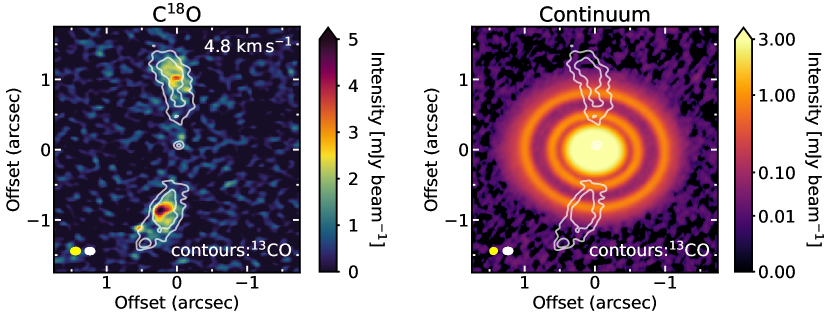
In Figure 4, we present C18O emission at and the continuum image. No C18O emission at a significance is detected at the location of the 13CO point source. Similarly, no emission coincident with the 13CO point source is detected at a significance in the continuum image. We further inspected the continuum data by modeling the continuum emission in the visibility plane following Andrews et al. (2021), but no point source emission coincident with the 13CO point source (and elsewhere) is found. In Section 4.2, we place upper limits on the CPD gas and dust masses based on the null detection of C18O and continuum emission.
4 Discussion
4.1 Origin of the 13CO Point Source
We find that the 13CO point source lies at the center of the 12CO gap and that it is colocated with the 12CO velocity kink (Figure 5). The coincidence suggests that the most likely explanation is that we are witnessing a planet and its CPD embedded in the AS 209 disk. In fact, the compact nature of the 13CO emission separated from the circumstellar disk bears a striking resemblance to what is predicted in numerical simulations of a CPD embedded in a circumstellar disk presented in Perez et al. (2015). There is no obvious counterpart of the 13CO point source in 12CO, but this is likely because the annular gap is optically thick in 12CO. Similarly, we do not find a counterpart of the 12CO velocity kink in 13CO or C18O due to their low optical depth within and beyond the circumstellar disk gap (see e.g., Figure 5d).
Recent numerical simulations have shown that circumplanetary materials form a rotationally-supported disk when the cooling is efficient, but when cooling is inefficient, a pressure-supported envelope is instead formed (Szulágyi et al., 2016; Fung et al., 2019). The point source is spectrally unresolved in the existing dataset, and whether the emission is associated with a disk or an envelope has to be confirmed in the future using high velocity resolution molecular line observations that can probe the kinematics of the point source. For the rest of this paper, we opt not to distinguish between circumplanetary disk and envelope, but simply use the term CPD to refer to the two collectively.
What is the mass of the planet candidate? We can estimate the planet mass using the empirical relation between the gap width and planet mass derived from numerical simulations. The width of the gap, determined by the distance between the adjacent peaks in the 12CO radial intensity profile, is 78 au (Law et al., 2021a). The scaling relation between the gap width normalized by the planet’s orbital semi-major axis , disk aspect ratio , disk viscosity , and planet mass suggests (Kanagawa et al. 2016, see also similar relations in e.g., Zhang et al. 2018; Yun et al. 2019). Adopting the disk aspect ratio at the midplane from the circumstellar disk temperature constrained using CO isotopologues (Law et al., 2021b), converts to a planet mass of . The inferred mass is comparable to those suggested to explain velocity kinks in other circumstellar disks (e.g., Pinte et al., 2018, 2019).
4.2 Properties of the CPD
4.2.1 CPD size and temperature
As shown in Appendix B, the CPD is spatially unresolved. When the CPD is optically thick and the disk gas is in local thermodynamic equilibrium (LTE), the actual CPD gas temperature, (assumed to be uniform across the CPD for simplicity), and the observed brightness temperature of the CPD, , are related as where is the beam dilution factor333Here, we assume that the gap is optically thin in 13CO (see Section 3.2) and ignore attenuation of the CPD emission by the residual gas in the circumstellar disk gap. The inferred CPD temperature thus offers a lower limit to the actual CPD temperature.. Adopting a thin disk geometry, the beam dilution factor is given by
| (1) |
where is a dimensionless parameter introduced to account for the fraction of the emitting area in a given velocity channel compared to the full geometric area of the CPD (see below), is the diameter of the CPD, is the inclination of the CPD, and are the semi-major and semi-minor axis of the synthesized beam, respectively. We can then relate the temperature and diameter of the CPD as
| (2) |
Without the knowledge of the emitting area we opt to adopt , although it is reasonable to expect because the channel spacing of the data () is smaller than the FWHM of the line emission arising from the CPD (; see Tables 1 and 2). With , our analysis thus offers a lower limit to the CPD temperature. We use the brightness temperature in the channel ( K) since it is likely that the channel contains the largest emitting area. We adopt (Öberg et al., 2021) assuming that the CPD and AS 209’s circumstellar disk are co-planar.
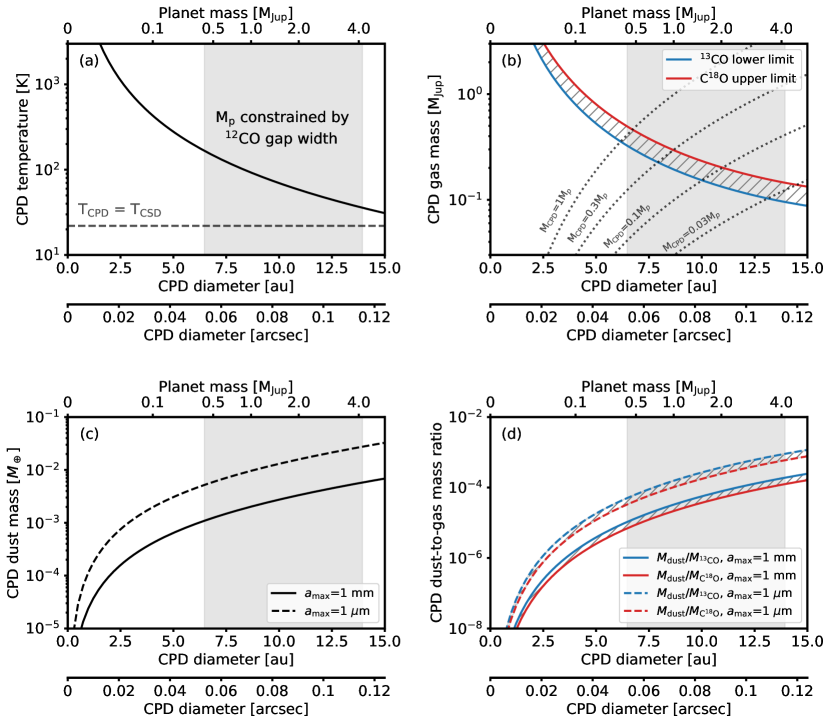
Figure 6a shows the CPD temperature required to explain the observed 13CO emission as a function of the CPD diameter, calculated with Equation (2). We note again that the CPD temperature in Figure 6a presents a lower limit because a higher CPD temperature is needed to explain the observed 13CO emission (1) when attenuation by the gas in the circumstellar disk gap is not negligible, (2) when the emitting area in the central channel is smaller than the full geometric area of the CPD (), and/or (3) when the CPD is optically thin. We find that the CPD temperature is K, higher than the circumstellar disk gas temperature at the radial location of the CPD, 22 K (Law et al., 2021b). This suggests that additional heating sources localized to the CPD are required to explain the observed 13CO emission, such as planet’s thermal/accretion heating, the CPD’s internal viscous/turbulent heating, or shock/compressional heating by infalling circumstellar disk material (Szulágyi et al., 2016; Szulágyi & Mordasini, 2017).
In the discussion above (and also below in Section 4.2.2), we assume that the CPD and AS 209’s circumstellar disk are co-planar. This is a reasonable assumption to start, but numerical simulations show that it is possible that CPDs and their parent circumstellar disk can be misaligned if the planet is formed in a turbulent environment (Jennings & Chiang, 2021). In fact, based on the observationally constrained large obliquity of a planetary mass () companion 2M0122b, degrees, Bryan et al. (2020) proposed that the CPD of 2M0122b would have to be tilted out of the circumstellar disk plane (see also Bryan et al., 2021). For our analysis, the CPD temperature would be minimized when the CPD is face-on (; see Equation 2). However, even when the CPD is face-on we infer the CPD temperature is K, higher than the circumstellar disk temperature, suggesting that additional heating sources localized to the CPD are still required. Future high spatial/velocity resolution observations would constrain the CPD geometry from its rotation, allowing us to place more accurate constraints on the CPD temperature.
4.2.2 CPD mass
For a given CPD size and the corresponding lower limit to the CPD temperature (black curve in Figure 6a), we can place a lower limit to the 13CO mass. This is possible because the upper state energy of the 13CO transition (15.8 K) is below the lower limit of the CPD temperature; the population in the rotational level would always drop if the CPD temperature is higher than the lower limit, requiring a larger CPD mass than for cooler temperatures.
To obtain the total 13CO number density in the CPD, we first calculate the number density of 13CO molecules in the level as
| (3) |
where is the Planck constant, is the spontaneous emission coefficient from molecular data from the LAMDA database (Schöier et al., 2005), is the integrated line intensity, is the distance to AS 209, 121 pc (Gaia Collaboration et al., 2020), and is the solid angle of the beam. We then calculate the total 13CO number density under the assumption that all energy levels are populated under LTE:
| (4) |
where and GHz is the rotational constant (Müller et al., 2005). We convert the 13CO number density to the total gas mass enclosed in the CPD adopting interstellar CO abundance and 13CO-to-12CO abundance ratio (Wilson & Rood, 1994). The resulting CPD mass is presented in Figure 6b. The CPD gas mass is when au, and increases with decreasing CPD size because the population in the level decreases with higher CPD temperature. The CPD-to-planet mass ratio is .
In the discussion above, we assumed a CO-to-H2 ratio inferred from the local interstellar medium (ISM). However, near the radial location of the CPD candidate, CO in the AS 209’s circumstellar disk is inferred to be depleted in the gas phase by about an order of magnitude compared with the local ISM (Zhang et al., 2021). If the CO in the CPD is depleted at a comparable level the CPD-to-planet mass ratio would be , a level at which the CPD may be gravitationally unstable.
We can place upper limits to the CPD gas mass from the null detection of C18O emission () following the same approach to 13CO. To do so, we assume that 13CO and C18O share the same line width () and temperature (presented in Figure 6a). We adopt (Schöier et al., 2005), GHz (Müller et al., 2005), and (Wilson & Rood, 1994). The resulting upper limit to the CPD gas mass is presented in Figure 6b. Interestingly, the null detection of C18O places a tight upper limit that is only about larger than the lower limit obtained with 13CO. When the CPD temperature is larger than the lower limit presented in Figure 6a, both 13CO lower limit and C18O upper limit would increase. However, because the rotational constant of the two lines are comparable, the ratio between the upper limit inferred by C18O and the lower limit inferred by 13CO would remain nearly constant (see Equation 4) and the null detection of C18O would still provide tight constraints.
We can also place constraints on the CPD dust mass from the non-detection of continuum emission (). Adopting the DSHARP dust opacity (Birnstiel et al., 2018) with a maximum grain size of 1 mm ( at 240 GHz) and the CPD temperature constrained as in Figure 6a, the CPD dust mass in the optically thin regime is . If instead the CPD has only small, m-sized grains, (Birnstiel et al., 2018) and the CPD dust mass is . These results are presented in Figure 6c.
Using the constraints on the CPD gas and dust mass, we infer the dust-to-gas mass ratio to be when the maximum grain size in the CPD is 1 mm, and when the maximum grain size in the CPD is 1 m (Figure 6d). This suggests that the CPD is likely lacking dust at a level below that in the typical ISM environment, presumably due to a limited dust supply (recall that AS 209’s continuum disk is confined within the inner au) and/or rapid radial drift of dust within the CPD.
4.3 How Did the Planet Form?
Based on the width of the 12CO gap, we infer that the planet mass is around a Jupiter-mass. How did a giant planet form at an orbital radius of 200 au?
One possibility is that the AS 209 disk was gravitationally unstable in the past and the planet formed via gravitational instability (GI; Boss 1997). Limitations of the GI scenario often mentioned in the literature are that the masses of GI-induced fragments are generally large, often in the regime of brown dwarfs, and that GI-induced fragments suffer from tidal disruption and/or rapid radial migration (Baruteau et al., 2011; Zhu et al., 2012). However, recent magnetohydrodynamic simulations including the disk’s self-gravity have shown that magnetic fields can limit the mass of the GI-induced fragments to a fraction to a few Jupiter masses, and also can prevent fragments from being tidally disrupted (Deng et al., 2021). It is also shown that orbital migration can stall when the planet actively accretes and carves a deep gap (Fletcher et al., 2019).
Despite recent theoretical developments, one challenge to the GI scenario is that the AS 209 disk has a very small mass of (Favre et al., 2019; Zhang et al., 2021). According to the inferred gas surface density profile from Zhang et al. (2021) and the midplane temperature constrained by CO isotopologues from Law et al. (2021b), the Toomre parameter (Toomre & Toomre, 1972) is at all radii in the AS 209 disk with at 200 au, indicating that the disk must be gravitationally stable presently. While it is not impossible that the disk was sufficiently massive in the past, the small present-day disk mass implies that the disk should have lost its mass very efficiently since then.
An alternative to the GI scenario is pebble accretion (Johansen & Lacerda, 2010; Ormel & Klahr, 2010). In order for the pebble accretion scenario to work, a few things have to be reconciled. First, the continuum emission of the AS 209 disk is confined within the inner au presently. How did the core grow and how did the planet not trap millimeter grains beyond its orbit? We propose that in this scenario, the core of the planet never reached the pebble isolation mass (Morbidelli & Nesvorny, 2012) and pebbles could freely drift inward crossing the planet’s orbit. Based on scaling relations from hydrodynamic simulations (e.g., Lambrechts et al., 2014; Bitsch et al., 2018), the pebble isolation mass at 200 au in the AS 209 disk (; Law et al. 2021b) is expected to be , much more massive than the critical core mass of at which point runaway gas accretion can start (Mizuno, 1980). We can thus envision a scenario in which the pebbles that existed beyond the orbit of the core migrated inward, leaving the core behind.
Second, we need to check if there existed sufficient pebbles to form a core of the giant planet. To do so, we first estimate the total mass of pebbles necessary to drift toward the core to grow to following Lambrechts & Johansen (2014). We obtain assuming that the dominant pebble size has a Stokes number of 0.05. The total dust mass in the AS 209 disk is currently about (Sierra et al., 2021), but given that it is very unlikely that all the millimeter grains currently inward of the planet’s orbit were once beyond 200 au, more efficient pebble accretion than the standard pebble accretion model of Lambrechts & Johansen (2014) is likely required. A few possibilities include the presence of pressure bumps (Pinilla et al., 2012) or a vortex that might have formed early on from the infalling flows from the protostellar envelope (Bae et al., 2015), and changes of sticking properties of grains that lead to the traffic jam effect around snow lines (Drkazkowska & Alibert, 2017), which can slow down or even halt the radial drift of grains. In fact, it is interesting to note that the midplane gas temperature at the current radial location of the planet ( K; Law et al. 2021b) is close to the expected CO and N2 freezeout temperature ( K, K; Huang et al. 2018).
Third, we need to make sure that there had been sufficient time for a core to form via pebble accretion. The timescale for pebble accretion to form a core is given by years (Lambrechts & Johansen, 2012). Adopting a critical core mass of , at 200 au the pebble accretion time scale is Myr although, as mentioned earlier, slower radial drift or particle trapping can enhance the pebble accretion efficiency and shorten the required time to form the core. Given that the estimated age of AS 209 is Myr (Andrews et al., 2009; Öberg et al., 2021), the long core accretion timescale might indicate that the planet could have entered the runaway accretion phase in the last Myr. If the planet has been accreting over the last million year or so, the average accretion rate would be , orders of magnitude larger than the accretion rate of PDS 70b and c measured from H line emission (; Wagner et al. 2018; Haffert et al. 2019). Observations of H line can confirm if the planet is indeed undergoing a runaway accretion, although long-term monitoring observations are likely required to distinguish steadily high accretion from episodic burst-type accretion (Lubow & Martin, 2012).
4.4 Future Observational Direction
We conclude the discussion by listing a few future directions from the observational perspective. While we could only place upper/lower limits from the existing data, future higher-level transition observations of 13CO (together with the existing 13CO data) will allow us to determine whether 13CO is optically thick or thin, and thus to place stronger constraints on the CPD temperature. As shown in Figure 6b, the null detection of C18O already placed a tight upper limit to the CPD gas mass that is only about larger than the lower limit inferred by 13CO. Deeper C18O observations (by a factor of in sensitivity assuming that isotope selective photodissociation is not important) should thus detect the CPD and place stringent constraints on the CPD gas mass. The existing data is limited by a velocity resolution and we presently cannot conclude whether the point source emission is consistent with a rotationally-supported disk or a pressure-supported envelope that is potentially heated by an embedded planet (e.g., Alves et al., 2020). Future observations with higher velocity resolution will enable us to distinguish the two scenarios and to dynamically constrain the planet mass from the rotation of the CPD. High spatial/velocity resolution observations will also enable us to constrain the geometry of the CPD (e.g., position angle, inclination) from the disk rotation. Knowing the CPD geometry will allow us to place more accurate constraints on the CPD temperature and mass. In addition, estimating the obliquity of the CPD can help us to better understand the formation mechanism and environment of the CPD-hosting planet, in particular whether the planet had formed in a turbulent environment that would induce large obliquities (see e.g., Bryan et al., 2020; Jennings & Chiang, 2021). The inferred CPD temperature suggests that heating sources localized to the CPD must be present. Such planetary/CPD heating can produce chemical asymmetries in the circumstellar disk, which are shown to be detectable with high-sensitivity molecular line observations using ALMA (Cleeves et al., 2015). Besides additional ALMA observations, future observations in the infrared wavelengths using the James Webb Space Telescope and ground-based telescopes would independently confirm the planet/CPD and allow us to probe the thermal emission from the planet which can help to constrain the mass of the planet. In addition, searching for accretion signatures (e.g., H line emission) would yield invaluable constraints on the current position of the planet in its evolutionary stages.
5 Conclusion
We report the discovery of a CPD candidate in the 13CO emission, embedded in the AS 209 disk at a radial distance of about 200 au. This is the first instance of CPD detection via gaseous emission, allowing us to probe the overall CPD mass. The CPD candidate is located in the middle of an annular gap identified in 12CO and near-infrared scattered light observations, and is associated with localized velocity perturbations in 12CO (see Figure 5). The coincidence of these features strongly suggest that we are witnessing the signature of a giant planet and its CPD embedded in the AS 209 disk.
The CPD is spatially unresolved with a mas beam, indicating that its diameter is au. Based on the 13CO intensity, we were able to constrain the CPD temperature and gas mass. The CPD temperature is K, greater than the circumstellar disk temperature at the midplane of the radial location of the CPD, 22 K (Law et al., 2021b). This suggests that there must be heating sources localized to the CPD in order to maintain the high temperature. Potential sources include planet’s thermal/accretion heating, CPD’s internal viscous/turbulent heating, and shock/compressional heating by infalling circumstellar disk material. The CPD gas mass is , adopting a standard 13CO abundance. Based on the non-detection of continuum emission toward the CPD location, we found that the CPD has of dust. Together with the inferred gas mass, this indicates a low dust-to-gas mass ratio of within the CPD, presumably due to a limited dust supply to the CPD and/or rapid radial drift of dust within the CPD.
The estimated age of the system is only Myr (Andrews et al., 2009; Öberg et al., 2021). If confirmed, this CPD-hosting planet would be one of the youngest exoplanets detected to date. Observing planets at this young age allows us to place strong constraints on the mechanism and timescale of planet formation, crucial to gaining new insights into the formation and evolution of giant planets.
Acknowledgments
We thank the anonymous referee for providing us with a helpful report that improved the initial manuscript. M.B. acknowledges support from the European Research Council (ERC) under the European Union’s Horizon 2020 research and innovation programme (PROTOPLANETS, grant agreement No. 101002188). Y.A. acknowledges support by NAOJ ALMA Scientific Research Grant code 2019-13B, Grant-in-Aid for Scientific Research (S) 18H05222, and Grant-in-Aid for Transformative Research Areas (A) 20H05847. J.B.B. acknowledges support from NASA through the NASA Hubble Fellowship grant #HST-HF2-51429.001-A awarded by the Space Telescope Science Institute, which is operated by the Association of Universities for Research in Astronomy, Incorporated, under NASA contract NAS5-26555. G.C. acknowledges support by NAOJ ALMA Scientific Research Grant code 2019-13B. L.I.C. acknowledges support from the David and Lucille Packard Foundation, NSF AAG AST-1910106, and NASA ATP 80NSSC20K0529. V.V.G. gratefully acknowledges support from ANID BASAL projects ACE210002 and FB210003, and by ANID, – Millennium Science Initiative Program – NCN19_171. Support for J.H. was provided by NASA through the NASA Hubble Fellowship grant #HST-HF2-51460.001-A awarded by the Space Telescope Science Institute, which is operated by the Association of Universities for Research in Astronomy, Inc., for NASA, under contract NAS5-26555. J.D.I. acknowledges supports from the Science and Technology Facilities Council of the United Kingdom (STFC) under ST/ T000287/1 and an STFC Ernest Rutherford Fellowship (ST/W004119/1) and a University Academic Fellowship from the University of Leeds. N.K. acknowledges support provided by the Alexander von Humboldt Foundation in the framework of the Sofja Kovalevskaja Award endowed by the Federal Ministry of Education and Research. C.J.L. acknowledges funding from the National Science Foundation Graduate Research Fellowship under Grant No. DGE1745303. K.I.Ö. acknowledges support from the Simons Foundation (SCOL #321183) and an NSF AAG Grant (#1907653). L.P. gratefully acknowledges support by the ANID BASAL projects ACE210002 and FB210003, and by ANID, – Millennium Science Initiative Program – NCN19_171. K.S. acknowledges support from the European Research Council under the European Union’s Horizon 2020 research and innovation program under grant agreement No. 832428-Origins. A.S. acknowledges support from ANID FONDECYT project No. 3220495. C.W. acknowledges financial support from the University of Leeds, the Science and Technology Facilities Council, and UK Research and Innovation (grant numbers ST/T000287/1 and MR/T040726/1). This paper makes use of the following ALMA data:
-
1.
https://almascience.nrao.edu/aq/?project_code=2013.1.00226.S (catalog ADS/JAO.ALMA#2013.1.00226.S)
-
2.
https://almascience.nrao.edu/aq/?project_code=2015.1.00486.S (catalog ADS/JAO.ALMA#2015.1.00486.S)
-
3.
https://almascience.nrao.edu/aq/?project_code=2016.1.00484.L (catalog ADS/JAO.ALMA#2016.1.00484.L)
-
4.
https://almascience.nrao.edu/aq/?project_code=2018.1.01055.L (catalog ADS/JAO.ALMA#2018.1.01055.L)
ALMA is a partnership of ESO (representing its member states), NSF (USA) and NINS (Japan), together with NRC (Canada), MOST and ASIAA (Taiwan), and KASI (Republic of Korea), in cooperation with the Republic of Chile. The Joint ALMA Observatory is operated by ESO, AUI/NRAO and NAOJ. The National Radio Astronomy Observatory is a facility of the National Science Foundation operated under cooperative agreement by Associated Universities, Inc.
Appendix A Additional channel maps
Figure 7 presents the 12CO channel maps for the image cube with a half-channel velocity shift. Figures 8 and 9 present the 13CO channel maps for the fiducial image cube and the cube with a half-channel velocity shift.
Appendix B 13CO emission with various imaging parameters
Tables 1 and 2 present a summary of the 13CO point source in the images adopting various robust parameters from to 2. The rms noise is measured within the synthesized beam around the CPD over the first 20 line-free channels of the cube (). The central velocity, FWHM, peak intensity, and integrated intensity are obtained from Gaussian fitting of the emission within the synthesized beam around the CPD, using the CASA task specfit.
In Figure 10, we present the peak and integrated intensities as a function of the beam minor axis. The peak and integrated intensities remain constant within uncertainties when the beam minor axis is mas, indicating that the point source is spatially unresolved at those scales. The peak and integrated intensities increase for larger beam sizes because the beam contains emission from the AS 209 disk.
| Briggs | Beam | PA | rms Noise | Central Velocity | FWHM | Peak Intensity | Integrated Intensity |
|---|---|---|---|---|---|---|---|
| parameter | (mas mas) | (deg) | (mJy beam-1) | (km s-1) | (km s-1) | (mJy beam-1) | (mJy beam-1 km s-1) |
| -1 | 1.184 | ||||||
| -0.75 | 1.098 | ||||||
| -0.5 | 1.015 | ||||||
| -0.25 | 0.950 | ||||||
| 0 | 0.788 | ||||||
| 0.25 | 0.624 | ||||||
| 0.5 | 0.457 | ||||||
| 0.75 | 0.327 | ||||||
| 1 | 0.243 | ||||||
| 1.25 | 0.208 | ||||||
| 1.5 | 0.195 | ||||||
| 1.75 | 0.191 | ||||||
| 2 | 0.190 |
| Briggs | Beam | PA | rms Noise | Central Velocity | FWHM | Peak Intensity | Integrated Intensity |
|---|---|---|---|---|---|---|---|
| parameter | (mas mas) | (deg) | (mJy beam-1) | (km s-1) | (km s-1) | (mJy beam-1) | (mJy beam-1 km s-1) |
| -1 | 1.268 | ||||||
| -0.75 | 1.256 | ||||||
| -0.5 | 1.221 | ||||||
| -0.25 | 1.105 | ||||||
| 0 | 0.977 | ||||||
| 0.25 | 0.727 | ||||||
| 0.5 | 0.543 | ||||||
| 0.75 | 0.370 | ||||||
| 1 | 0.272 | ||||||
| 1.25 | 0.233 | ||||||
| 1.5 | 0.218 | ||||||
| 1.75 | 0.213 | ||||||
| 2 | 0.212 |
Appendix C Analysis with JvM-uncorrected images
Figure 11 presents 13CO channel maps without JvM correction. Note that the CPD is clearly seen in all three channels even before the JvM correction is applied, with the peak intensity of 8.80, 13.5, and , respectively. The peak intensity-to-noise ratio is about 6, 9, and 6 in the three channels, indicating that the detection is statistically significant in the JvM-uncorrected image.
In Figure 12, we present radial integrated intensity profiles. At , the integrated intensity of the point source is , while the integrated intensity excluding the point source is with a standard deviation of . After subtracting the contribution from the gap, the point source is detected at a significance.
References
- Alves et al. (2020) Alves, F. O., Cleeves, L. I., Girart, J. M., et al. 2020, ApJ, 904, L6
- Andrews et al. (2009) Andrews, S. M., Wilner, D. J., Hughes, A. M., Qi, C., & Dullemond, C. P. 2009, ApJ, 700, 1502
- Andrews et al. (2018) Andrews, S. M., Huang, J., Pérez, L. M., et al. 2018, ApJ, 869, L41
- Andrews et al. (2021) Andrews, S. M., Elder, W., Zhang, S., et al. 2021, ApJ, 916, 51
- Avenhaus et al. (2018) Avenhaus, H., Quanz, S. P., Garufi, A., et al. 2018, ApJ, 863, 44
- Bae (2022) Bae, J. 2022, TRIVIA: Tools foR Interactive fits VIsuAlization, v1.0.0, Zenodo, doi:10.5281/zenodo.6786391. https://zenodo.org/record/6786391
- Bae et al. (2015) Bae, J., Hartmann, L., & Zhu, Z. 2015, ApJ, 805, 15
- Baruteau et al. (2011) Baruteau, C., Meru, F., & Paardekooper, S.-J. 2011, MNRAS, 416, 1971
- Benisty et al. (2021) Benisty, M., Bae, J., Facchini, S., et al. 2021, ApJ, 916, L2
- Birnstiel et al. (2018) Birnstiel, T., Dullemond, C. P., Zhu, Z., et al. 2018, ApJ, 869, L45
- Bitsch et al. (2018) Bitsch, B., Morbidelli, A., Johansen, A., et al. 2018, A&A, 612, A30
- Boss (1997) Boss, A. P. 1997, Science, 276, 1836
- Bryan et al. (2021) Bryan, M. L., Chiang, E., Morley, C. V., Mace, G. N., & Bowler, B. P. 2021, AJ, 162, 217
- Bryan et al. (2020) Bryan, M. L., Chiang, E., Bowler, B. P., et al. 2020, AJ, 159, 181
- Casassus & Carcamo (2022) Casassus, S., & Carcamo, M. 2022, arXiv e-prints, arXiv:2204.08589
- Casassus & Pérez (2019) Casassus, S., & Pérez, S. 2019, ApJ, 883, L41
- Cleeves et al. (2015) Cleeves, L. I., Bergin, E. A., & Harries, T. J. 2015, ApJ, 807, 2
- Czekala et al. (2021) Czekala, I., Loomis, R. A., Teague, R., et al. 2021, ApJS, 257, 2
- Deng et al. (2021) Deng, H., Mayer, L., & Helled, R. 2021, Nature Astronomy, 5, 440
- Drkazkowska & Alibert (2017) Drkazkowska, J., & Alibert, Y. 2017, A&A, 608, A92
- Favre et al. (2019) Favre, C., Fedele, D., Maud, L., et al. 2019, ApJ, 871, 107
- Fedele et al. (2018) Fedele, D., Tazzari, M., Booth, R., et al. 2018, A&A, 610, A24
- Fletcher et al. (2019) Fletcher, M., Nayakshin, S., Stamatellos, D., et al. 2019, MNRAS, 486, 4398
- Fung et al. (2019) Fung, J., Zhu, Z., & Chiang, E. 2019, ApJ, 887, 152
- Gaia Collaboration et al. (2020) Gaia Collaboration, Brown, A. G. A., Vallenari, A., et al. 2020, arXiv e-prints, arXiv:2012.01533
- Guzmán et al. (2018) Guzmán, V. V., Huang, J., Andrews, S. M., et al. 2018, ApJ, 869, L48
- Haffert et al. (2019) Haffert, S. Y., Bohn, A. J., de Boer, J., et al. 2019, Nature Astronomy, 3, 749
- Huang et al. (2016) Huang, J., Öberg, K. I., & Andrews, S. M. 2016, ApJ, 823, L18
- Huang et al. (2018) Huang, J., Andrews, S. M., Dullemond, C. P., et al. 2018, ApJ, 869, L42
- Hunter (2007) Hunter, J. D. 2007, Computing in Science and Engineering, 9, 90
- Isella et al. (2019) Isella, A., Benisty, M., Teague, R., et al. 2019, ApJ, 879, L25
- Isella et al. (2014) Isella, A., Chandler, C. J., Carpenter, J. M., Pérez, L. M., & Ricci, L. 2014, ApJ, 788, 129
- Jennings & Chiang (2021) Jennings, R. M., & Chiang, E. 2021, MNRAS, 507, 5187
- Johansen & Lacerda (2010) Johansen, A., & Lacerda, P. 2010, MNRAS, 404, 475
- Jorsater & van Moorsel (1995) Jorsater, S., & van Moorsel, G. A. 1995, AJ, 110, 2037
- Kanagawa et al. (2016) Kanagawa, K. D., Muto, T., Tanaka, H., et al. 2016, PASJ, 68, 43
- Korycansky et al. (1991) Korycansky, D. G., Bodenheimer, P., & Pollack, J. B. 1991, Icarus, 92, 234
- Lambrechts & Johansen (2012) Lambrechts, M., & Johansen, A. 2012, A&A, 544, A32
- Lambrechts & Johansen (2014) —. 2014, A&A, 572, A107
- Lambrechts et al. (2014) Lambrechts, M., Johansen, A., & Morbidelli, A. 2014, A&A, 572, A35
- Law et al. (2021a) Law, C. J., Loomis, R. A., Teague, R., et al. 2021a, ApJS, 257, 3
- Law et al. (2021b) Law, C. J., Teague, R., Loomis, R. A., et al. 2021b, ApJS, 257, 4
- Lin & Papaloizou (1986) Lin, D. N. C., & Papaloizou, J. 1986, ApJ, 309, 846
- Lubow & Martin (2012) Lubow, S. H., & Martin, R. G. 2012, ApJ, 749, L37
- Lubow et al. (1999) Lubow, S. H., Seibert, M., & Artymowicz, P. 1999, ApJ, 526, 1001
- McMullin et al. (2007) McMullin, J. P., Waters, B., Schiebel, D., Young, W., & Golap, K. 2007, in Astronomical Society of the Pacific Conference Series, Vol. 376, Astronomical Data Analysis Software and Systems XVI, ed. R. A. Shaw, F. Hill, & D. J. Bell, 127
- Mizuno (1980) Mizuno, H. 1980, Progress of Theoretical Physics, 64, 544
- Morbidelli & Nesvorny (2012) Morbidelli, A., & Nesvorny, D. 2012, A&A, 546, A18
- Müller et al. (2005) Müller, H. S., Schlöder, F., Stutzki, J., & Winnewisser, G. 2005, Journal of Molecular Structure, 742, 215. https://www.sciencedirect.com/science/article/pii/S0022286005000888
- Öberg et al. (2021) Öberg, K. I., Guzmán, V. V., Walsh, C., et al. 2021, ApJS, 257, 1
- Ormel & Klahr (2010) Ormel, C. W., & Klahr, H. H. 2010, A&A, 520, A43
- Paardekooper et al. (2022) Paardekooper, S.-J., Dong, R., Duffell, P., et al. 2022, arXiv e-prints, arXiv:2203.09595
- Perez et al. (2015) Perez, S., Dunhill, A., Casassus, S., et al. 2015, ApJ, 811, L5
- Pérez et al. (2019) Pérez, S., Marino, S., Casassus, S., et al. 2019, MNRAS, 488, 1005
- Pineda et al. (2019) Pineda, J. E., Szulágyi, J., Quanz, S. P., et al. 2019, ApJ, 871, 48
- Pinilla et al. (2012) Pinilla, P., Benisty, M., & Birnstiel, T. 2012, A&A, 545, A81
- Pinte et al. (2022) Pinte, C., Teague, R., Flaherty, K., et al. 2022, arXiv e-prints, arXiv:2203.09528
- Pinte et al. (2018) Pinte, C., Price, D. J., Ménard, F., et al. 2018, ApJ, 860, L13
- Pinte et al. (2019) Pinte, C., van der Plas, G., Ménard, F., et al. 2019, Nature Astronomy, 3, 1109
- Schöier et al. (2005) Schöier, F. L., van der Tak, F. F. S., van Dishoeck, E. F., & Black, J. H. 2005, A&A, 432, 369
- Sierra et al. (2021) Sierra, A., Pérez, L. M., Zhang, K., et al. 2021, ApJS, 257, 14
- Szulágyi et al. (2016) Szulágyi, J., Masset, F., Lega, E., et al. 2016, MNRAS, 460, 2853
- Szulágyi & Mordasini (2017) Szulágyi, J., & Mordasini, C. 2017, MNRAS, 465, L64
- Teague (2019) Teague, R. 2019, The Journal of Open Source Software, 4, 1632
- Teague et al. (2019a) Teague, R., Bae, J., & Bergin, E. A. 2019a, Nature, 574, 378
- Teague et al. (2018) Teague, R., Bae, J., Birnstiel, T., & Bergin, E. A. 2018, ApJ, 868, 113
- Teague et al. (2019b) Teague, R., Bae, J., Huang, J., & Bergin, E. A. 2019b, ApJ, 884, L56
- Teague & Foreman-Mackey (2018) Teague, R., & Foreman-Mackey, D. 2018, Bettermoments: A Robust Method To Measure Line Centroids, vv1.0, Zenodo, doi:10.5281/zenodo.1419754
- Toomre & Toomre (1972) Toomre, A., & Toomre, J. 1972, ApJ, 178, 623
- van der Walt et al. (2011) van der Walt, S., Colbert, S. C., & Varoquaux, G. 2011, Computing in Science and Engineering, 13, 22
- Wagner et al. (2018) Wagner, K., Follete, K. B., Close, L. M., et al. 2018, ApJ, 863, L8
- Ward & Canup (2010) Ward, W. R., & Canup, R. M. 2010, AJ, 140, 1168
- Wilson & Rood (1994) Wilson, T. L., & Rood, R. 1994, ARA&A, 32, 191
- Wu et al. (2022) Wu, Y.-L., Bowler, B. P., Sheehan, P. D., et al. 2022, ApJ, 930, L3
- Yu et al. (2021) Yu, H., Teague, R., Bae, J., & Öberg, K. 2021, ApJ, 920, L33
- Yun et al. (2019) Yun, H., Kim, W.-T., Bae, J., & Han, C. 2019, ApJ, 884, 142
- Zhang et al. (2021) Zhang, K., Booth, A. S., Law, C. J., et al. 2021, ApJS, 257, 5
- Zhang et al. (2018) Zhang, S., Zhu, Z., Huang, J., et al. 2018, ApJ, 869, L47
- Zhu et al. (2012) Zhu, Z., Hartmann, L., Nelson, R. P., & Gammie, C. F. 2012, ApJ, 746, 110