Evidence of distant spiral arms in the Galactic disk quadrant IV from VVV red clump giants
Abstract
The discovery of new clear windows in the Galactic plane using the VVV near-IR extinction maps allows the study of the structure of the Milky Way (MW) disk. The ultimate goal of this work is to map the spiral arms in the far side of the MW, which is a relatively unexplored region of our Galaxy, using red clump (RC) giants as distance indicators. We search for near-IR clear windows located at low Galactic latitudes ( deg) in the MW disk using the VVV near-IR extinction maps. We have identified two new windows named VVV WIN 16075258 and VVV WIN 14755877, respectively, that complement the previously known window VVV WIN 17133939. We analyse the distribution of RC stars in these three clear near-IR windows and measure their number density along the line of sight. This allows us to find overdensities in the distribution and measure their distances along the line of sight. We then use the VVV proper motions in order to measure the kinematics of the RC stars at different distances. We find enhancements in the distance distribution of RC giants in all the studied windows, interpreting them as the presence of spiral arms in the MW disk. These structures are absent in the current models of synthetic population for the same MW lines of sight. We were able to trace the end of the Galactic bar, the Norma arm, as well as the Scutum Centaurus arm in the far disk. Using the VVV proper motions, we measure the kinematics for these Galactic features, confirming that they share the bulk rotation of the Galactic disk.
doi:
10.1017/pasa.2020.32keywords:
Galaxy: disk; Galaxy: structure; dust, extinction; surveysR. Kammers]betokammers@gmail.com \alsoaffiliationDepartamento de Física, Universidade Federal de Santa Catarina, Trindade 88040-900, Florianópolis, SC, Brazil \alsoaffiliationVatican Observatory, V00120 Vatican City State, Italy \alsoaffiliationMillennium Institute of Astrophysics, Nuncio Monseñor Sotero Sanz 100, Of. 104, Providencia, Santiago, Chile \published22 September 2020
1 Introduction
The Milky Way (MW) is a barred spiral galaxy suggested to present a 4-arms pattern. The MW spiral arms have long been recognized as presenting coherent arcs and loops in Galactic longitude-velocity plots of atomic and molecular emissions (e.g. Reid et al., 2014; Vallée, 2017). The exact location and detailed structure of the MW spiral arms are highly uncertain, and part of the current models to the outer MW regions are extrapolations of the observed in the closer regions (e.g. Camargo et al., 2015; Bland-Hawthorn & Gerhard, 2016; Reid et al., 2019). Due to effects caused by warping, the outer disk slowly departs from the Galactic Plane in both HI and stars. In addition to the warping, the outer disk flares and possesses a fair degree of substructure (Bland-Hawthorn & Gerhard, 2016).
The high extinction towards the Galactic plane is the major obstacle to prevent the study of the far side of the MW. To minimize the problem, windows of low extinction such as the Baade’s window in the Galactic bulge (Baade, 1951; Arp, 1965; van den Bergh, 1971) have been used in the study of the stellar content and Galactic structure, among others. Churchwell et al. (2009) and Robitaille et al. (2012) show that only Scutum-Centaurus and Perseus can be considered main arms, associated with overdensities of old stellar disk and OB stars, while Norma and Sagittarius arms present younger stars and a few OB stars.
The ESO VISTA Variables in Vía Láctea (VVV) near-IR survey has recently scanned a total of 562 sq. deg. area of the MW bulge and the adjacent plane. The VVV strategy consisted in two set of observations in filters, plus observations in band over many years, providing a deep, high-resolution dataset of the inner Galaxy in the near-IR (Minniti et al., 2010; Saito et al., 2012). Using VVV data, Minniti et al. (2018) and Saito et al. (2020) reported on the discovery of two windows of low extinction located right in the MW plane, namely VVV WIN 17133939 and VVV WIN 17333349. VVV WIN 17333349 lies towards the inner MW bulge at Galactic coordinates ( deg), while VVV WIN 17133939 is about 7.5 deg apart in longitude, at coordinates ( deg).
VVV WIN 17133939 is roughly circular in shape, with diameter in size. The distribution of red clump (RC) stars within VVV WIN 17133939 shows a bimodal distribution in magnitude, interpreted as the signature of the structure of the spiral arms across the background disk. The RC peaks at and kpc, in agreement with the expected position for the the Sagittarius arm and the end of the long bar, and the far side of the Scutum-Centaurus arm, respectively (see Fig. 6 in Minniti et al., 2018).
Here we complement the analysis of VVV WIN 17133939 made by Minniti et al. (2018) and describe the search for new windows of low extinction in the MW plane, reporting the discovery and analysis of VVV WIN 16075258 and VVV WIN 14755877. The RC distribution and kinematics within these three windows were used to map overdensities on the far side of the disk. Our results are in agreement with expectations for the spiral arms both in distance and in velocity along the Galactic longitude.
2 Two new windows of low extinction
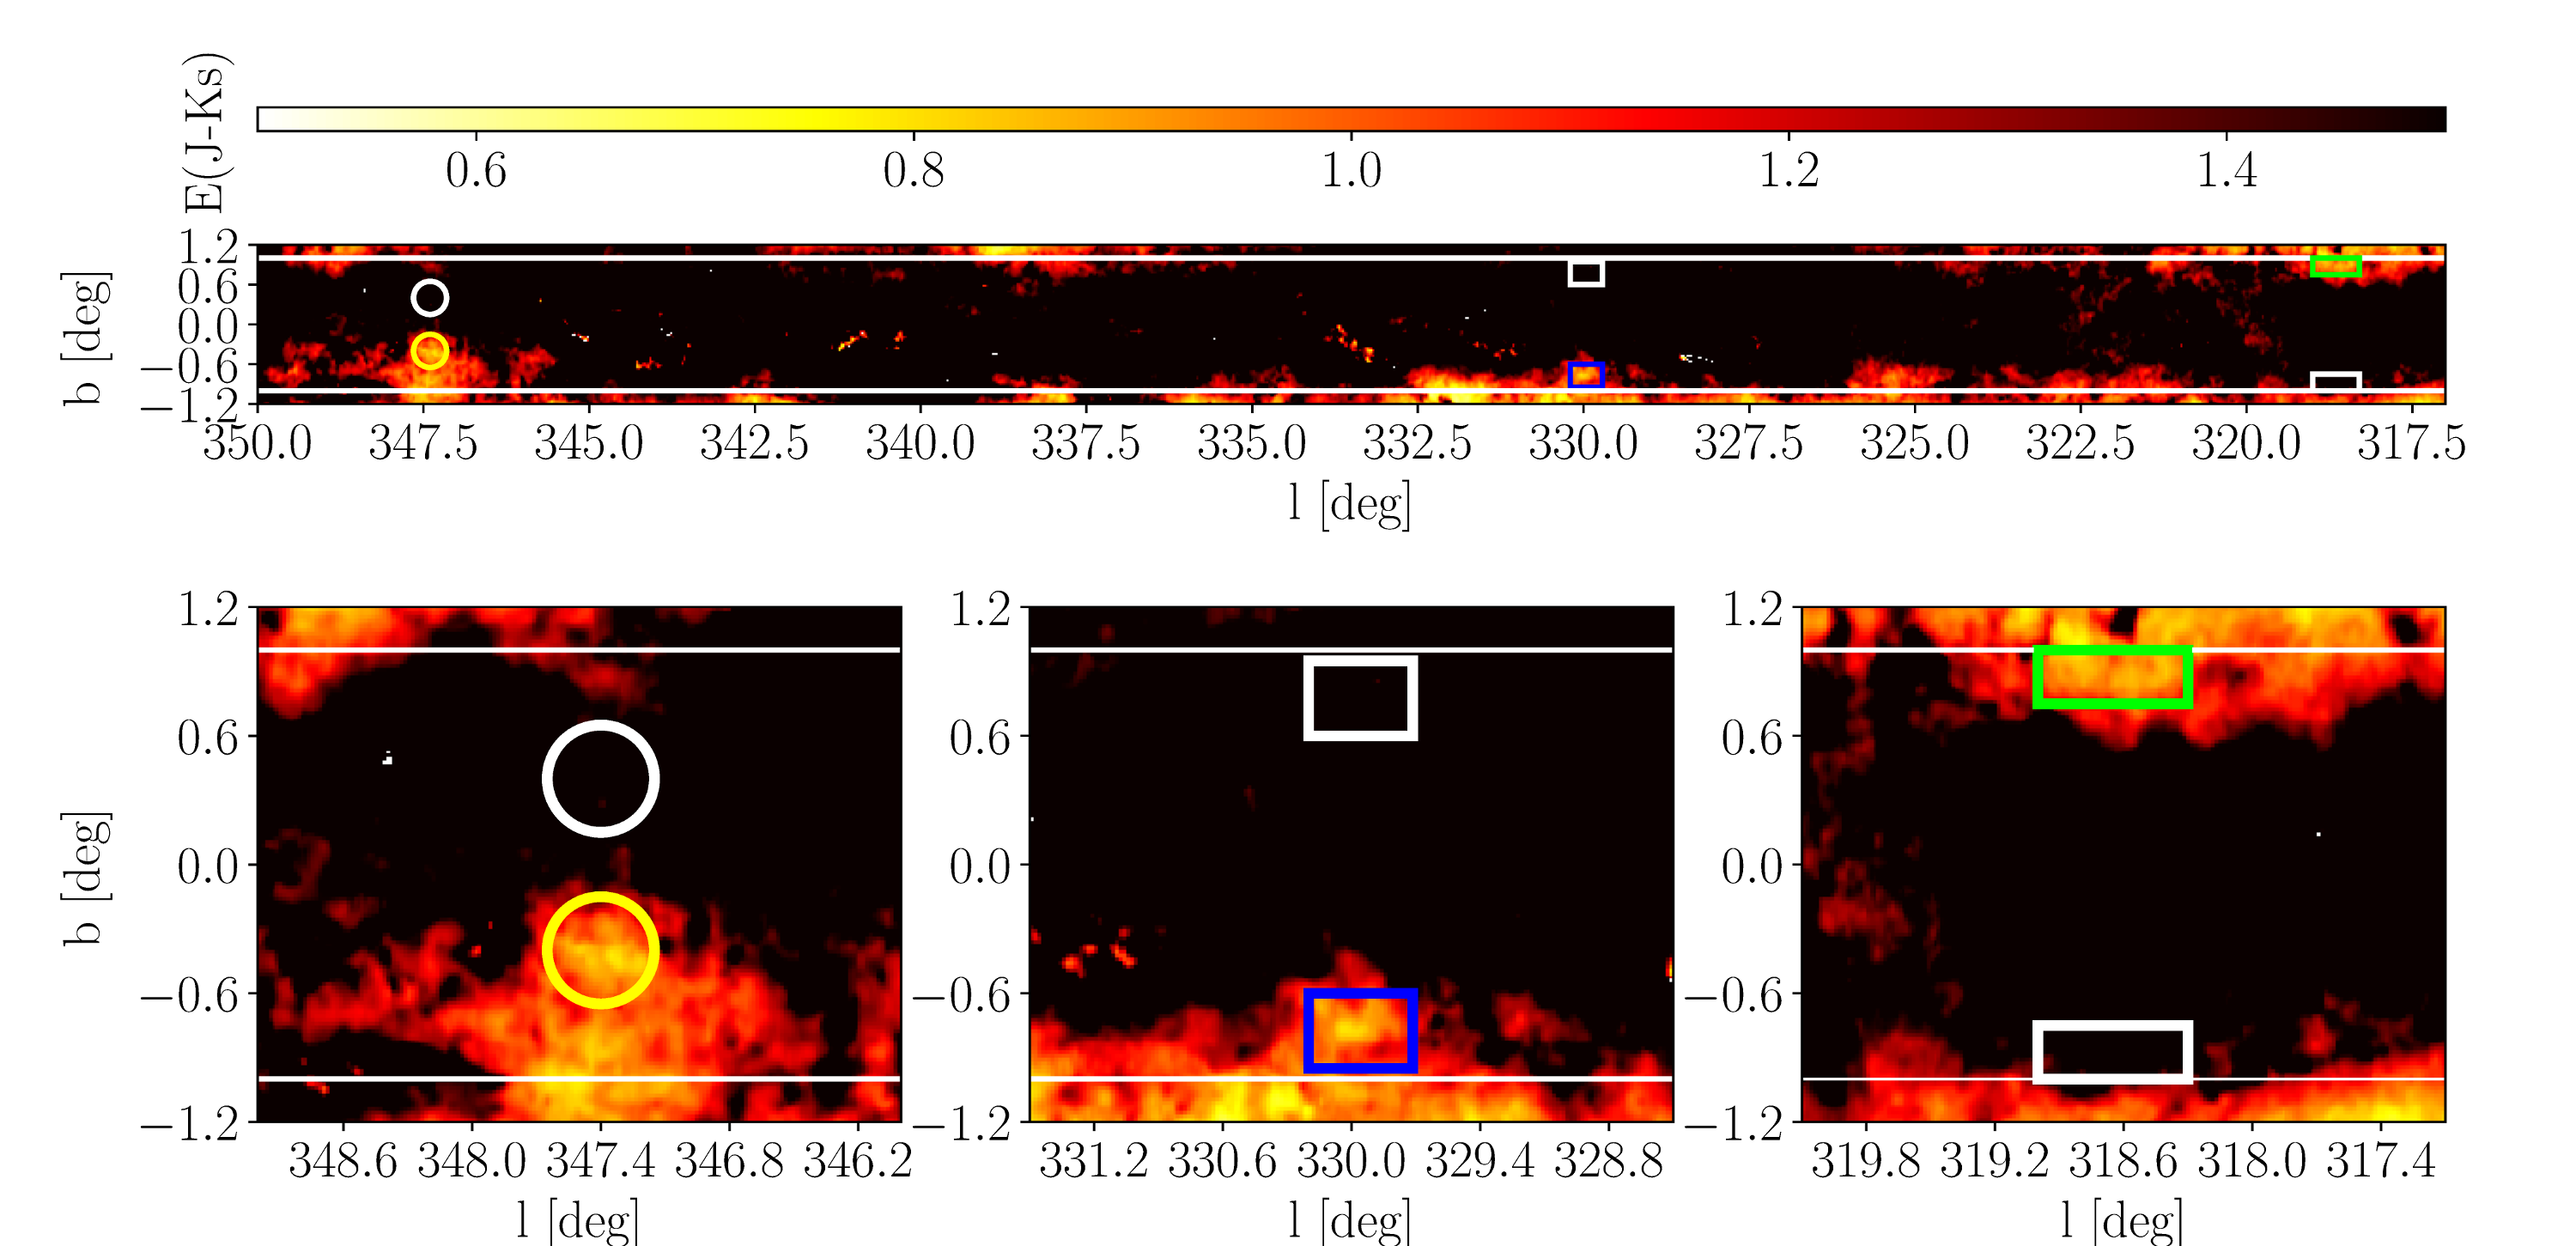
We made use of the extinction map presented in Minniti et al. (2018) to search for windows of low extinction located at low Galactic latitudes in the plane of the MW. To avoid departing from the Galactic plane at larger distances we limited our search to deg and deg, and then we applied a threshold limit of = 1.5 mag in order to mask the regions of high extinction. In the resulting map (see the top panel of Fig. 1) two more promising low extinction windows were detected, in addition to the already known VVV WIN 17133939 (Minniti et al., 2018). We also verified that these regions of low extinction are also seen in the maps of Marshall et al. (2006), Nidever et al. (2012) and Soto et al. (2019), and in the spatial distribution of Gaia sources (Gaia Collaboration et al., 2016).
In selecting RC stars from VVV WIN 17133939 we use the same definition as in Minniti et al. (2018), where VVV WIN 17133939 is a circular area of diameter centered at deg.
VVV WIN 16075258 is a rectangular region of size, centered at deg. For a latitude of deg the vertical projection along the line of sight is small pc even at the far side of the MW disk ( kpc). The mean extinction within the window is 0.16 mag, corresponding to mag using (Minniti et al., 2018). We define VVV WIN 14755877 also as a rectangular region, size, centered at deg. The mean reddening within this window is 0.06 mag and mag using . Other low extinction regions are also seen in the modified map, near to VVV WIN 16075258 ( deg) and around deg. These regions are smaller and more inhomogeneous in relation to the three selected windows and therefore they are not subject of this work.
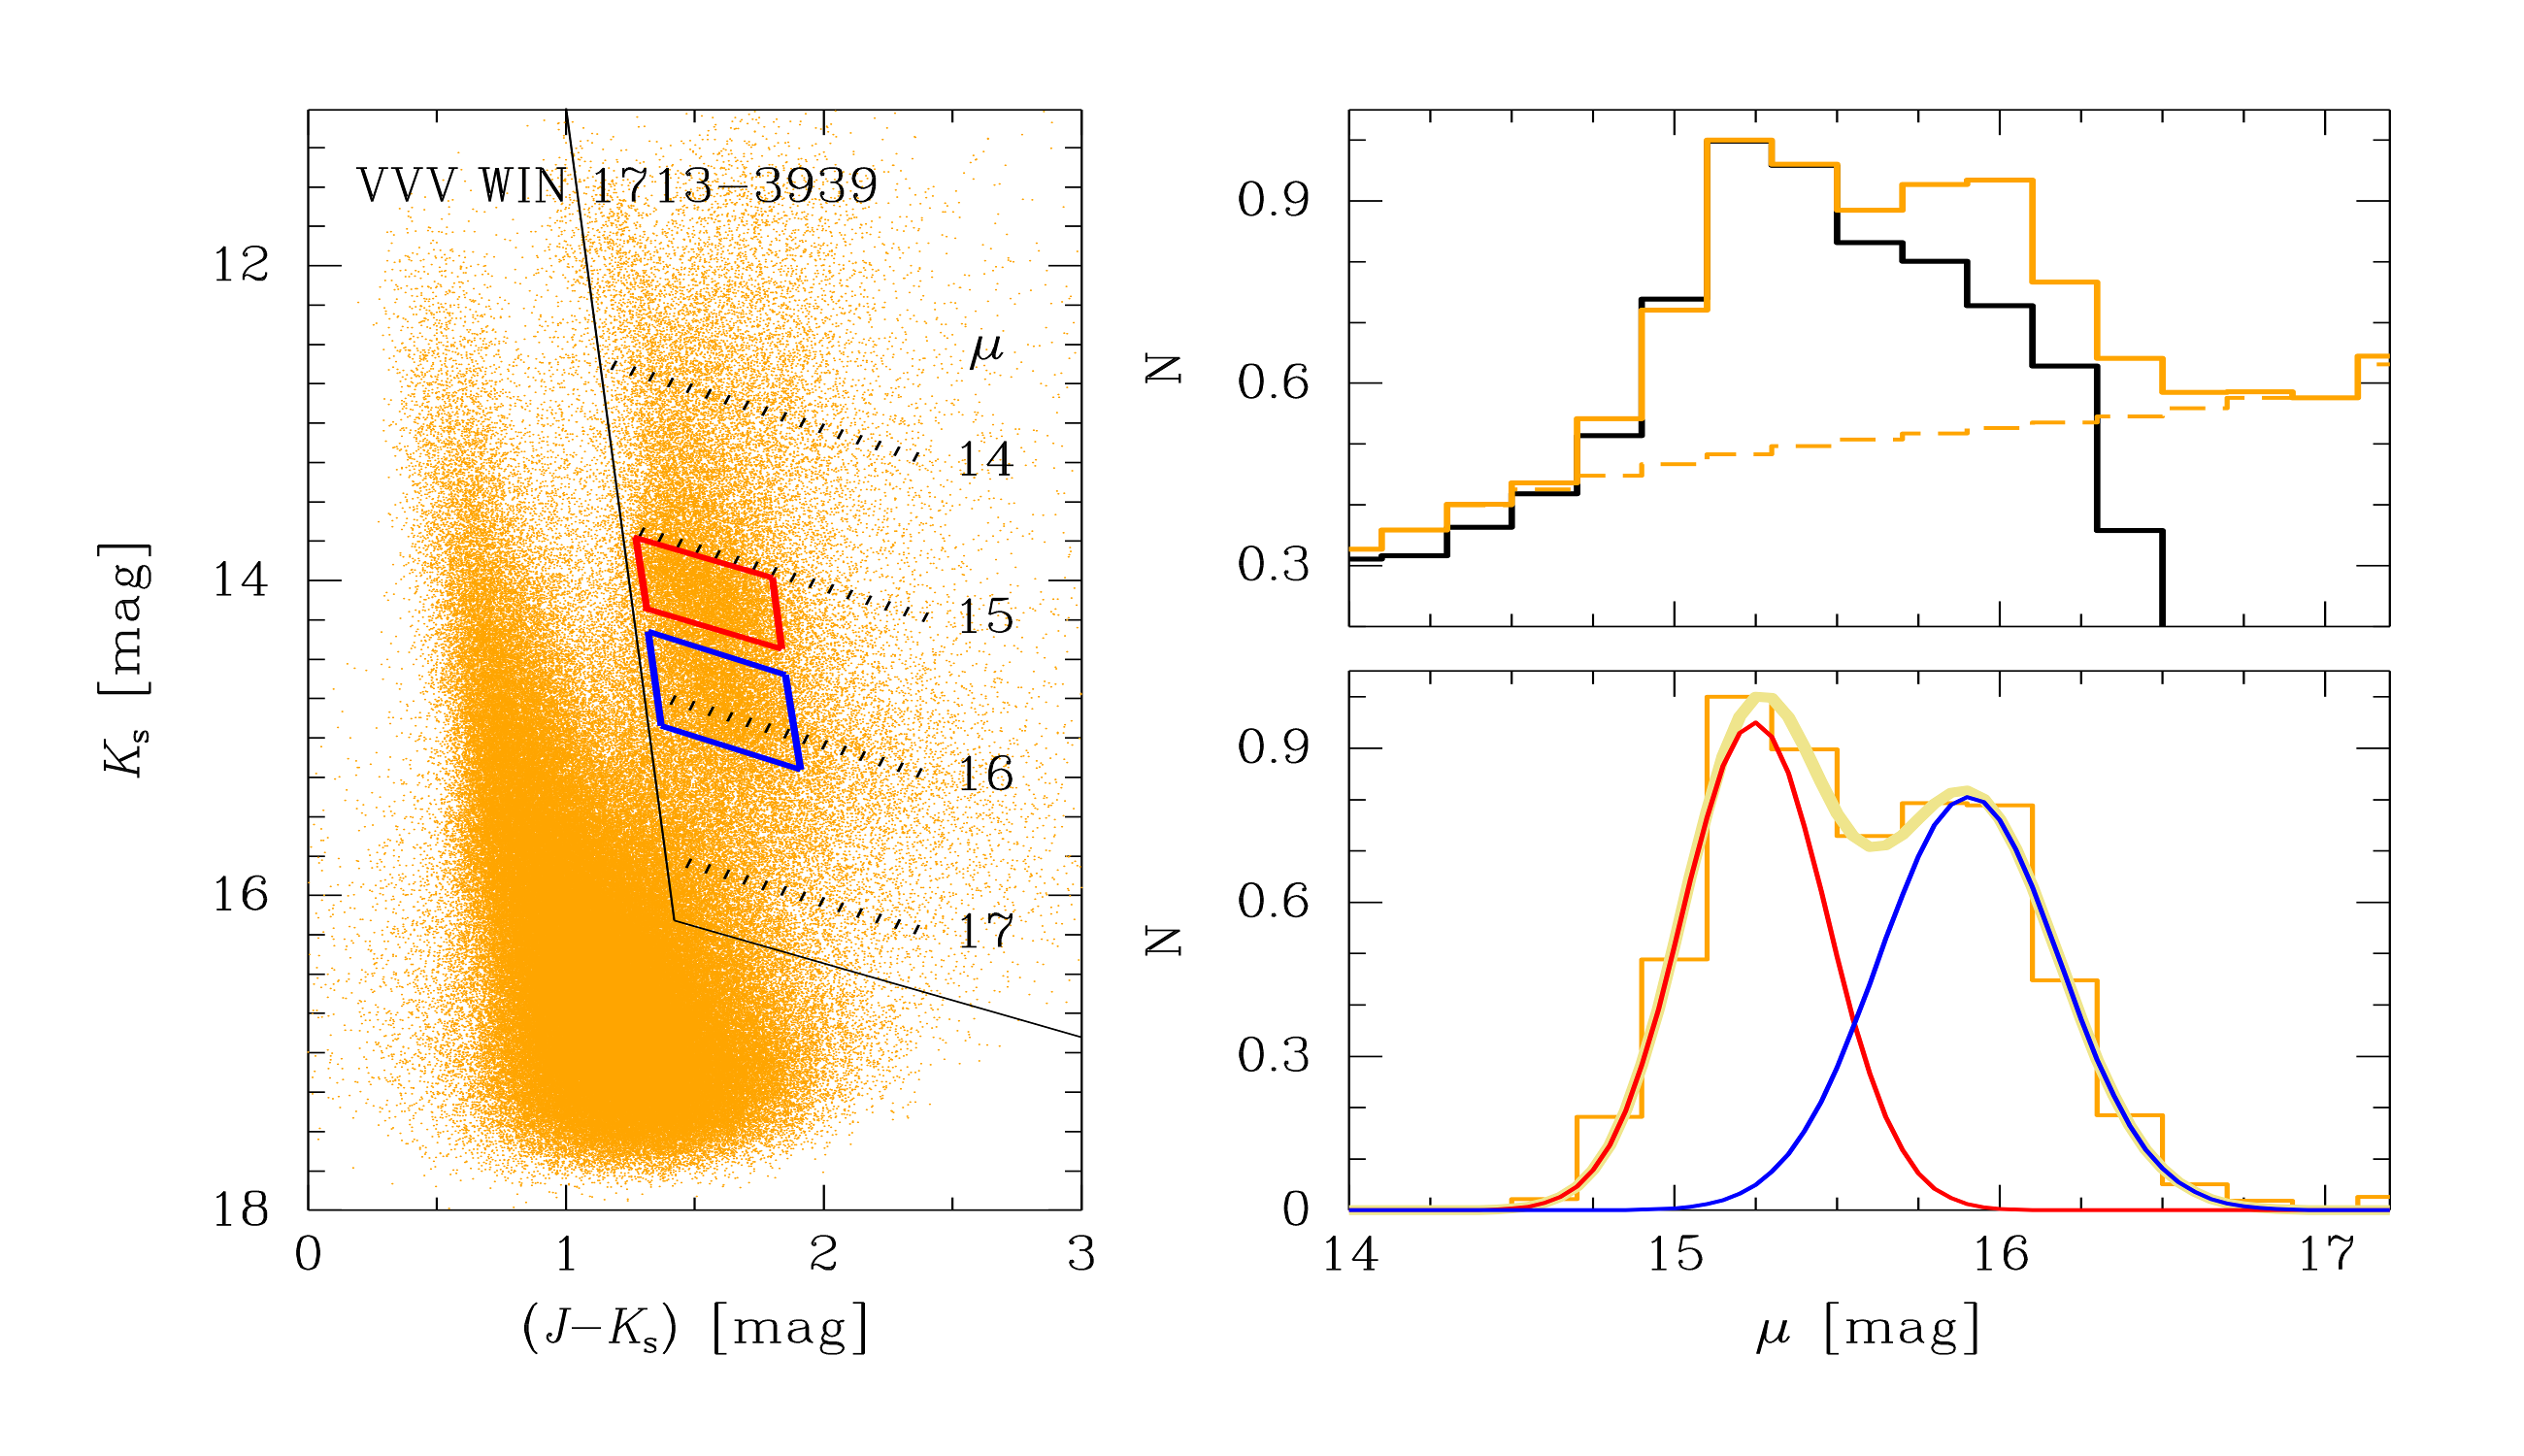
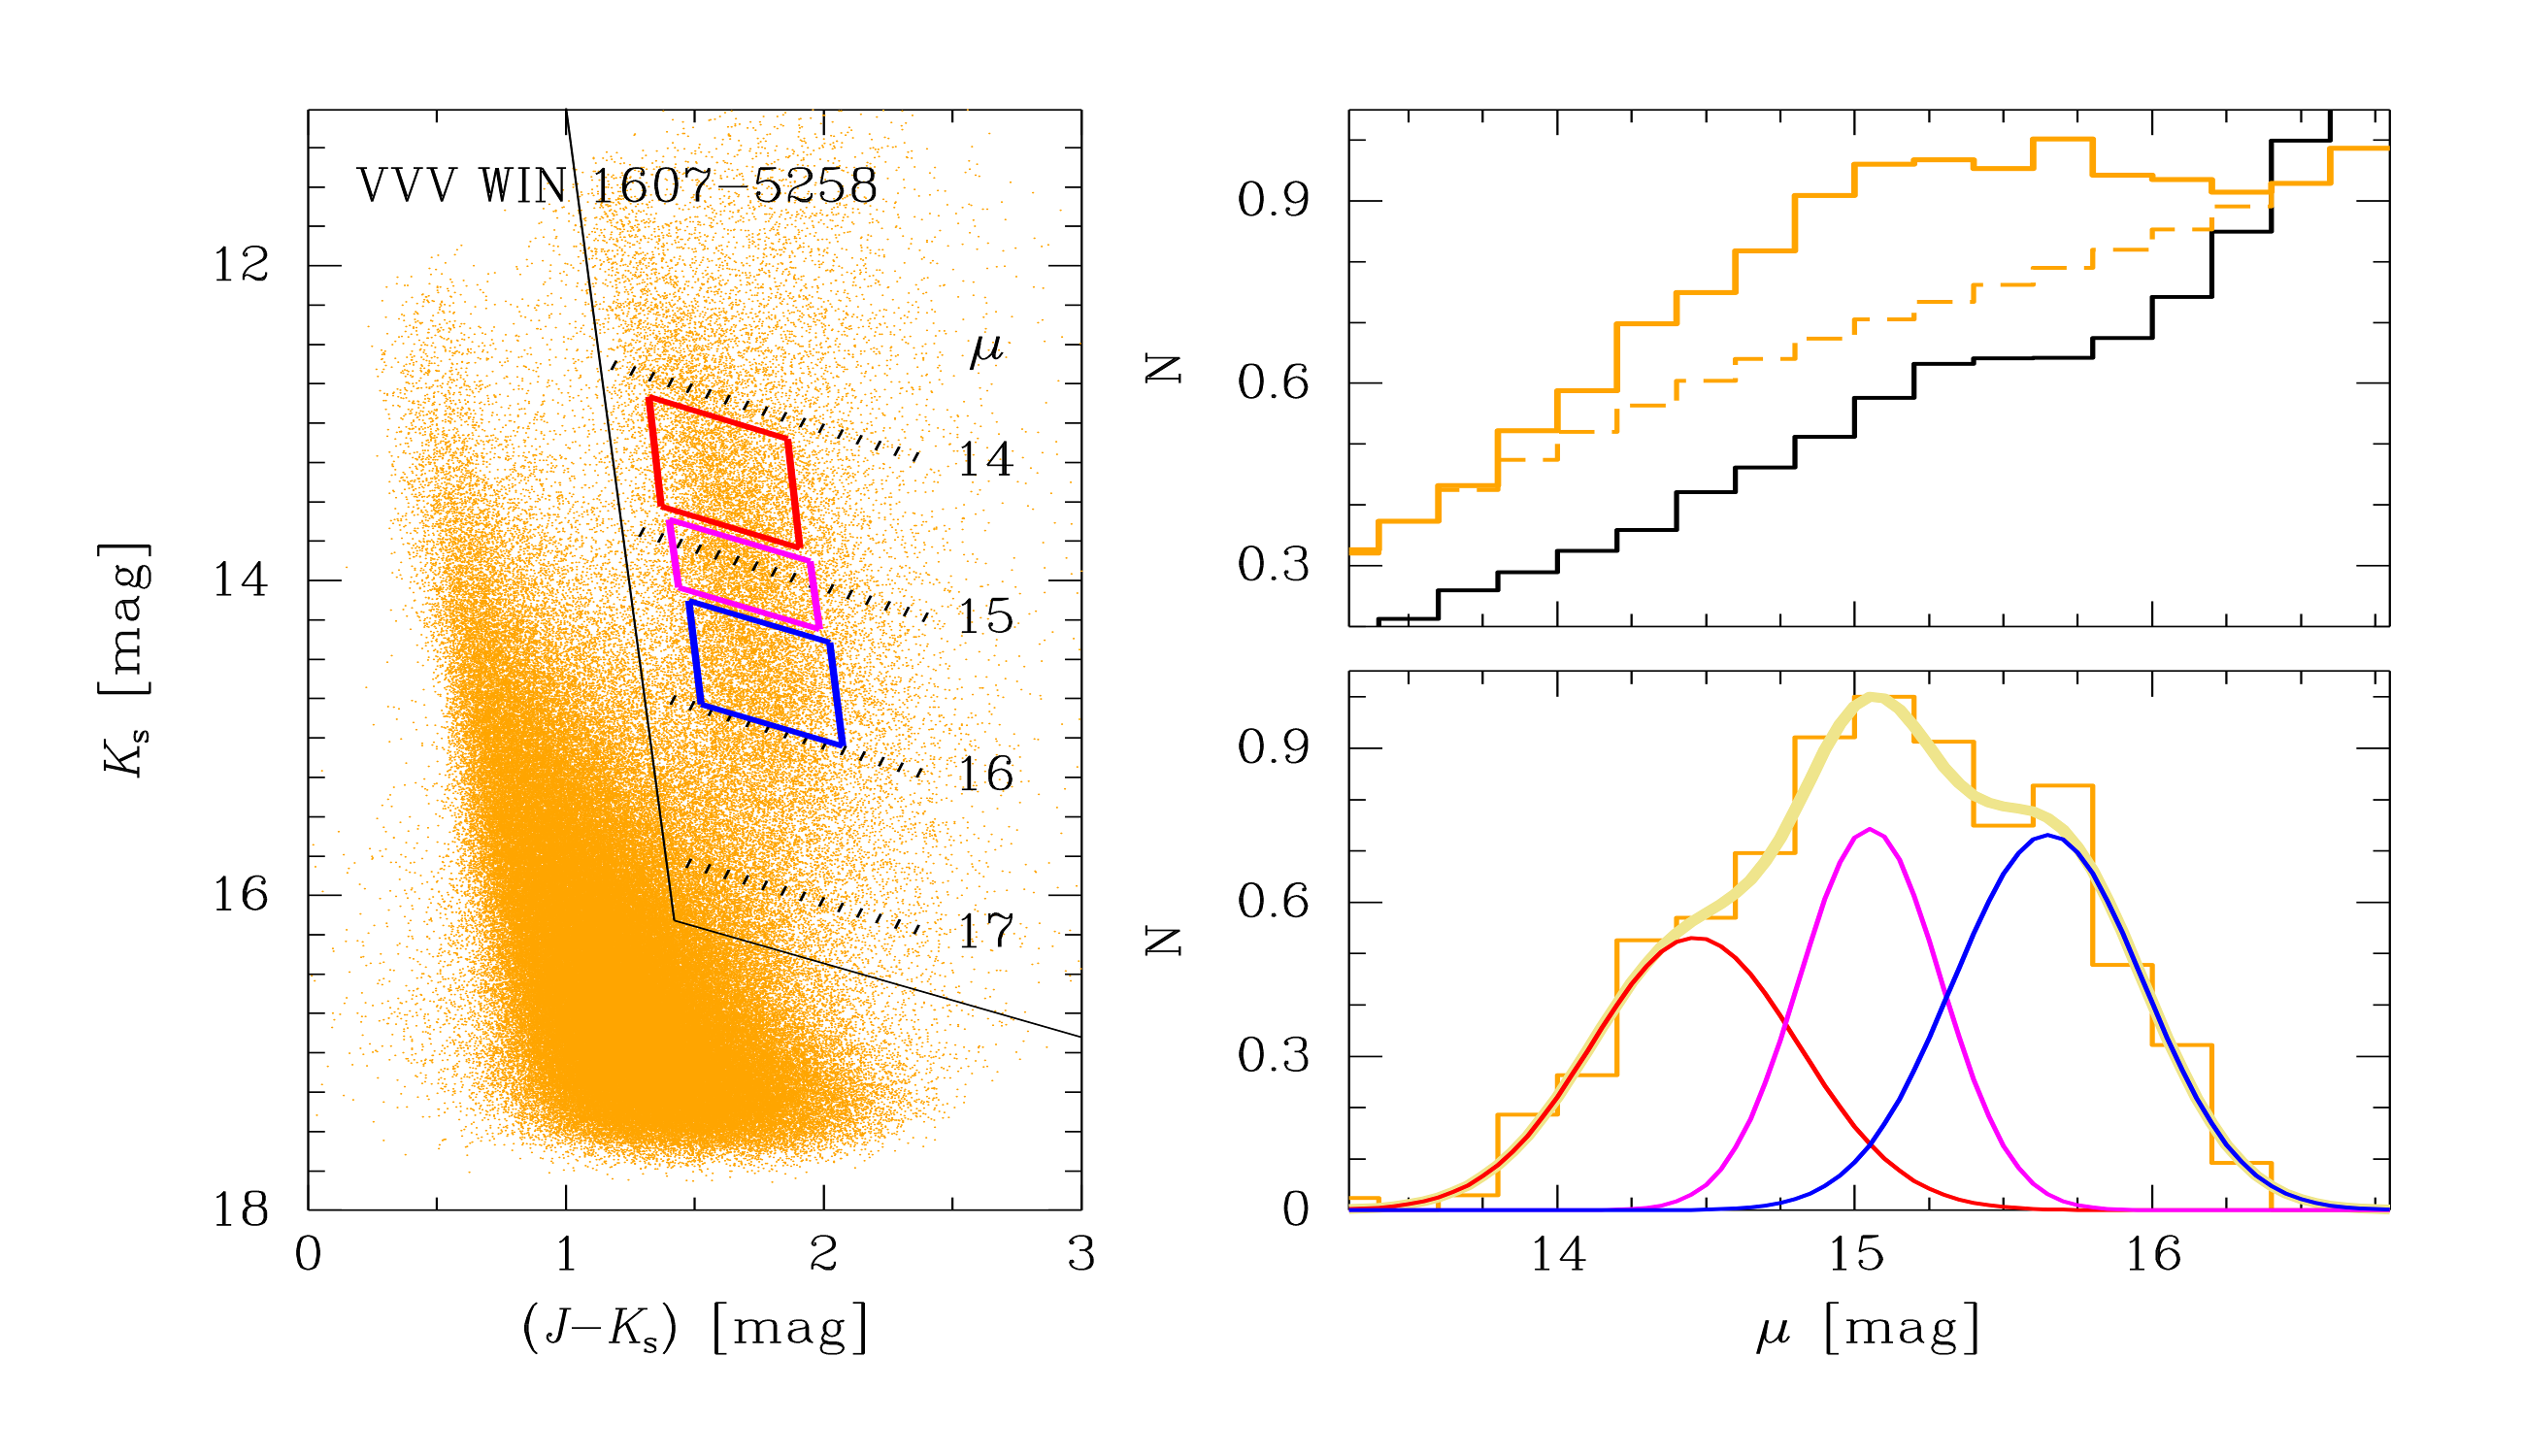
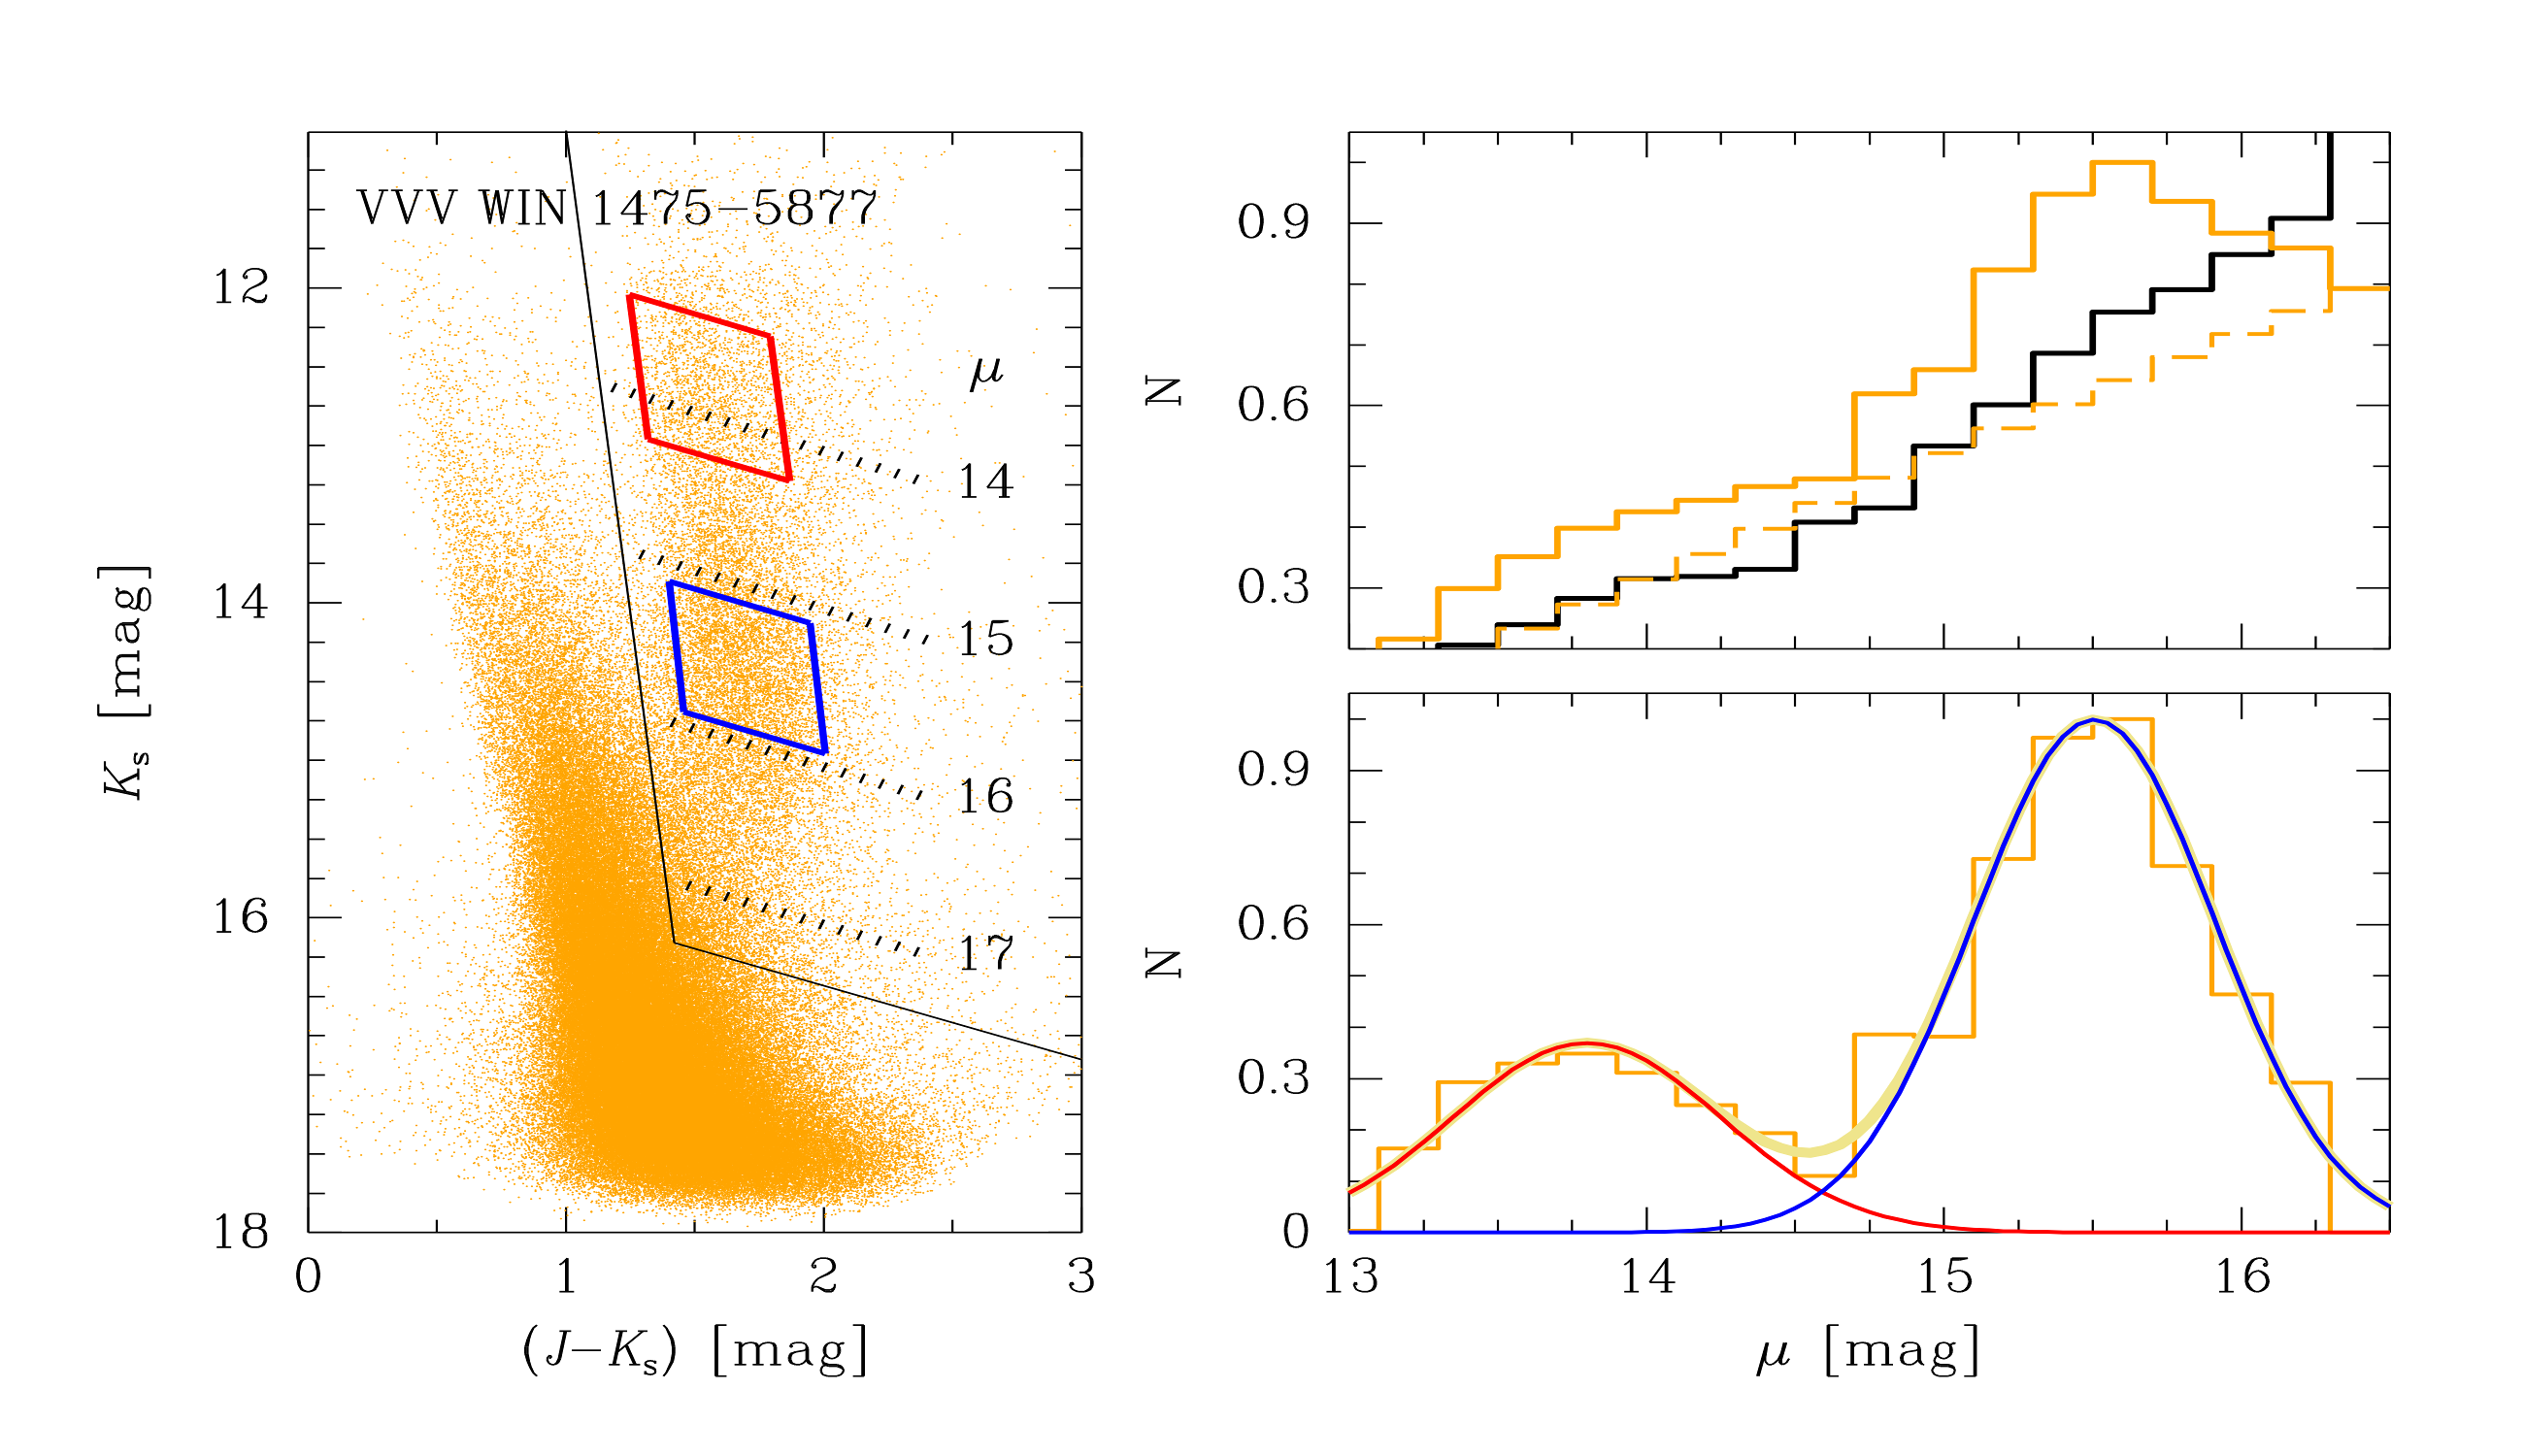
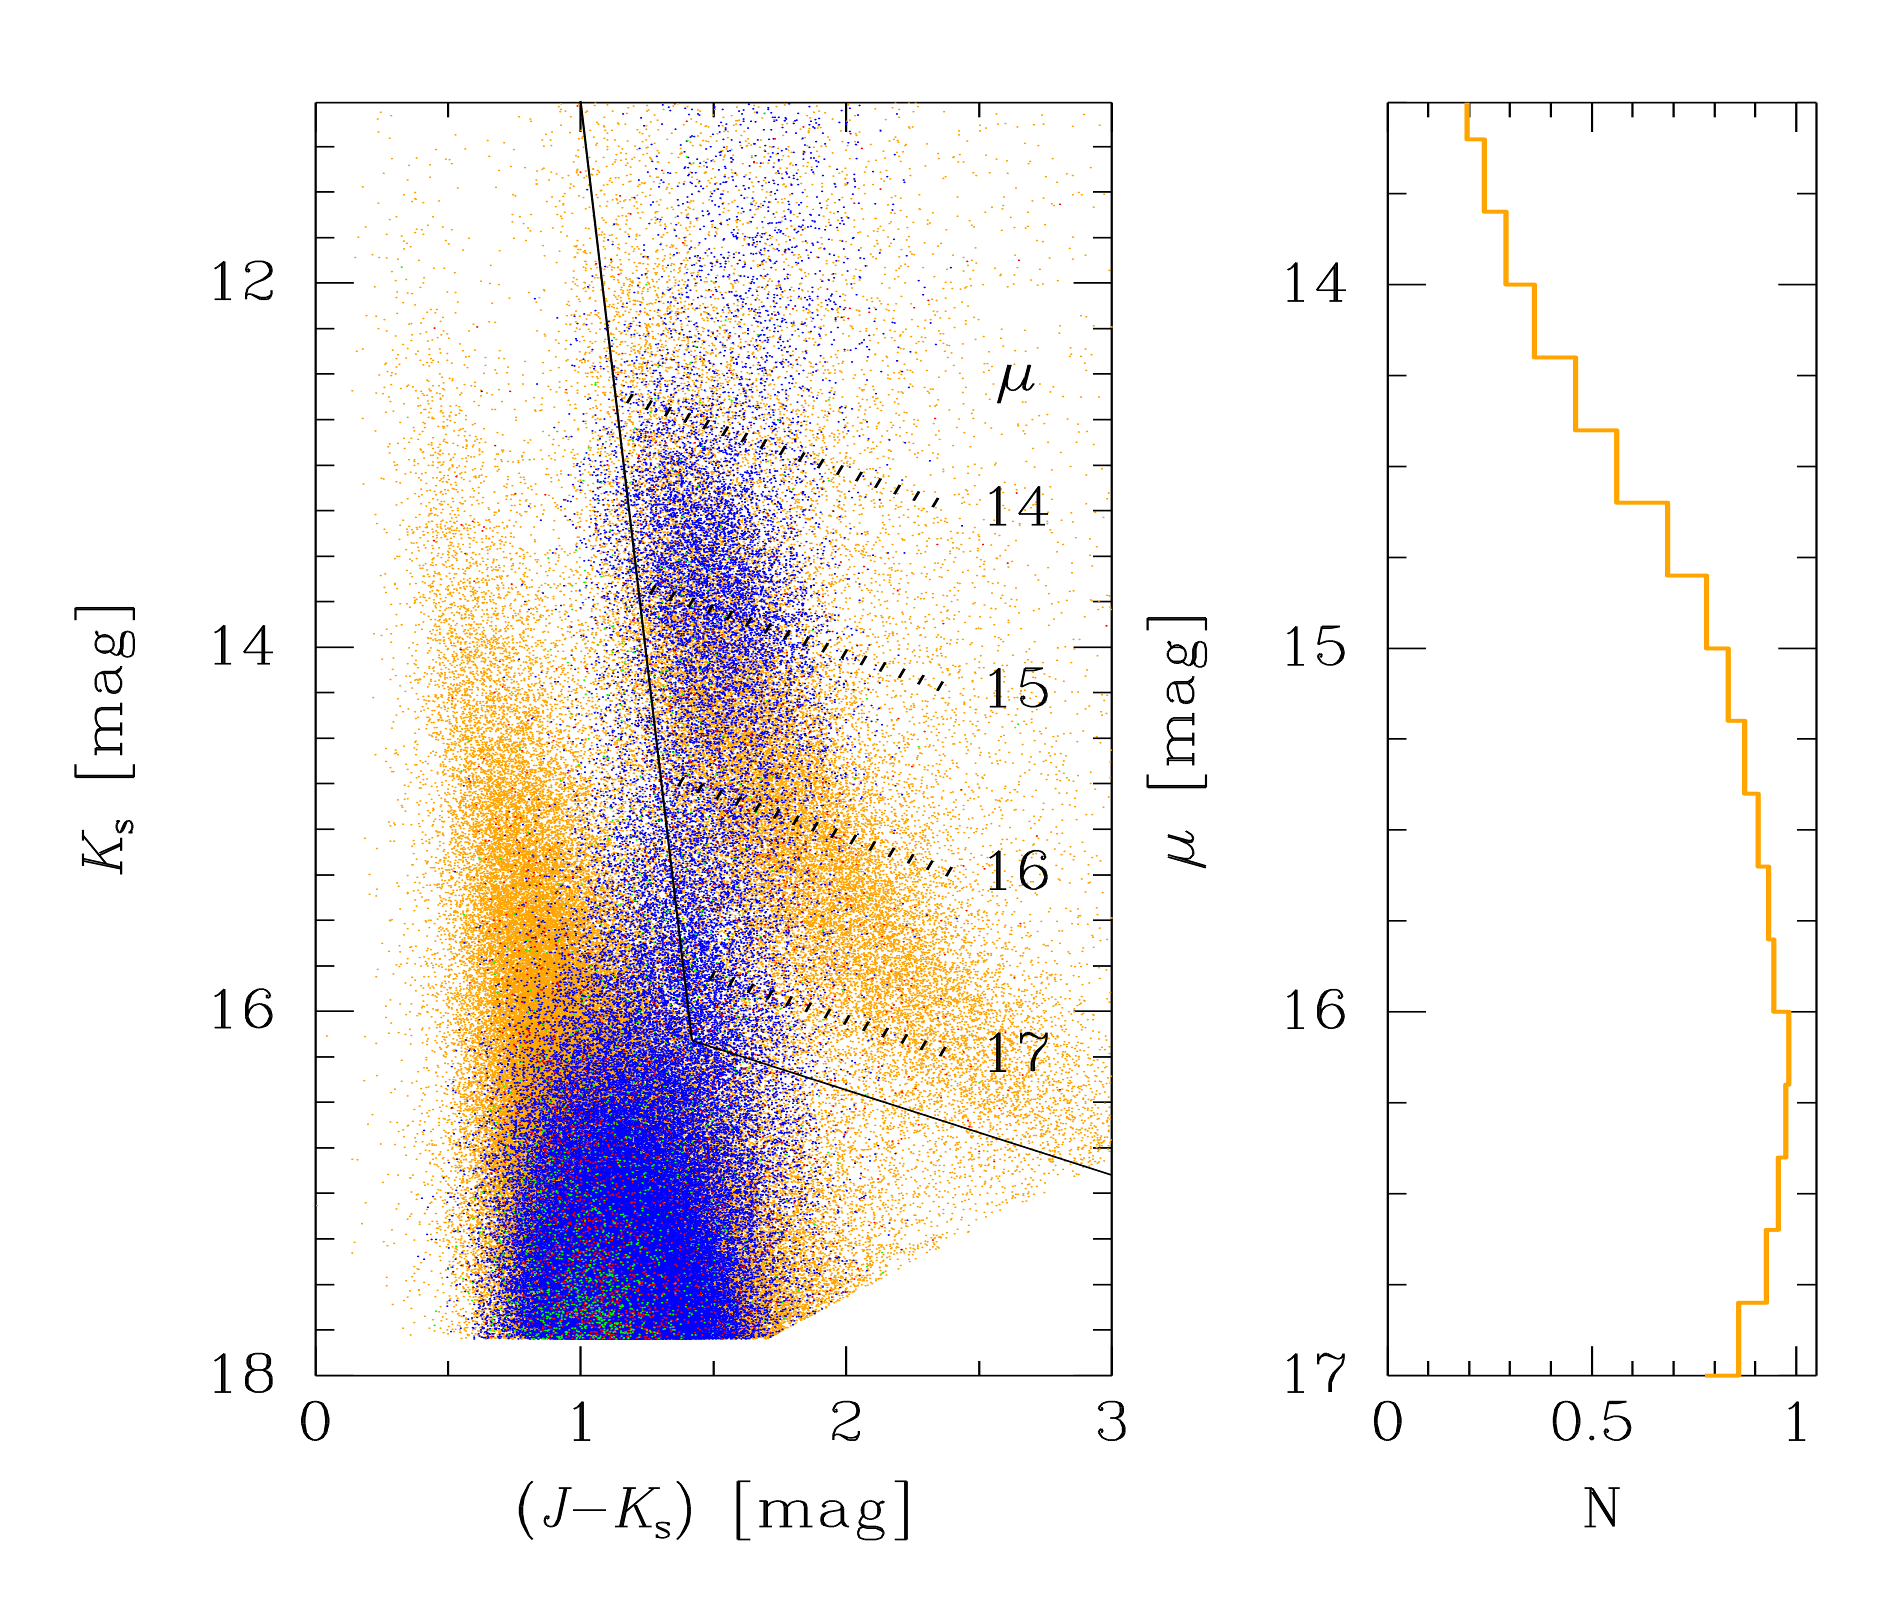
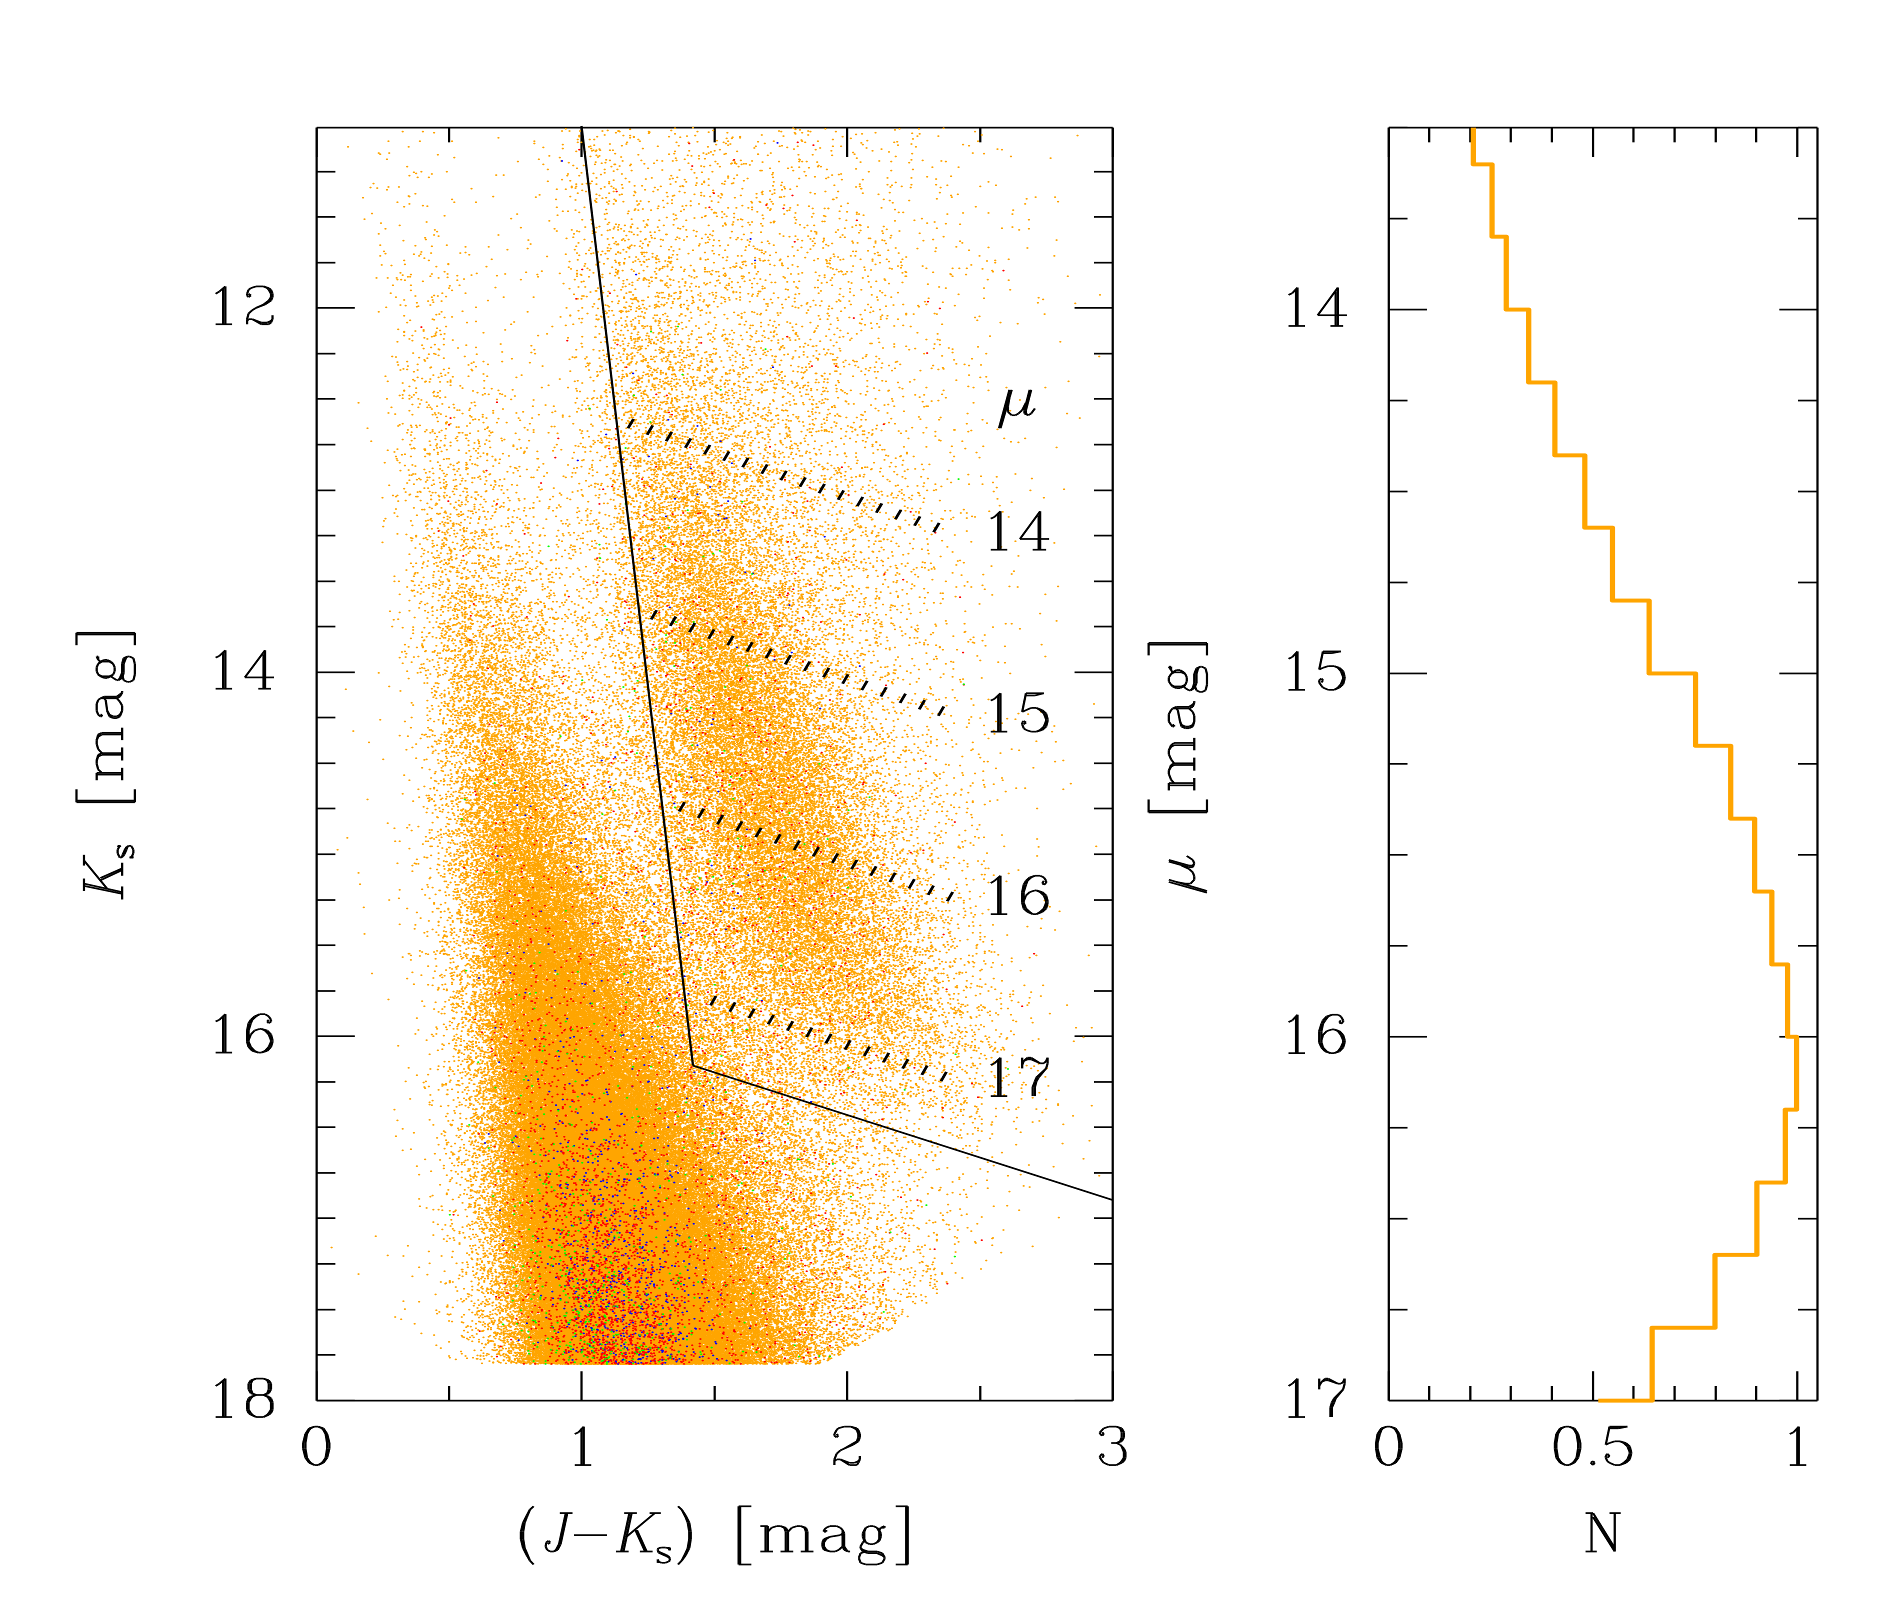
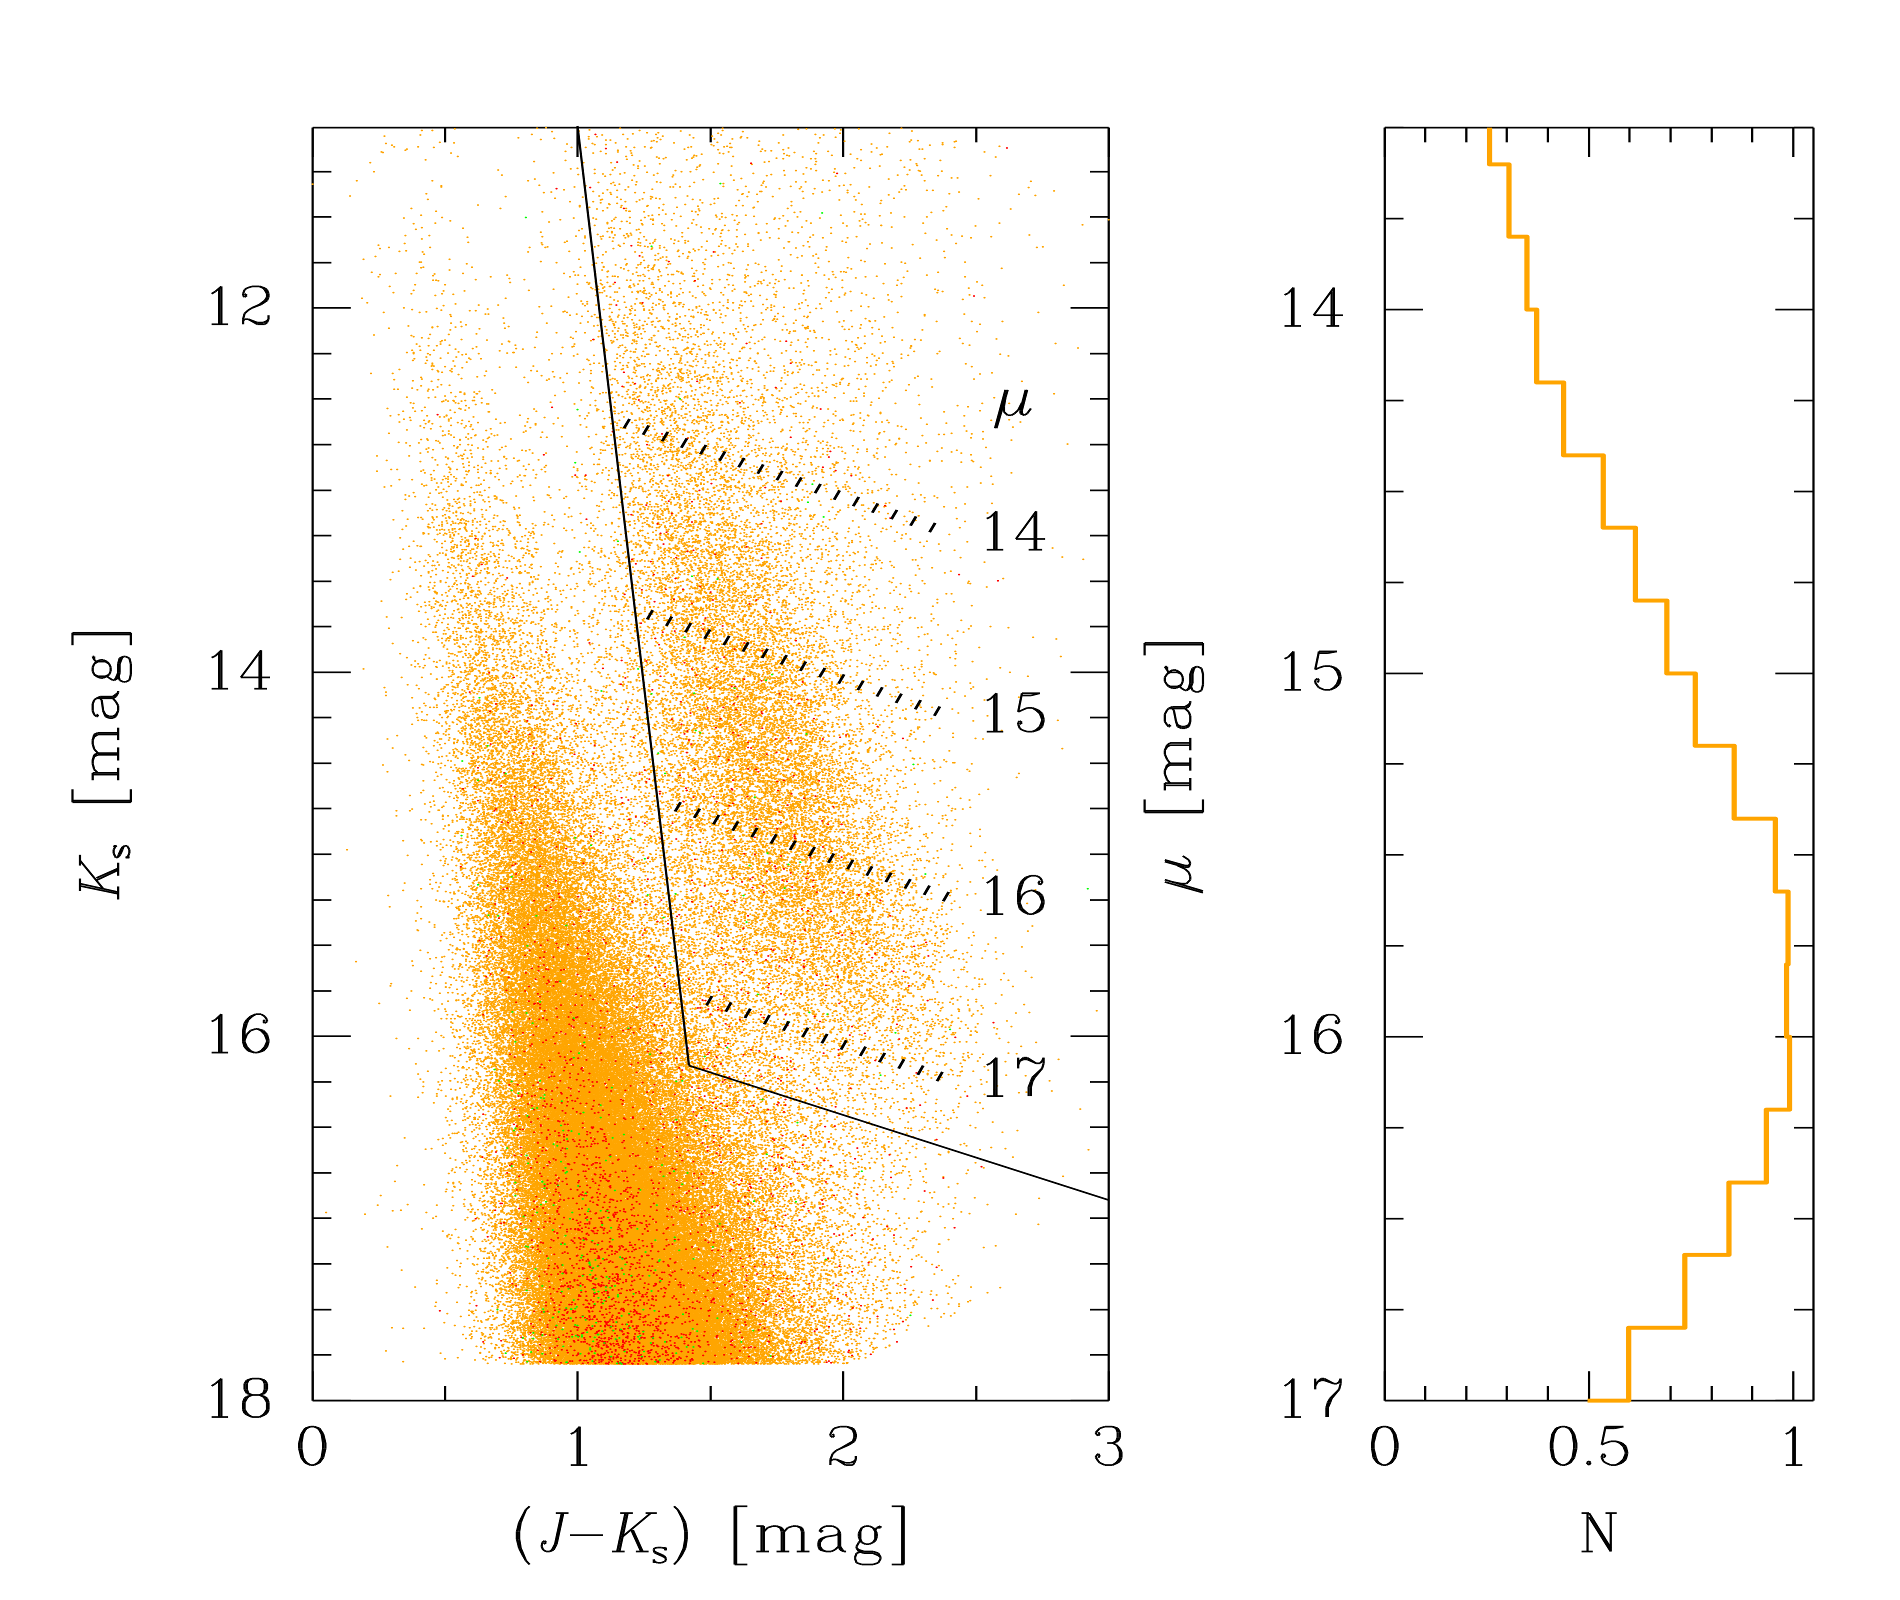
Our analysis of the stellar content along the line of sight for the windows was performed using red clump (RC) stars as distance indicators. These stars have been used widely as standard candles to trace the Galactic structure. A comprehensive review about the RC stars is provided by Girardi (2016). Deeper VVV PSF data (Alonso-García et al., 2018) were used to build color-magnitude diagrams (CMDs) for the windows, including an independent analysis of VVV WIN 17133939, updated with the new photometry. The CMDs for VVV WIN 17133939, VVV WIN 16075258 and VVV WIN 14755877 are shown in the left panels of Figs. 2, 3 and 4, respectively. These figures also summarize in the right panels the results on the distances of the RC stars as described below.
The selection of the RC region was made case by case using a color cut directly on the CMDs. The selection made to separate the red giant stars from the stars of the main sequence does not need a very precise cut, since the stars of the RC are the most numerous stars in the giant branch. The distribution of the RC distances was then calculated using the distance modulus, . This equation assumes the RC absolute magnitudes calibrated using Gaia data by Ruiz-Dern et al. (2018), where and mag, as well as from Minniti et al. (2018). The distribution in distance modulus for the three windows is presented top right panels of Figs. 2, 3 and 4. Saito et al. (2011) argue that not all selected stars are RCs, but the presence of subgiant branch and RGB stars, or even main-sequence stars at fainter magnitudes, contribute to the smooth underlying background. These different populations do not affect the location of any sharp edges of the stellar distribution, which can, however, be well defined by the RC. We can assume the same behavior for the entire disk.
We applied then a polynomial fit to the luminosity function (LF) and subtracted it from the LF, aiming to obtain the net distribution of RC stars, free of the background LF sources (see the bottom right panels of Figs. 2 to 4). Finally, a multi Gaussian fit was applied for the distribution of window RC stars, and the mean distances for the RCs were found. This technique is widely used in studies of galactic structure (e.g., Rattenbury et al., 2007; Minniti et al., 2011; Wegg et al., 2015; Gonzalez et al., 2018; Surot et al., 2019). The peak of the distribution adjusted through the Gaussian fit represents the position of the highest density of RC stars for this distribution, while the errors estimates are obtained through the standard deviation of the sample data. The distances and respective uncertainties calculated for the RC peaks for the three windows are shown in Table 1.
For the three windows the RC distribution in distance shows the presence of distant secondary peaks at larger distances. The presence of a faint RC peak in Galactic CMDs is sometimes subject of controversy since it has also been interpreted as the red-giant bump (e.g. Nataf et al., 2011, 2013) instead of the signature of a secondary, farther structure in the same line of sight (e.g. Gonzalez et al., 2011; Saito et al., 2011; Gonzalez et al., 2018). To verify the hypothesis that our RCs map the presence of farther structures, we selected symmetric control fields in latitude (see Figs. 1) and then applied the same analysis described above. These fields should present the same stellar population as within the windows, however embedded in higher levels of dust. Similar to VVV WIN 17133939 (Minniti et al., 2018), the secondary peak is not present in the control fields (see the top right panels of Figs. 2 to 4). Since warping is negligible at these coordinates (e.g. Momany et al., 2006), one can interpret the second peak as the presence of a distant structure only seen within the windows where the extinction is low. In the control fields this structure is not visible because it is located behind the dust.
| Window Name | RC Peaks | PM | Tangencial vel. |
|---|---|---|---|
| Distance (kpc) | (mas y-1) | coord. (km s-1) | |
| VVV WIN | 11.2 2.3 | 7.19 2.28 | 381.64 121.05 |
| 17133939 | 15.2 3.9 | 6.09 2.67 | 438.82 192.39 |
| VVV WIN | 7.8 2.5 | 6.87 1.72 | 254.02 63.60 |
| 16075258 | 10.2 2.2 | 7.01 2.01 | 338.95 97.19 |
| 13.5 4.0 | 6.47 2.49 | 414.06 159.35 | |
| VVV WIN | 5.8 2.4 | 6.72 1.50 | 184.76 41.24 |
| 14755877 | 12.6 4.7 | 6.27 1.76 | 374.51 105.12 |
3 Model comparisons
In this section we compare our observational data with a stellar population synthesis model. In this exercise we made use of the Trilegal (Girardi et al., 2005) model to analyze the region around the red clump in the synthetic data. Trilegal is available in the VISTA colours, and labels the sources according to the Galactic component (bulge, halo, thin- and thick-disk). For the comparison we selected regions of 0.25 sq deg area, centered at the same central coordinates for the three low extinction windows: () = () deg for VVV WIN 1713–3939, () = () deg for VVV WIN 1607–5258 and () = () deg for VVV WIN 1475–5877. CMDs for the three regions are presented in the left panels of Figs. 5, 6 and 7.
Using the Trilegal flags for the galactic components, we found that for VVV WIN 1713-3939 there is a contamination by bulge sources in a fraction of 34.6%, however the majority of the sources are from the thin disk (63.9%). The sum of halo and thick disk corresponds to 1.5%. For the other two windows, thin disk sources are fully dominant: 98.0% for WIN 1607–5258 and 98.2% for VVV WIN 1475–5877. For the selection of the RC region we use the same cuts as in the observational CMDs, as well as the same steps in the calculation of the distance modulus and its distribution.
The distribution of RC stars versus distance moduli for the three windows are presented in the right panels of Figs. 5, 6 and 7. In all cases the distributions are smooth and seem to follow the luminosity function, with the star counts increasing down to mag. At fainter magnitudes the counts vanish, as expected in a distribution along a finite disk (e.g., Minniti et al., 2011). We note that in all cases the distributions do not show any evidence of the overdensities/peaks related to the RC as presented in the observational data. Since spiral arms are not modeled by the Trilegal synthetic model (Girardi et al., 2005), that reinforces our interpretation that the RC overdensities are caused by structures (spiral arms) along the line of sight of each window.
4 Proper motions and the tangential velocities
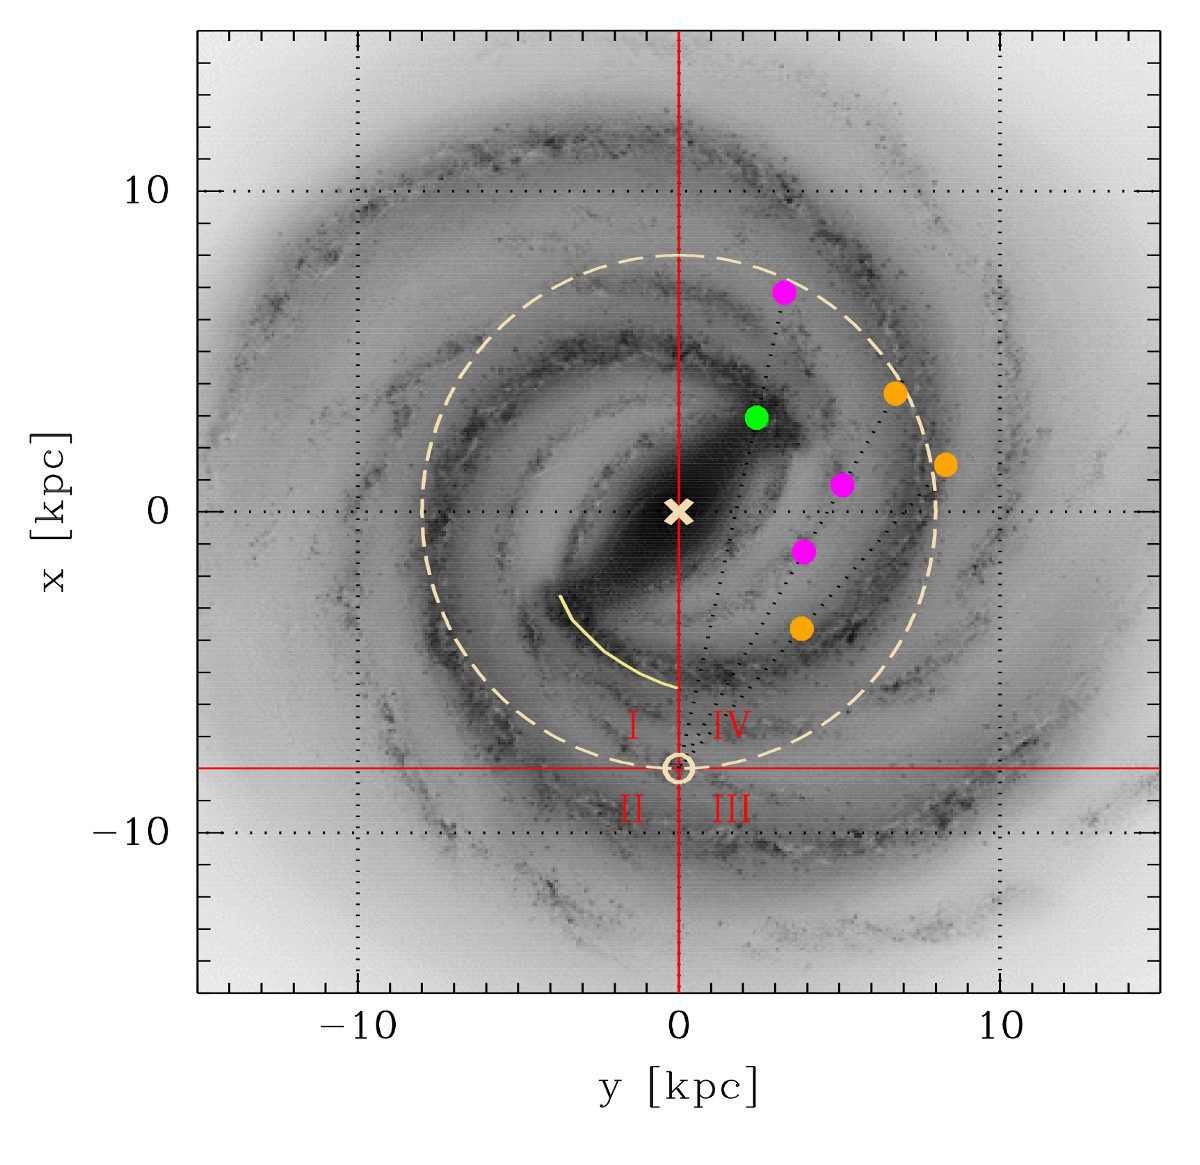
The magnitude difference between the two RC peaks changes in each window, thus assuming that the stellar populations do not change at those different positions, the double peak cannot be the RC and the RGB-bump, as their difference in magnitude should stay the same (e.g. Gonzalez et al., 2018). Therefore, we assume by hypothesis that the double peak is caused by RC overdensities at different distances along the line of sight. Fig. 8 shows the position of the RC peaks along the three windows overplotted with a schematic map of the MW adapted from Churchwell et al. (2009). If our assumption is correct, stars belonging to these peaks are located at different positions along the Galactic disk and therefore should present different bulk motions as a consequence of the differential Galactic rotation.
The VVV InfraRed Astrometric Catalogue (VIRAC, Smith et al., 2018) is a proper motion and parallax catalogue of the VVV survey. The catalogue includes 119 million sources with high quality proper motion measurements, of which 47 million have uncertainties below 1 mas yr-1 (Smith et al., 2018). We made use of the enhanced v2 version of VIRAC called VIRAC2 (Smith et al., in prep.), with a relative to absolute correction for the PMs using Gaia EDR3 (Gaia Collaboration et al., 2021).
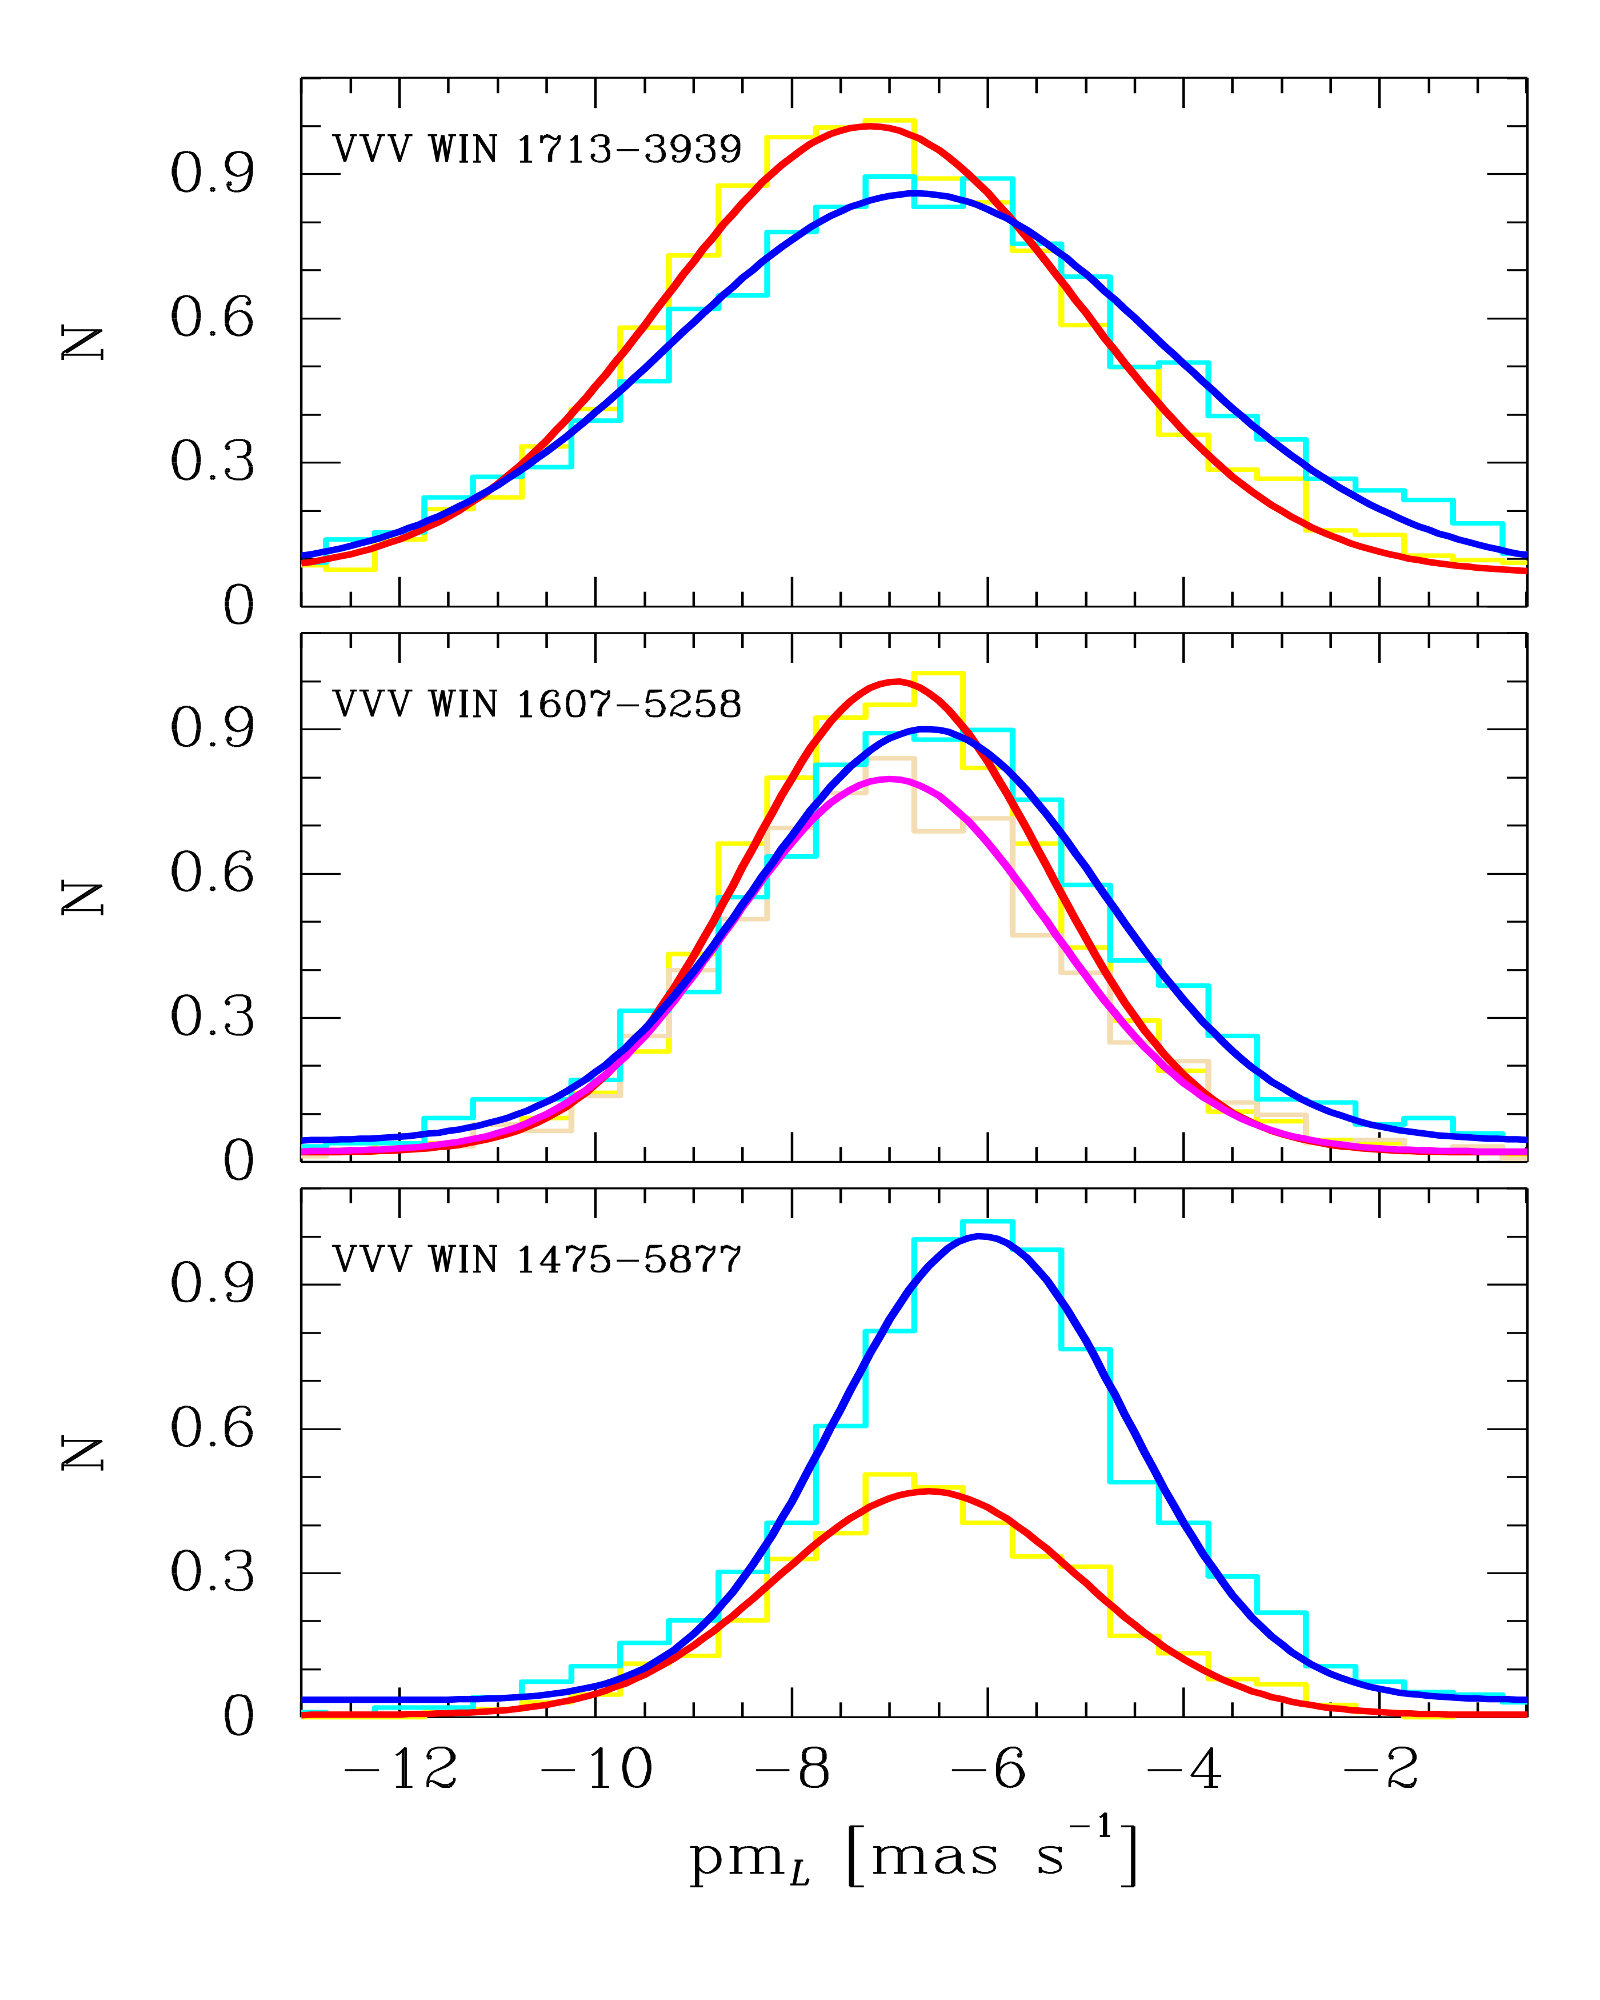
Stars belonging to each RC were selected from the CMDs (the diamond shaped boxes on the CMDs of Figs. 2 to 4) and then the PMs in the equatorial coordinates (, ) were taken from VIRAC. A transformation to the Galactic coordinates (, ) was performed using the method described in Poleski (2013) and then a Gaussian fit was applied to the PM distribution to get the mean value for each population as presented in Fig. 9). Finally, we converted the absolute PMs to physical velocities using the RCs distances for each window. Although our sample contains stars that are not part of the spiral arms, they do not affect our results, due to their low quantity, when compared to RC stars. Table 1 summarizes these measurement values.
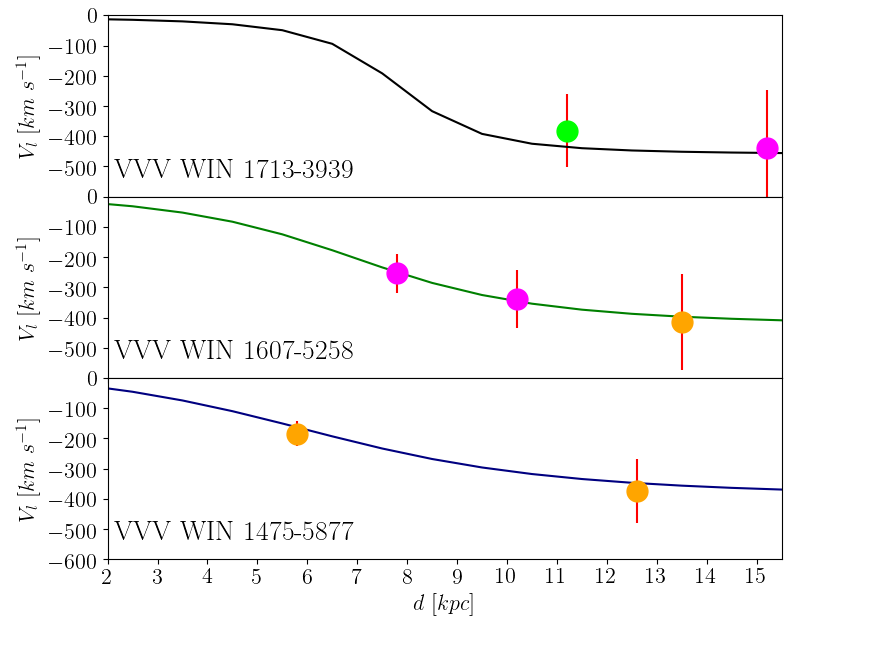
We compare our results with a simple rotation curve model, assuming the distance to the Galactic center as 8.18 kpc (Gravity Collaboration et al., 2019), the velocity of the solar neighborhood around the Galactic center as km s -1, and the peculiar motion of the Sun with respect to the Local Standard of Rest (LSR) as () = (14.0, 12.0, 6.0) km s -1 (Schönrich, 2012; López-Corredoira, 2014). Fig. 10 presents the distance distribution of our data compared with the model, showing excellent agreement.
5 Mapping the spiral arms
Our results demonstrate that both positions and velocities for the VVV RC peaks are consistent with expectations for the spiral arms across the disk. In Fig. 8 we note that the RC peaks in each line of sight cross different arms, in good agreement with each other, and consistent with the background image (adapted from Churchwell et al., 2009) based on radio, IR, and visible data which is widely used as a current view of our Galaxy. At the position of VVV WIN 17133939 the closer peak marks the end of the bar and/or the Perseus arm ( kpc). Due to the location of VVV WIN 1713-3939 it is not clear whether we are observing stars at the beginning of the Perseus arm or at the end of the galactic bar. The first peak in VVV WIN 16075258 and the more distant peak in VVV WIN 17133939 mark the position of the Norma arm ( and kpc) while the two RC peaks in VVV WIN 14755877 and the more distant peak in VVV WIN 16075258 mark the position of the Scutum-Centaurus arm (, and kpc). VVV data saturate for closer RC stars ( mag corresponds to kpc). The tangential velocities are also in good agreement with expectations for a rotation disk at that given distance, confirming that they share the bulk rotation of the MW disk.
Rezaei Kh. et al. (2018) has mapped the dust distribution in the Galactic disk out to 7 kpc, using RCs and giants stars from APOGEE DR14. This is the first dust map where arm structures have been detected. However this map is limited to the foreground disk (). This work traces the location of the Perseus arm and found evidences at the position of Orion Spur/local arm, parts of Sagittarius and especially the Scutum-Centaurus arm, which is shown in Fig. 8 overlaid on our result. While Gaia alone cannot detect clearly the spiral arms (see the maps of Anders et al., 2019), the work of Poggio et al. (2018) based on Gaia DR2 data also showed evidences of three overdensities of upper main sequence stars, that correspond to Sagittarius-Carina, Orion Spur/local and Perseus arms. Both works study the first and second quadrant (anticlockwise in relation to the Sun in our Fig. 8), while our complementary observations are in the fourth quadrant, at the far side of the disk.
6 Conclusions
We searched for new windows located at low Galactic latitudes ( deg) in the MW plane, reporting the discovery of two new clear near-IR windows: named VVV WIN 16075258 and VVV WIN 14755877. We analyzed these windows as well as the previously discovered window VVV WIN 17133939. The CMD for each window shows the presence of multiple RCs, with peaks at different magnitudes, indicating the presence of structures along the line of sight. Our work would help to improve future Milky Way models, as these structures are not present in the current models of synthetic population for the same lines of sight along the Galactic disk.
Distances for the RC are consistent with the expected positions for the spiral arms at the given lines of sight while the tangential velocities for the RC stars increase with the distance, corroborating our interpretation of structures at different distances across the Galactic disk. Tangential velocities are in good agreement with a simple rotation disk model. The signature of the Perseus arm (or the end of the bar), the Norma arm and Scutum-Centaurus arm are mapped. Our results indicate that the distribution of RC stars along low extinction windows are consistent both in distance and velocities with expectations for the spiral arms in the MW disk.
We gratefully acknowledge the use of data from the ESO Public Survey program ID 179.B-2002 taken with the VISTA telescope, and data products from the Cambridge Astronomical Survey Unit (CASU). R.K. acknowledges support from CNPq/Brazil. R.K.S. acknowledges support from CNPq/Brazil through projects 308968/2016-6 and 421687/2016-9. J.A.-G., acknowledges support from Fondecyt Regular 1201490 and from ANID – Millennium Science Initiative Program – ICN12_009 awarded to the Millennium Institute of Astrophysics MAS. D.M. gratefully acknowledges support by the ANID BASAL projects ACE210002 and FB210003 and by Fondecyt Project No. 1220724, and the Ministry for the Economy, Development, and Tourism, Programa Iniciativa Científica Milenio through grant IC120009, awarded to the Millennium Institute of Astrophysics (MAS).
References
- Alonso-García et al. (2018) Alonso-García, J., Saito, R. K., Hempel, M., et al. 2018, A&A, 619, A4
- Alves et al. (2002) Alves, D. R., Rejkuba, M., Minniti, D., & Cook, K. H. 2002, ApJ, 573, L51
- Anders et al. (2019) Anders, F., Khalatyan, A., Chiappini, C., et al. 2019, A&A, 628, A94
- Arp (1965) Arp, H. 1965, ApJ, 141, 43
- Baade (1951) Baade, W. 1951, Publications of Michigan Observatory, 10, 7
- Bland-Hawthorn & Gerhard (2016) Bland-Hawthorn, J., & Gerhard, O. 2016, ARA&A, 54, 529
- Camargo et al. (2015) Camargo, D., Bonatto, C., & Bica, E. 2015, MNRAS, 450, 4150
- Churchwell et al. (2009) Churchwell, E., Babler, B. L., Meade, M. R., et al. 2009, PASP, 121, 213
- Gaia Collaboration et al. (2016) Gaia Collaboration, Brown, A. G. A., Vallenari, A., et al. 2016, A&A, 595, A2
- Gaia Collaboration et al. (2021) Gaia Collaboration, Brown, A. G. A., Vallenari, A., et al. 2021, A&A, 649, A1.
- Girardi et al. (2005) Girardi, L., Groenewegen, M. A. T., Hatziminaoglou, E., et al. 2005, A&A, 436, 895.
- Girardi (2016) Girardi, L. 2016, ARA&A, 54, 95
- Gonzalez et al. (2011) Gonzalez, O. A., Rejkuba, M., Minniti, D., et al. 2011, A&A, 534, L14
- Gonzalez et al. (2018) Gonzalez, O. A., Minniti, D., Valenti, E., et al. 2018, MNRAS, 481, L130
- Gravity Collaboration et al. (2019) Gravity Collaboration, Abuter, R., Amorim, A., et al. 2019, A&A, 625, L1
- López-Corredoira (2014) López- Corredoira, M. 2014, A&A, 563, A128
- Marshall et al. (2006) Marshall, D. J., Robin, A. C., Reylé, C., Schultheis, M., & Picaud, S. 2006, A&A, 453, 635
- Minniti et al. (2010) Minniti, D., Lucas, P. W., Emerson, J. P., et al. 2010, New A, 15, 433
- Minniti et al. (2011) Minniti, D., Saito, R. K., Alonso-García, J., et al. 2011, ApJ, 733, L43
- Minniti et al. (2018) Minniti, D., Saito, R. K., Gonzalez, O. A., et al. 2018, A&A, 616, A26
- Momany et al. (2006) Momany, Y., Zaggia, S., Gilmore, G., et al. 2006, A&A, 451, 515
- Nataf et al. (2011) Nataf, D. M., Udalski, A., Gould, A., & Pinsonneault, M. H. 2011, ApJ, 730, 118
- Nataf et al. (2013) Nataf, D. M., Gould, A. P., Pinsonneault, M. H., & Udalski, A. 2013, ApJ, 766, 77
- Nidever et al. (2012) Nidever, D. L., Zasowski, G., & Majewski, S. R. 2012, ApJS, 201, 35
- Poggio et al. (2018) Poggio, E., Drimmel, R., Lattanzi, M. G., et al. 2018, MNRAS, 481, L21
- Poleski (2013) Poleski, R. 2013, arXiv:1306.2945
- Rattenbury et al. (2007) Rattenbury, N. J., Mao, S., Sumi, T., et al. 2007, MNRAS, 378, 1064
- Reid et al. (2014) Reid, M. J., Menten, K. M., Brunthaler, A., et al. 2014, ApJ, 783, 130
- Reid et al. (2019) Reid, M. J., Menten, K. M., Brunthaler, A., et al. 2019, ApJ, 885, 131
- Rezaei Kh. et al. (2018) Rezaei Kh., S., Bailer-Jones, C. A. L., Hogg, D. W., et al. 2018, A&A, 618, A168
- Robin et al. (2003) Robin, A. C., Reylé, C., Derrière, S., & Picaud, S. 2003, A&A, 409, 523
- Robitaille et al. (2012) Robitaille, T. P., Churchwell, E., Benjamin, R. A., et al. 2012, A&A, 545, A39
- Ruiz-Dern et al. (2018) Ruiz-Dern, L., Babusiaux, C., Arenou, F., Turon, C., & Lallement, R. 2018, A&A, 609, A116
- Saito et al. (2011) Saito, R. K., Zoccali, M., McWilliam, A., et al. 2011, AJ, 142, 76
- Saito et al. (2012) Saito, R. K., Hempel, M., Minniti, D., et al. 2012, A&A, 537, A107
- Saito et al. (2020) Saito R. K., et al., 2020, MNRAS, 494, L32
- Schönrich (2012) Schönrich, R. 2012, MNRAS, 427, 274
- Smith et al. (2018) Smith, L. C., Lucas, P. W., Kurtev, R., et al. 2018, MNRAS, 474, 1826
- Soto et al. (2019) Soto, M., Barbá, R., Minniti, D., et al. 2019, MNRAS, 488, 2650
- Surot et al. (2019) Surot, F., Valenti, E., Hidalgo, S. L., et al. 2019, A&A, 623, A168
- Vallée (2017) Vallée, J. P. 2017, AstRv, 13, 113
- van den Bergh (1971) van den Bergh, S. 1971, AJ, 76, 1082
- Wegg et al. (2015) Wegg, C., Gerhard, O., & Portail, M. 2015, MNRAS, 450, 4050