Pattern of inclusions inside rippled icicles
Abstract
Icicles that have grown from slightly impure water develop ripples around their circumference. The ripples have a near-universal wavelength and are thought to be the result of a morphological instability. Using laboratory-grown icicles and various species of impurities, including fluorescent dye, we show that a certain fraction of the impurities remain trapped inside the icicle, forming inclusions within the ice. The inclusions are organized into chevron patterns aligned with the peaks of the ripples. Within the chevrons, a substructure of crescent-shaped structures is observed. We also examine the crystal grain structure of laboratory icicles, with and without impurities. We present the first detailed study of these growth patterns in the interior of icicles, and discuss their implications for the mechanism of the ripple-forming instability.
I Introduction
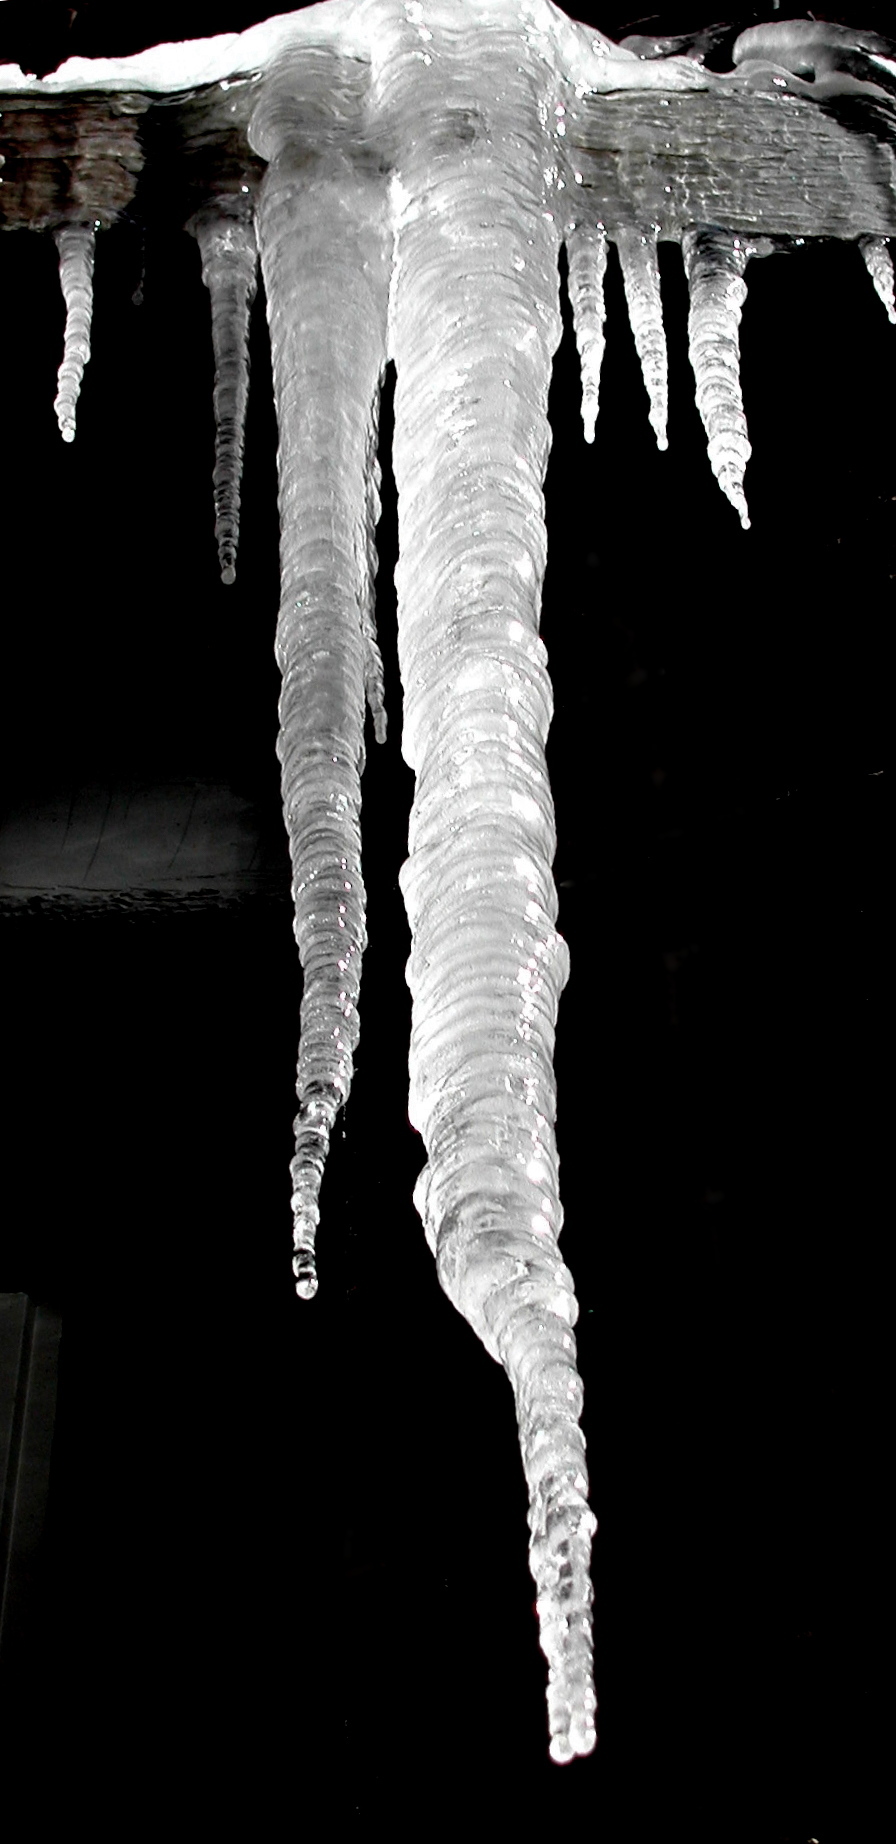
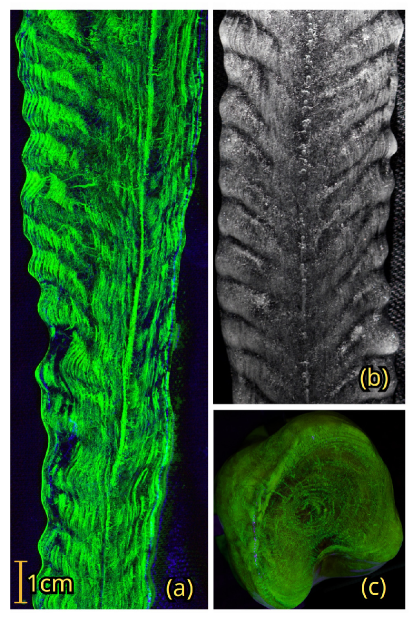
Icicles have a distinctive shape which is the result of a complex growth process [1, 2, 3]. Water flowing from a point of support into sub-freezing air forms an elongated ice structure which grows both in length and, more slowly, in width, with excess water dripping from the growing tip [4]. Small amounts of impurities in the feed water have profound effects on the evolving shape, triggering characteristic ripples that emerge around the circumference [5], as well as having other effects on the overall shape [6]. While dissolved impurities have been shown experimentally to lead to ripples, the underlying mechanism of this instability remains an open problem. Impure icicles also exhibit a foggy appearance, compared to ones grown from pure water. While atmospheric precipitation is typically quite pure, many naturally occurring icicles on structures nevertheless exhibit clear effects of impurities, as shown in Fig. 1.
In this paper, we build on previous laboratory work which uncovered the role of impurities in ripple formation [5], and which also revealed the complex nature of the exterior flow over the icicle surface [7]. Here, we study the distribution of trapped impurities and the crystal structure in the interior of the icicle, and how they are related to the exterior rippled shape. Our experiments are intended to shed new light on the elusive mechanism of the impurity-driven ripple formation.
Our work extends earlier observations of natural icicles by Laudise and Brand [8] and Knight [9], and the laboratory work of Maeno et al. [2, 3]. Using controlled icicle growth and dye techniques, we present the first detailed study of the pattern of impurities that remain in the ice and their relationship to the topography of the ice surface. We also studied the crystal structure and its relationship to the ripples and impurities. Our apparatus and Methods are described in Sec. II below.
The polycrystalline nature of icicles is well known [10]. It has also long been observed that some icicles contain significant amounts of unfrozen liquid water within their ice matrix — so-called spongy ice [10, 9, 2, 3]. Knight [9] attributed the foggy appearance of rippled icicles to air bubbles trapped inside the ice, which he proposed was the result of more rapid cooling near the ripple peaks. Knight further suggested that the sponginess indicated a particular crystal orientation, the c-axis parallel to icicle axis, which conflicted with the observations of Laudise and Brand [8], who found that the c-axis was mainly perpendicular to the icicle axis. These reports on natural icicles were made before the strong connection between feed-water impurities and ripples was established [5].
In this paper, we show in Sec. III that the foggy appearance is not due to trapped air bubbles, but rather due to small features we call inclusions which are actually pockets of highly impure liquid trapped inside the ice matrix. We examine the spatial distribution of the inclusions, which are organized into bands making a chevron pattern. Within the chevrons, we find that the inclusions are further organized into smaller substructures we call crescents. Chevron patterns in natural icicles were previously noted by Maeno et al. [2, 3]. The chevrons and crescents align closely with the growth and upward migration [5] of ripples on the icicle surface, as discussed in Sec. III.3. In Sec. III.6, we visualize the crystal grain structure within the ice and show that it is sometimes correlated with the ripple growth, with the liquid inclusions trapped within the crystallites, not at their boundaries.
II Experiment
To make icicles in the laboratory, we used a purpose-built icicle growing machine, which has been described in detail in several previous publications [6, 5, 7]. Briefly, it consisted of a refrigerated box filled with temperature controlled, turbulent air. The humidity in the box was continuously measured and was typically 85% during active icicle growth. Feed water was introduced at the top of the box at a controlled temperature and flow rate, and fell onto a slowly rotating conical support. The support rotation period of 8 minutes allowed all sides of the growing icicle to be visualized from the side of the box by a 36 MP SLR camera (Nikon D810). The rotation was indexed, so that images were acquired at 16 equally spaced rotational positions. This allowed the complete 3D shape of the icicle to be reconstructed using edge detection throughout its growth. To measure the inclusions inside the icicle, it was removed from the box for further analysis, as described in Sec. II.1 below.
A total of 51 icicles were grown, using distilled water with NaCl (30 icicles), Dextrose (5 icicles), or Sodium Fluorescein (16 icicle) as an impurity. The icicles were grown in several series, starting with the highest impurity concentration, followed by feed water diluted by half for each subsequent icicle. For one quarter of the icicles, the feed water was degassed by under vacuum while stirred by a magnetic stirrer for 10 minutes directly before the icicle machine was started. In our tests, this method reduced dissolved oxygen by , with less than 0.01% loss of water. The typical feed-water flow rate was 3.0 g/min, apart from one series of three Sodium Fluorescein icicles. The air temperature was held at values between -14.0∘C and -11.5∘C, consistent within ∘C for each series (-11.5∘C, -12.5∘C, -13.5∘C for Dextrose, and -14.0∘C).
The ionic concentration of source water used ranged between 0.04 mMol/kg to 43.8 mMol/kg, which is equivalent to between 1.2 ppm NaCl to 1280 ppm NaCl. This covers a wider range than would be expected for natural icicles. Chen et al. measured a typical concentration of 0.25 mMol/kg in snow from a rooftop and in melted natural icicles [5]. This was compared to 2.9 mMol/kg for tap water from Toronto Ontario, which forms icicles with prominent ripples. Melted natural icicles and their source water are generally intermediate in purity between distilled water and Toronto tap water.
II.1 Measuring the topography and inclusions
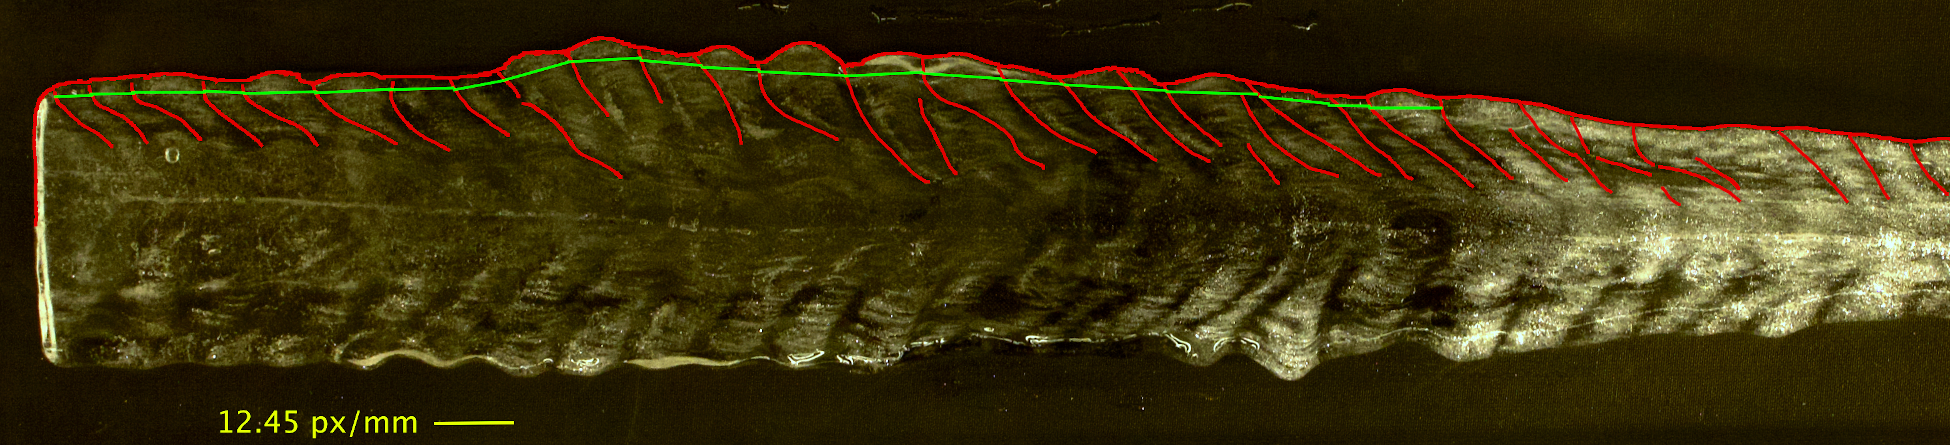
The topography of each icicle was extracted from the time-lapse photography
during growth using a canny edge detector, then refined using a simple
“in-painting” algorithm. Peaks in the topography were found with the Python
function scipy.signal.find_peaks() [11] with
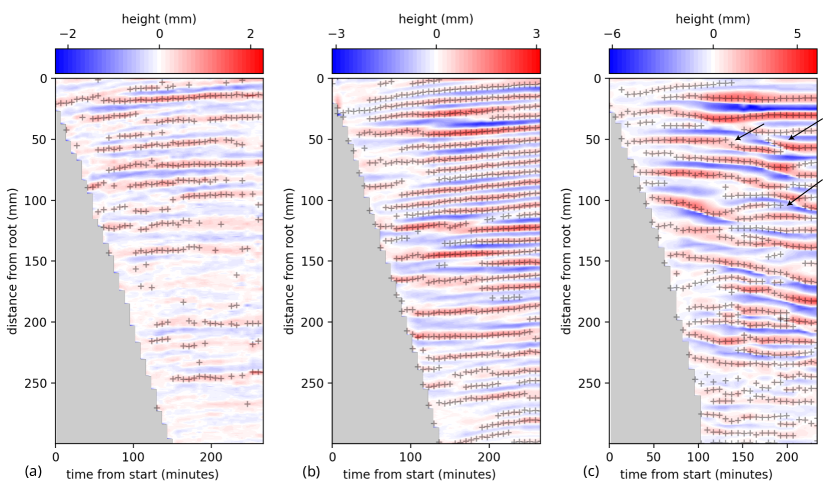
prominence=3 (3 pixels is approximately 0.2 mm). Several examples of the
mapped topography and the extracted peaks are shown in
Fig. 2. Each icicle was imaged over 700 times during
its growth, resulting in detected edges consisting of tens of thousands of data
points. We thus have rather complete information about the evolution of the
icicle’s external topography during growth, which can then be compared to the
distribution of impurity inclusions at the end of growth process, which could be
obtained by sectioning the icicle at a known rotational position.
After growing, the icicle and its support were removed from the box, and the icicle was sawed off below the tip of the support cone. It was then stored in a freezer at -24∘C until sectioning. Cross sections were taken parallel to the icicle axis by melting each icicle on aluminum plate to approximately 3mm thickness. The section thickness was selected to ensure there were enough interior inclusions visible to see a clear pattern, without occlusions from off-center layers.
Images of the sections were taken in a chilled box with a unidirectional light source, which scattered off inclusions inside the ice. The sections were placed on a black rubber mat with a steel ruler placed beside so that the resolution of each image could be measured. Before imaging, the sections were wiped with an absorbent paper towel to remove liquid on the surface and inside exposed inclusions. For the fluorescent dye, the icicles were illuminated with a strip of UV LEDs. The camera (a Canon EOS Rebel T2i SLR with a Canon EF-S 18-55mm lens) was positioned above the chilled box on a frame, and the images were later measured using ImageJ [12]. The results of this analysis are presented in Sec. III.3 below.
III Observations
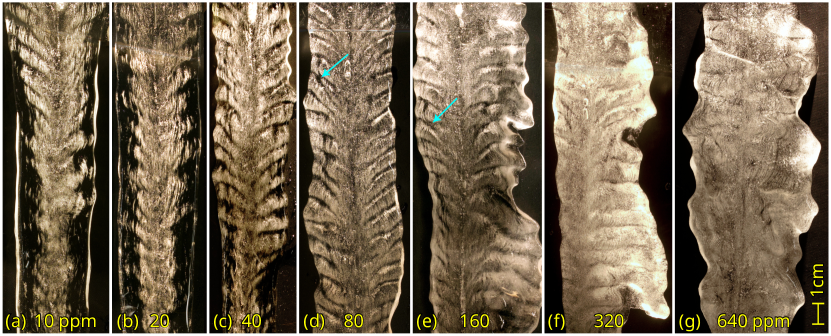
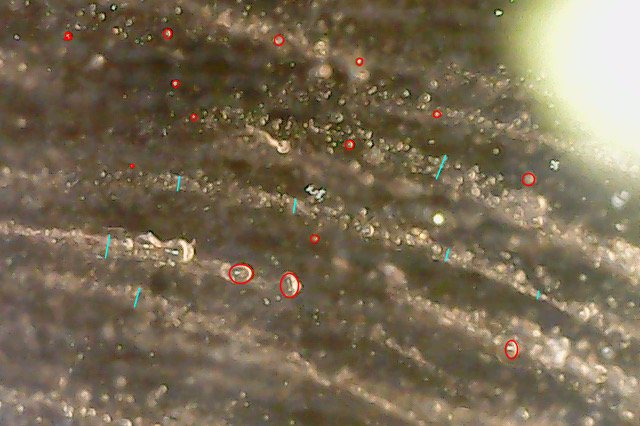
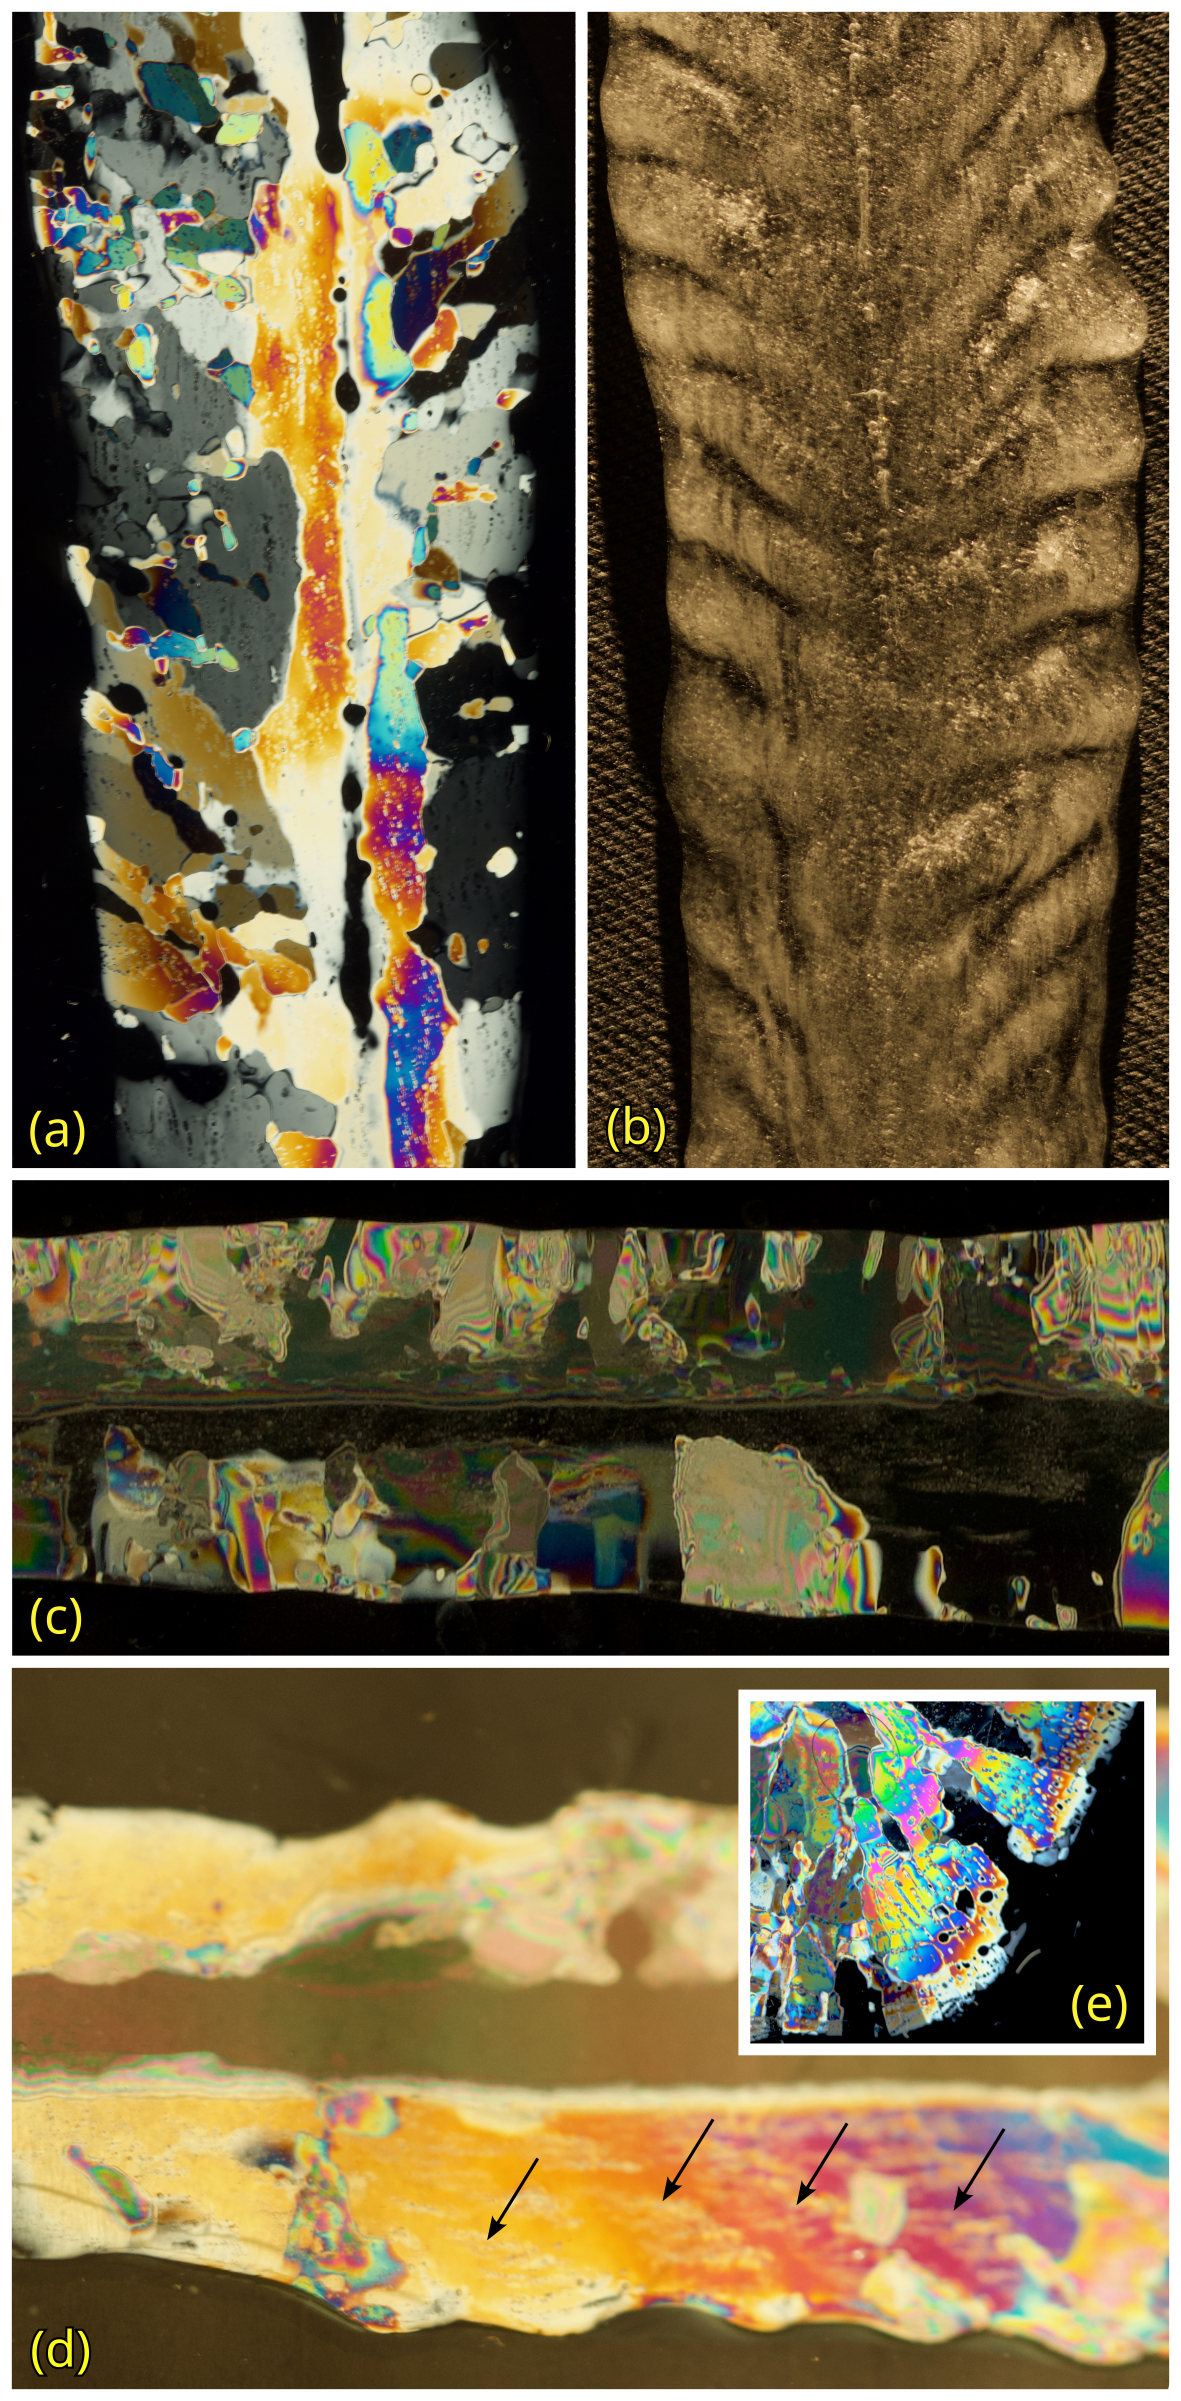
Inclusions are seen at a wide range of concentrations in icicles grown with NaCl, as shown in Fig. 3. As the impurity concentration in the feed water increases, the number of inclusions increases, as does the amplitude of the the ripples. At the lowest concentrations, the majority of the icicle is a pure phase of ice (Ice Ih according to the freezing conditions). In these nearly pure icicles, the inclusions organize themselves into crescent shapes. These structures within the ice trace the shape of the ripple peaks and are faintly visible in the upper part of Fig. 3(a) and more clearly in the microscopic view shown in Fig. 4. The crescents are formed of elongated clusters of individual inclusions.
As the concentration increases, the crescents of inclusions layer radially upon one another forming visible chevron bands of mixed-phase ice separated by lines of pure ice. These are most clearly seen in Fig. 3(c,d,e). The chevrons are angled upward, reflecting the upward migration of the ripples during growth at these concentrations. At 320 ppm NaCl, the single-phase ice is no longer present, and the icicles are saturated with inclusions, as shown in Fig. 3(g). At these concentrations, crescents and chevrons are no longer distinguishable from the general fogginess of the ice.
The small spherical inclusions, which were previously thought to be air bubbles [2, 9], are actually pockets of liquid with a high concentration of impurities, as we will establish using dye in Sec. III.1. Examining the inclusions in more detail, as in Fig. 4, we find that the inclusions range in diameter between 20 and 180 . The crescent features are typically 120 in width, and are still present even at higher concentrations when the chevron bands form.
The inclusions most likely have a spherical shape because their contents never freeze completely due to the icicle being above the eutectic temperature (-21.1∘C for \chH2O + NaCl). They will continue to evolve into a spherical shape in equilibrium while the icicle freezes, and during the rise in temperature as the section is made by melting on the aluminum plate. Air bubbles would not undergo the same evolution.
If the icicle is cross-sectioned perpendicular to its axis, as shown in Fig. 5(c), the crescent formations of inclusions appear as rings tangential to the icicle surface, rather like the growth rings of a tree. These growth rings were observed by Knight [9].
The shapes of the crescents and chevrons in the longitudinal cross-sections clearly record important features of the growth process leading to the rippled exterior shape of the icicle, including the upward migration of the ripples. We analyze the relationship between the pattern of inclusions and the shape in detail in Sec. III.3. The approximate periodicity of the crescents, in particular, suggests that they are due to cyclic episodes of wetting and freezing, as we discuss in Sec. IV.
III.1 Content of inclusions
Using sodium fluorescein as a fluorescent impurity, we find that the dye is concentrated into the inclusions, as shown in Fig. 5. The solid ice matrix is clear with no dye present. From this observation, we infer that the impurities are concentrated inside the inclusions. Because the icicle temperature is never below the eutectic temperature, the inclusions remain liquid.
Comparing the pattern of inclusions between fluorescein, \chNaCl and glucose at similar molal concentrations, we find that the inclusions are of similar size, shape and location. We conclude that the fogginess seen in rippled icicles is due primarily to scattering by inclusions — small pockets of liquid with higher concentrations of impurities — and not due to air bubbles. We conjecture that this will be true above the eutectic point for all species of dissolved impurities that cause constitutional undercooling.
We did not observe any air bubbles in any of our laboratory icicles. Air bubbles could only be discerned when a dye is used as the instability-triggering impurity. When fluorescein is used, there are so many dyed inclusions, that small non-fluorescent bubbles can not readily be seen. When the directional light source is added to the UV illumination, some inclusions exposed on the surface appear, but this is more likely a result from removal of liquid when the section is wiped than evidence of air bubbles. Maeno et al. observed oblong inclusions in the core of the icicle [1, 3], which could be air bubbles that emerge from the trapped liquid core (mode 3 growth in the nomenclature of Maeno et al. [3]). In our fluorescent dyed icicles, we observe a line of fluorescent inclusions along the central axis of the icicle where the liquid core freezes last. We discuss some possible differences between dissolved solids and gases in Sec. IV.
III.2 \chNa+ concentration in the ice
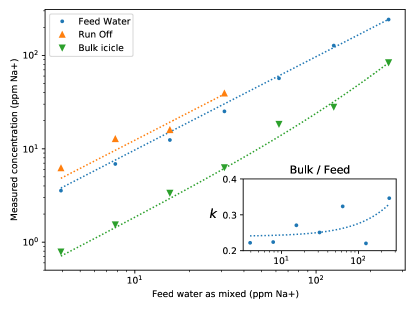
The presence of impurities inside of icicles grown with \chNaCl was also confirmed using ion chromatography by optical emission spectroscopy (ICP-OES). The feed water, runoff and bulk in-ice concentration were measured for a series of icicles with ICP-OES 111Thermo Scientific iCAP Pro ICP OES at the Analytical Laboratory for Environmental Science Research and Training (ANALEST), Department of Chemistry, University of Toronto.. The measured concentrations of \chNa+ are presented in Fig. 6.
The bulk concentration of Na+ that we observe is much higher than could be contained in single-phase ice. The segregation coefficient, , which quantifies how much NaCl can be contained in ice at a given temperature, is essentially zero in ice Ih, meaning very little NaCl or other impurities can be contained in the solid ice. Instead, almost all of the impurities are sequestered into liquid inclusions. The ratio of bulk ice (including inclusions) and feed water concentrations was found to be nearly constant at over the whole range of concentrations, with only a very slight increasing trend.
The trapping of NaCl in polycrystaline ice formed by freezing at a constant, nonzero speed has been studied experimentally by Weeks and Lofgren [13], in the context of sea ice formation. They found a solute distribution coefficient , analogous to our bulk ice to feed water concentration ratio, which was growth velocity dependent. Extrapolating this coefficient to zero growth velocity resulted in an effective solute distribution coefficient which is remarkably close to our value of this ratio. The value is the effective value of if the ice were to remain in a mixed-phase for a slowly advancing ice front. In their experiment, Weeks and Lofgren used steady growth conditions from a bath of constant concentration, and much higher concentrations from 1% to 3.3% NaCl.
We did not find a saturation of the bulk ice concentration at high concentration, as might have been expected. Instead, the bulk ice concentration increases linearly, so the amount of liquid contained in the ice matrix must also increase linearly with feed water concentration, even as the icicle becomes crowded with liquid inclusions. It is possible that there is a saturation point above the highest measured concentration of 640 ppm \chNaCl. Sea water, for example, is known to form icicles [14], but has a far higher NaCl concentration of about 35 000 ppm.
III.3 Connection between inclusions
and rippled topography
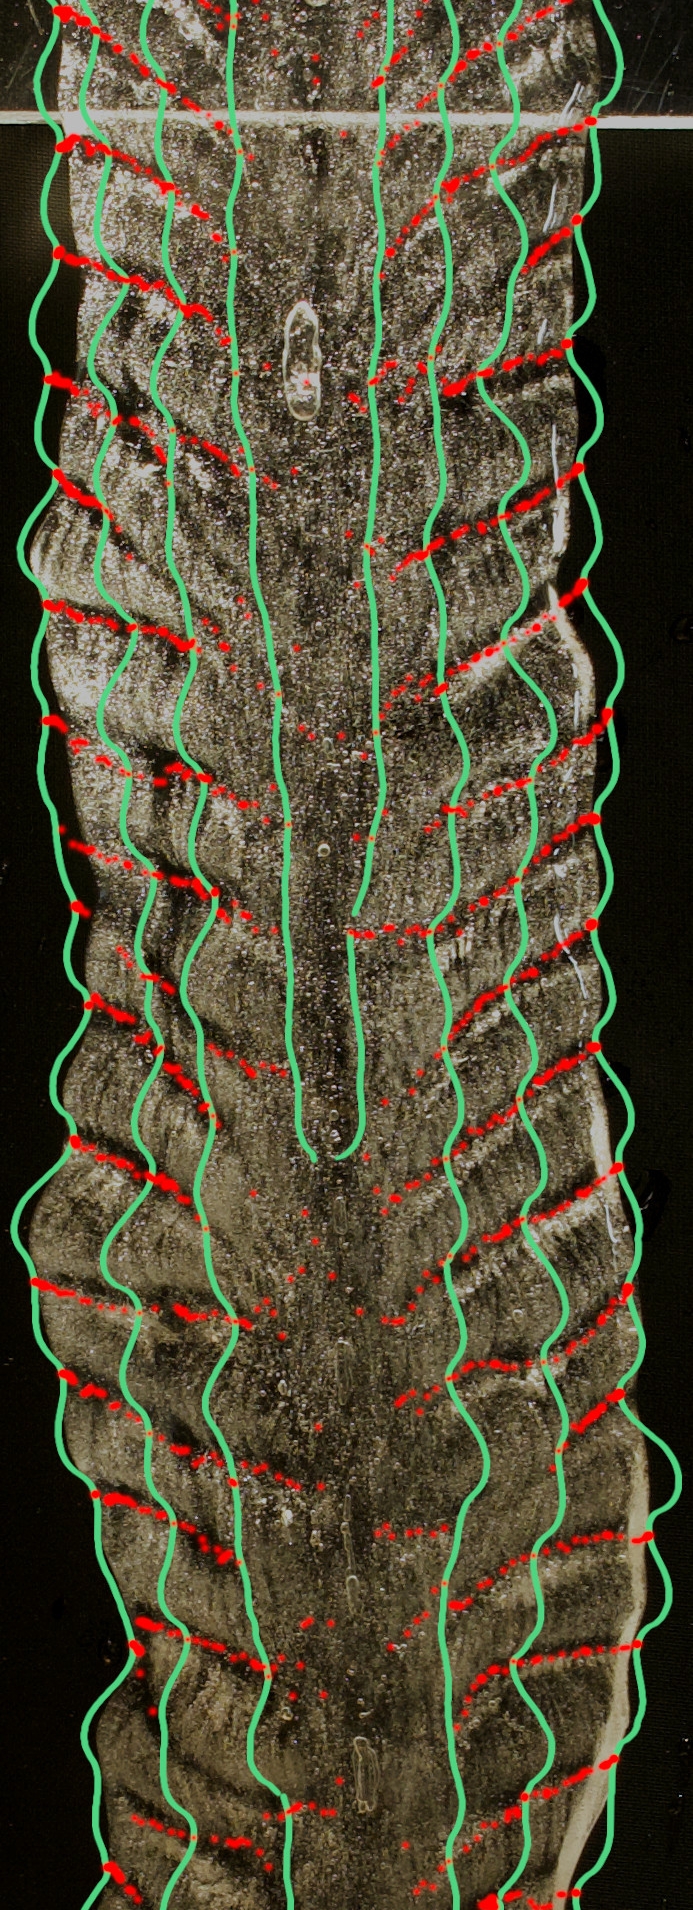
Examining Fig. 3, it is obvious to the eye that the bands of impurities inside the icicle are closely lined up with the exterior ripples. The peaked shapes of the crescent structures match up with the shapes of the ripple peaks, and the lines of pure ice align with the valleys between peaks. Using time-lapse images taken during the icicle growth, we can follow the time evolution of the topography and correlate it with a cross sectional image of the final distribution of inclusions. Fig. 7 illustrates this close correspondence.
It is frequently observed that ripples exhibit wavelength selection effects during their evolution: ripples crowd one another causing ripples to disappear, or ripples split, causing new ripples to appear between two existing ripples. These processes can be seen in Fig. 2, which shows the topography with peak tracking. Similar ripple creation and destruction events are traced out by bands of inclusions in cross sectional images, as in Figs. 3 and 9. These effects are most pronounced at the highest concentrations, when the icicle is densely filled with liquid inclusions.
III.4 Ripple wavelengths
The ripple wavelengths were determined using a statistical approach, based on real-space position measurements, both on edge detected topography and on cross sections. We measured the distance between adjacent features; peaks or valleys in edge data, bands in cross sections. The average of the distance measurements gives a ripple wavelength consistent with previous measurements that were made using a Fourier technique [5]. Maeno et al. [2] also used the mean distance between peaks to measure wavelength. This method allowed us to use data from a larger fraction of the icicle, as well as giving a better statistical understanding of the variability of the wavelength.
To obtain the ripple wavelength during growth, each icicle was imaged over 700 times, and both edges were detected, as described in Sec. II.1. This results in tens of thousands of position measurements of ripple peaks and valleys for each icicle. The wavelength was calculated independently for each edge (i.e. the left and right sides at each point in time), providing a wavelength at each point in time during growth. We found that the wavelength was constant throughout growth, so that the median value of all these wavelengths could be taken to be the ripple wavelength for each icicle during its growth.
We limited the edge sampling to a time and region where ripples are well-formed; between 90 and 240 minutes into growth, and the top 20 cm of the icicle. Results of this analysis are shown in Fig. 8. Even within these sampling limits, there remains a sampling bias caused by missing ripple peaks/valleys, which skews the wavelength distribution towards longer ripples. We use the mode of the wavelength distribution for each edge (rather than the mean or median) to reduce the effects of this sampling bias. We find that the wavelength is independent of the concentration and species of the impurity used. The average and variability of the wavelength of the icicles presented here are summarized in Tab. 1. Our results are consistent with those of Maeno et al. [2] and Chen et al. [5], which are also included in the table.
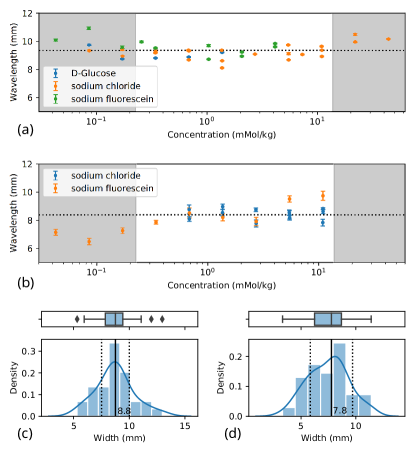
An independent estimate of the chevron band wavelength can be obtained purely from cross sectional images, albeit with smaller statistics. Longitudinal cross sections were analyzed using ImageJ [12]. The lines of pure ice between bands of inclusions were traced by hand, and the distances between adjacent lines were measured to obtain wavelengths. In practice, this rather manual procedure was limited to a “well behaved” concentration range where it was possible to easily distinguish and annotate the pure ice regions. Below about 7 ppm NaCl, coherent bands do not form, so annotations are unreliable, while above 500 ppm NaCl the ice is saturated with inclusions, so distinct chevron bands can no longer be picked out by eye. A sample measurement of the band wavelengths from cross sections in the well behaved region is shown in Fig. 9 and full results are shown in Fig. 8.
We find the wavelength of the chevron band features to be mm for the 25 measured cross-sections in the well behaved concentration range. As expected, the wavelength of the bands of inclusions (see Tab. 1) agrees with the wavelength derived from the topography. Both agree with the earlier estimate of 9.0 mm by Maeno et al. [3] and are slightly smaller than the Fourier value of mm for the topography found by Chen et al. [5].
| Dataset | Number | Average | Standard | 70% range |
|---|---|---|---|---|
| of icicles | (mm) | dev. (mm) | (mm) | |
| Edges | 40 | 9.35 | 0.57 | 8.7 - 9.9 |
| Sections: (all) | 30 | 8.30 | 0.68 | 7.78 - 9.06 |
| (well behaved) | 25 | 8.54 | 0.66 | 7.8 - 9.3 |
| Maeno et al. [3] | 19 | 9.0 | 7.0 - 10.0 | |
| Chen et al. [5] | 67 | 10.4 | 0.8 |
There is a slight trend toward longer wavelength at higher concentrations seen in the cross section measurements, which was also observed by Chen et al. [5], but it is not significant given our number of measurements, and not reflected in the wavelengths measured from the topography during growth. In the topography and in Chen’s measurements, the increase in wavelength is observed above the inclusion saturation point of about 500 ppm NaCl.
III.5 Migration of the ripple peaks
In Fig. 7, it is clear that the bands of inclusions closely coincide with the topography throughout the growth of the icicle, and the upward tilt of the chevron bands tracks the motion of the rippled topography. In order to quantify this effect, we compared the slope of the chevron bands to the positions of the ripple peaks over time.
It is only possible to determine the angles made by chevron bands in cross sections taken at intermediate concentrations, for which clear, well behaved bands are traceable. Using the same traced lines of pure ice shown in an example in Fig. 9, the typical angle of of the chevron bands was found to be to the icicle axis. Above 160 ppm NaCl, we observed much higher angle variability within each icicle. Below 160 ppm NaCl, the standard deviation was typically , while above 160 ppm NaCl it could be as high as . Thus, the speed of migration of the ripples becomes more variable well before the icicle becomes saturated with inclusions.
By tracking the peaks in the topography as in Fig. 2, we can extract the position of the peak relative to the icicle axis at each point in time. Fitting a line to those measurements gives a typical angle of to the icicle axis, which is consistent with the angle made by the chevron bands seen in the cross-section.
In icicles a higher concentrations that are saturated with liquid inclusions, we no longer observe lines of pure ice in the cross sections. This occurs at a concentration where Chen et al. [5] found the direction of ripple migration became more unpredictable and was often downwards. When we track the peaks in the topography, we observe the same unpredictable ripple migration at these concentrations. Ripple migration on saturated icicles is much more dynamic than at lower concentration: peaks may split, consume neighbors, or spontaneously form in valleys, as shown in Fig. 2(c).
We propose in Sec. IV that the direction of peak migration may be understood to be a consequence of the distribution of surface liquid on icicles.
III.6 Crystal grain structure
We used the same cross sectioning technique to examine the crystal structure of icicle sections at various concentrations. A selection of icicles viewed with cross-polarized filters are shown in Fig. 10. We found two consistent features in the grain structure of laboratory-grown icicles. First, the core of the icicle near its axis was one long continuous crystallite. There is generally a single crystal with its c-axis perpendicular to the icicle axis down the core, where the central column of liquid water freezes last. Secondly, outside the core, the crystallites near the root of the icicle are smaller than those lower down the icicle. The smaller crystallites near the root could be caused by the more rapid flow conditions encouraging more nucleation sites.
These two observations are consistent with what Laudise et al. reported for natural icicles [8], although their sample of natural icicles showed much more variety, which is likely due to the uncontrolled growth conditions. Laudise et al. also found that the slower growing c-axis was never parallel to the icicle axis and that it was often nearly perpendicular. In general, outside the core, the crystal orientations of the crystallites are rather random.
A third feature that was less consistent for rippled icicles was that the crystallites and grain boundaries outside the core were sometimes oriented with an upward bias, in a pattern similar to the chevron bands of impurities. These features are visible in Fig. 10(a,b). The grain boundaries were somewhat more likely to coincide with the lines of pure ice, with the trapped impurities clearly visible within the crystallites, not at the grain boundaries. Non-rippled icicles do not exhibit an upward bias in their grain shape. Instead, their grain boundaries are mostly perpendicular to the icicle axis, as in Fig. 10(c).
The correlation between the ripples and the grain structure is not strong, however. Often a crystallite will span multiple ripples, as in Fig. 10(d), or the there will be many small grains within a ripple, with only a barely discernible tendency towards a chevron-like pattern.
Our lab-grown icicles show the same ripples as natural icicles with the advantage of being able to control the water source and growing conditions. We have shown that the inclusions are primarily pockets of highly concentrated liquid trapped inside of crystallites. These inclusions form a record of the icicle growth — both of the formation of the rippled morphology, and of the cyclic wetting/freezing process.
IV Discussion
In this Section, we situate our observations in the context of previous work, and discuss how the inclusion patterns in the interior of an icicle may be related to previous observations of the flow pattern of liquid at the surface during growth [7]. Finally, we consider how our observations shed light on the overall problem of icicle morphology and the mechanism of ripple formation.
Although foggy, rippled natural icicles are commonplace, there have been relatively few published descriptions of their internal structure. Knight [9] observed sponginess and what he called “air bubbles” in icicles that have a “wrinkled” (i.e. rippled) appearance, and observed rings of inclusions in transverse cross sections. Maeno et al. [2, 3] observed foggy features inside of icicles coinciding with the ripples on the surface in a longitudinal cross section of an icicle collected in Sapporo during the winter in 1984, and likewise attributed the features to air bubbles. Both these studies were made before the crucial connection between ripples and impurities became clear in laboratory experiments [5].
Under the assumption that the inclusions were air bubbles, Knight thought that the spongy ice was primarily due to draining of liquid, while Maeno et al. suggested that “air bubbles” were evidence of rapid crystal growth. In addition, Maeno et al. assumed that the whole surface was wetted, so ripples would have to be from more rapid cooling at the protuberances. This explanation led to models of icicle morphology [15, 4] and linear stability theories of icicle ripples [16, 17, 18, 19, 20, 21, 22] which assumed that the icicle is completely covered by a thin flowing film of supercooled water. Subsequent experimental work [7] has shown that this is not the case and that the water actually flows over the surface in a complex pattern of transient rivulets.
Our observation that the inclusions are pockets of liquid indicates that a different process is involved in ripply icicle formation. The foggy, spongey ice is not due to draining of liquid from spongy ice, but actually the trapping of impure liquid. Thus, the inclusions are not evidence of rapid crystal growth, and may not be used to infer rapid cooling at protuberances.
While dissolved solids remain trapped in the liquid inclusions, dissolved gasses can escape to the atmosphere. For gasses to be trapped as bubbles, there would indeed have to be very rapid cooling, or some process that entrains and traps bubbles as the ice forms. Such a trapping process does occur in the core of the icicle, where the water can remain liquid well away from the tip, forming a long hollow region. This core water only freezes later by a sort of pipe-filling process, called mode 3 by Maeno et al. [3]. The shapes of bubbles formed during this process were observed by Maeno et al. However, we have observed using dye that liquid inclusions may still form in the core. Most of the body of an icicle is formed from liquid flowing and pooling on the outer surface of the icicle [7], where it is presumably in sufficient contact with the surrounding air that dissolved gases can escape before bubbles are formed.
We suggest that the location and trapping of impurities can best be understood by taking into account the way liquid flows and is otherwise deposited on the surface of an icicle. Previous experiments [7], which studied this process in detail, have shown that the flow proceeds by a series of intermittent rivulets accompanied by areas of stagnant surface wetting, rather than completely ensheathing the icicle. The nature of these flows is strongly dependent on the concentration of impurities, which change the wetting properties of the surface. It was observed directly that the liquid tends to reside preferentially on the upper surface of a ripple peak [7]. The wetting of an icicle is highly intermittent, which indicates a cyclic wetting/freezing process, as Knight suggested when he observed rings of inclusions in his transverse cross-sections.
The layering of the inclusions into the crescent structures may be interpreted as evidence of an iterated wetting/freezing process in the following way. The liquid that remains on the surface after a rivulet has passed is confined to a small wetted region. When that liquid is first deposited, it has the low initial concentration of the feed water, and pure ice can form unimpeded. Rejection of the impurities from the ice surface into the small volume of surface water would cause a rise in concentration in the liquid. Mushy ice [23, 24] can then start to form, trapping some impurities as inclusions while the remaining impurities continue to build up in the surface liquid. The next rivulet of liquid would then wash away or dilute the concentrated liquid, leaving a deposit with a lower concentration again. The freezing process can then repeat, forming a stack of crescent-shaped mixed-phase ice and pure ice, which organize into bands of impurities matching the rippled topography of the icicle.
The lines of pure ice that we observe in the cross sections are colocated with the mostly unwetted regions on the ice surface, while the areas with the most inclusions colocate with the areas that are wetted with surface liquid for the largest fraction of the time. In addition, the surface wetting and rivulet flow process is modified by the presence of impurities in such a way that even for constant overall flow rate, much more surface water is present at higher concentrations [7].
The rather low feed water concentration is far below the threshold for a mushy layer to form. However, because the liquid is confined on the surface, as it freezes, the concentration will rise above the critical concentration, and thus a mushy layer can form in a transient way. The confinement of impurities allows a high value of , the ratio of bulk ice to feed water concentration, of , to be reached, far larger than the segregation coefficient for planar ice growth . Our value of is similar to the lower limit value for spongy ice extrapolated to zero growth velocity [13], which would normally not be possible for such low concentrations.
All of these ice deposition effects conspire to cause a concentration-dependent rippling instability that corrugates the icicle topography into a pattern of ripples with a near universal wavelength. Obviously, there is much that we do not understand about the exact nature of this instability.
We also examined the crystal grain structure, because of anecdotal suggestions [10] that grain orientations may be connected to ripple growth. For example, Knight [9] observed that a knife blade could be inserted into the hollows of a ripply icicle, implying that the spongey parts were in the hollows. That simple observation led Knight to suggest that the preferred crystal orientation would have the c-axis parallel to the icicle axis. The liquid could then drain from between the basal sheets leading to trapped air bubbles. When we tried to perform the same knife blade observation on finished icicles, we found that, contrary to Knight, we could not insert a knife blade into the hollows, and that in fact the ice was mushiest near the peaks of the ripples. Knight acknowledged that previous work [8] had found that the c-axis was never parallel to the icicle axis. We hope that our observations help to clarify the relationship between mushy regions, crystal orientations and ripples.
The traces of the ripple pattern that we observe in the crystal grain structure might also be interpreted as an effect of the surface liquid dynamics. The observed incommensurability of the grain structure with the ripple topography shows that the ripples and their migration are not caused by the crystal orientation setting a preferred growth direction. Instead, we suggest that the growth of the ripples from the corresponding liquid deposits restrict the growth of the grains.
The large uninterrupted crystal can form in the core of the icicle, because the outside of the tip is always coated and its core is filled with liquid, which permits a slow, steady growth. The smaller grains near the top of the icicle are likely linked to the rapid change in temperature and/or flow in that region, which causes more rapid freezing. These inlet effects would be peculiar to our icicle machine, which is why the natural icicles observed by Laudise et al. [8] had much more variety in their grain structure.
The slight upward bias in the grain shape could be due to the liquid deposits being preferentially found on the top side of ripple peaks. If a new crystal nucleates on the top of a ripple peak, it has access to a large pool of water to steadily grow, whereas the “dry” area on the underside creates a barrier that limits grain growth downwards. Of course, all these effects are highly stochastic so that only a rather weak correlations between the ripples and crystal structure are observed.
V Conclusions
We conducted the most complete analysis to date of the foggy patterns of inclusions in the interior of icicles and their connection to ripples on the surface. We show that the inclusions are not air bubbles, but are actually pockets of water with high concentrations of impurities. The inclusions in the ice are organized into chevron bands, with crescent shaped substructures that match the growth and migration of ripples on the surface. The impurities trapped in the ice do not coincide with crystal grain boundaries, but the orientation and shape of the grains are slightly influenced by the growth mechanisms of the ripples.
The location and pattern of trapped impurities records the complex dynamics of the liquid on the surface of an icicle during growth. The inclusions collect in layered crescents, reflecting the intermittent wetting and freezing of liquid on the surface. Higher concentrations of liquid are achieved through the stagnation of liquid on the surface. This liquid tends to linger on the upper surface of ripples, where the highest concentration of impurities is trapped in the ice.
While the exact mechanism underlying icicle ripple formation is still unclear, our results give some insight into what a model of the instability must include. We propose that each step of the cyclic wetting/freezing process of ripple growth might be understood through mushy layer theory applied to a small, transient volume of liquid. This small scale process could be probed experimentally in greater detail by observing the freezing behaviour of discrete rivulets of water flowing over ice with low concentrations of impurities. The macroscopic rippling instability could then be accounted for by examining the stability of an averaged model of the underlying small scale processes.
References
- [1] N Maeno and T Takahashi. Studies on icicles. I. General aspects of the structure and growth of an icicle. Low Temperature Science, 43:125–138, 1984.
- [2] N Maeno and T Takahashi. Studies on icicles. II. Wave-forms, spikes and bent icicles. IJIW Temp. Sci., Ser. A, 43:139–147, 1984.
- [3] N. Maeno, L. Makkonen, K. Nishimura, K. Kosugi, and T. Takahashi. Growth rates of icicles. Journal of Glaciology, 40(135):319–326, 1994/ed.
- [4] Lasse Makkonen. A Model of Icicle Growth. Journal of Glaciology, 34(116):64–70, 1988/ed.
- [5] Antony Szu-Han Chen and Stephen W Morris. On the origin and evolution of icicle ripples. New Journal of Physics, 15(10):103012, October 2013.
- [6] Antony Szu-Han Chen and Stephen W. Morris. Experiments on the morphology of icicles. Physical Review E, 83(2):026307, February 2011.
- [7] John Ladan and Stephen W. Morris. Experiments on the dynamic wetting of growing icicles. New Journal of Physics, 23(12):123017, December 2021.
- [8] R. A. Laudise and R. L. Barns. Are icicles single crystals? Journal of Crystal Growth, 46(3):379–386, March 1979.
- [9] Charles A. Knight. Icicles as crystallization phenomena. Journal of Crystal Growth, 49(1):193–198, May 1980.
- [10] Jearl Walker. The Amateur Scientist: Icicles ensheathe a number of puzzles: Just how does the water freeze? Scientific American, 258(5):114–117, 1988.
- [11] Pauli Virtanen, Ralf Gommers, Travis E. Oliphant, Matt Haberland, Tyler Reddy, David Cournapeau, Evgeni Burovski, Pearu Peterson, Warren Weckesser, Jonathan Bright, Stéfan J. van der Walt, Matthew Brett, Joshua Wilson, K. Jarrod Millman, Nikolay Mayorov, Andrew R. J. Nelson, Eric Jones, Robert Kern, Eric Larson, C J Carey, İlhan Polat, Yu Feng, Eric W. Moore, Jake VanderPlas, Denis Laxalde, Josef Perktold, Robert Cimrman, Ian Henriksen, E. A. Quintero, Charles R. Harris, Anne M. Archibald, Antônio H. Ribeiro, Fabian Pedregosa, Paul van Mulbregt, and SciPy 1.0 Contributors. SciPy 1.0: Fundamental algorithms for scientific computing in python. Nature Methods, 17:261–272, 2020.
- [12] Johannes Schindelin, Ignacio Arganda-Carreras, Erwin Frise, Verena Kaynig, Mark Longair, Tobias Pietzsch, Stephan Preibisch, Curtis Rueden, Stephan Saalfeld, Benjamin Schmid, Jean-Yves Tinevez, Daniel James White, Volker Hartenstein, Kevin Eliceiri, Pavel Tomancak, and Albert Cardona. Fiji: An open-source platform for biological-image analysis. Nature Methods, 9(7):676–682, July 2012.
- [13] W F Weeks and Gary Lofgren. The Effective Solute Distribution Coefficient During the Freezing of NaCl Solutions. In Physics of Snow and Ice, volume 1(1), pages 579–597, Sapporo, Japan, 1967.
- [14] K.K. Chung and E.P. Lozowski. On the growth of marine icicles. Atmosphere-Ocean, 28(4):393–408, December 1990.
- [15] Martin B. Short, James C. Baygents, and Raymond E. Goldstein. A free-boundary theory for the shape of the ideal dripping icicle. Physics of Fluids, 18(8):083101, August 2006.
- [16] Naohisa Ogawa and Yoshinori Furukawa. Surface Instability of Icicles. Physical Review E, 66(4):041202, October 2002.
- [17] K. Ueno. Pattern formation in crystal growth under parabolic shear flow. Physical Review E, 68(2):021603, August 2003.
- [18] K. Ueno. Pattern formation in crystal growth under parabolic shear flow. II. Physical Review E, 69(5):051604, May 2004.
- [19] K. Ueno. Characteristics of the wavelength of ripples on icicles. Physics of Fluids, 19(9):093602, September 2007.
- [20] K Ueno, M Farzaneh, S Yamaguchi, and H Tsuji. Numerical and experimental verification of a theoretical model of ripple formation in ice growth under supercooled water film flow. Fluid Dynamics Research, 42(2):025508, April 2010.
- [21] Kazuto Ueno and Masoud Farzaneh. Morphological instability of the solid-liquid interface in crystal growth under supercooled liquid film flow and natural convection airflow. Physics of Fluids, 22(1):017102, January 2010.
- [22] Kazuto Ueno and Masoud Farzaneh. Linear stability analysis of ice growth under supercooled water film driven by a laminar airflow. Physics of Fluids, 23(4):042103, April 2011.
- [23] M. G. Worster and J. S. Wettlaufer. Natural Convection, Solute Trapping, and Channel Formation during Solidification of Saltwater. The Journal of Physical Chemistry B, 101(32):6132–6136, August 1997.
- [24] M. G. Worster. The Dynamics of Mushy Layers. In S. H. Davis, H. E. Huppert, U. Müller, and M. G. Worster, editors, Interactive Dynamics of Convection and Solidification, NATO ASI Series, pages 113–138. Springer Netherlands, Dordrecht, 1992.