Impact of Radiation Feedback on the Formation of Globular Cluster Candidates during Cloud–Cloud Collisions
Abstract
To understand the impact of radiation feedback during the formation of a globular cluster (GC), we simulate a head-on collision of two turbulent giant molecular clouds (GMCs). A series of idealized radiation-hydrodynamic simulations is performed, with and without stellar radiation or Type II supernovae. We find that a gravitationally bound, compact star cluster of mass forms within when two GMCs with mass collide. The GC candidate does not form during a single collapsing event but emerges due to the mergers of local dense gas clumps and gas accretion. The momentum transfer due to the absorption of the ionizing radiation is the dominant feedback process that suppresses the gas collapse and photoionization becomes efficient once a sufficient number of stars form. The cluster mass is larger by a factor of when the radiation feedback is neglected, and the difference is slightly more pronounced (16%) when extreme feedback is considered in the fiducial run. In the simulations with radiation feedback, supernovae explode after the star-forming clouds are dispersed, and their metal ejecta are not instantaneously recycled to form stars.
1 Introduction
The formation of a globular cluster (GC) has been a long-standing puzzle in galactic astronomy. Peebles (1984) first put forward the idea that the primordial gas in a dark matter halo may rapidly condense into a dense structure due to Lyman alpha cooling. Cosmological radiation-hydrodynamic (RHD) simulations verified that halos with mass can form a dense cluster when purely atomic gas collapses during the transition from a molecular-cooling to atomic-cooling regime (Kimm et al., 2016); however, the predicted internal metallicity spread in each GC candidate was significantly larger than that observed. Moreover, Trenti et al. (2015) proposed a similar scenario wherein the mergers of star-free mini-halos cause shock-induced gas collapse but the halo gas needs to be somehow pre-enriched by external sources to match the observed GC metallicity. Alternatively, a rapid collapse may occur inside a massive giant molecular cloud (GMC) in star-forming galaxies at high redshift (Kravtsov & Gnedin, 2005; Howard et al., 2019). This idea forms the basis of tagging methods wherein a fraction of star particles are assumed to represent potential GC candidates (e.g. Renaud et al., 2017; Pfeffer et al., 2018). Despite their simplicity, the models can successfully reproduce the color bimodality in GCs, which makes the formation channel appealing. The most relevant observational evidence in support of this scenario stems from the detection of young super star clusters in the Antennae galaxies (Whitmore & Schweizer, 1995). Additionally, compressive tides and/or shock compression due to galaxy mergers are likely to have played an important role in GC formation (Renaud et al., 2015; Kim et al., 2018b; Lahén et al., 2019). Improving upon tagging methods, Grudić et al. (2022b) applied a cluster formation model derived from their GMC simulations (Grudić et al., 2021) to a Milky Way-like galaxy, and showed that the cluster mass–size relation observed in nearby star-forming galaxies can be explained if denser GMCs form clusters with high efficiency. However, the detailed formation processes have not yet been rigorously investigated.
| Name | RF | SN | Ly | Remark | |||||||
|---|---|---|---|---|---|---|---|---|---|---|---|
| [] | [pc] | [] | [Myr] | [] | [pc] | [] | |||||
| Run-Fid | ✓ | ✓ | – | Fiducial | |||||||
| Run-Lya | ✓ | ✓ | ✓ | ||||||||
| Run-woRF | – | ✓ | – | ||||||||
| Run-HR | ✓ | ✓ | – | ||||||||
| Run-Static | ✓ | ✓ | – | – | – | No collision | |||||
| Run-Fid-woSN | ✓ | – | – | ||||||||
| Run-Lya-woSN | ✓ | – | ✓ | ||||||||
| Run-woRF-woSN | – | – | – |
In this paper, we focus on another scenario in which GCs form through the collision of GMCs. GMCs are known to be birthplaces of present-day star clusters (e.g. Cambrésy et al., 2002; Heyer et al., 2006). Although the star clusters tend to be less massive and compact than GCs, observational analyses of DR 21 (Dobashi et al., 2019), R136 (Fukui et al., 2017), and the Antennae galaxies (Tsuge et al., 2021) suggest that cloud collisions likely trigger star formation. Indeed, previous studies based on hydrodynamic simulations demonstrated that dense cores form in converging flows (Heitsch et al., 2009) and perhaps more effectively via cloud–cloud collisions (e.g., Takahira et al., 2018; Sakre et al., 2021). Furthermore, Tanvir & Dale (2020) showed that considerably more stars are created when colliding clouds are gravitationally bound, than when bound–unbound or unbound–unbound clouds collide. Moreover, Dobbs et al. (2020) demonstrated that for the formation of young massive clusters, high gas densities () and velocities greater than are required when two super-virial clouds collide.
Studies have also shown that the effects of radiation need to be understood to comprehend the evolution of GMCs. Krumholz et al. (2007) performed AU-scale simulations of turbulent protostellar cores with mass of and showed that the initial stellar mass function is significantly affected by the heating due to photoionization. Additionally, Geen et al. (2017) argued that the observed star formation efficiency of % in the Milky Way molecular clouds could be reproduced by including ionizing radiation in magnetized GMC simulations. Kim et al. (2018a) showed that photoionization feedback from stars effectively controls star formation efficiency by disrupting the GMCs within , as supported by the CO-to-H analysis of GMCs in star-forming galaxies (e.g., Chevance et al., 2022). In contrast, stellar winds, which are another form of early feedback, seemingly play a minor role iRn setting the properties of star clusters (Dale et al., 2013; Grudić et al., 2021).
Recently, Dobbs et al. (2022) reported the impact of photoionization in a dense region of a spiral galaxy with converging flows. More specifically, they simulated cluster formation in strongly and moderately converging regions along a spiral arm in the disks of galaxies similar to the Milky Way. They found that the star formation rate decrease by in the isolated filamentary structures when radiation feedback was included, whereas the effect was negligible in regions with multiple converging filaments.
Building upon previous studies, this work aims to investigate the impact of radiation feedback on the formation process of a massive compact cluster during cloud–cloud collisions, which may be seen as a progenitor of present-day GCs. Although such collisions between massive clouds seem to be rare in the local Universe, these may occur more frequently at high redshifts during the formation of dwarf galaxies (Kim et al., 2018b; Sameie et al., 2022). Thus, we employ RHD simulations with various forms of feedback, including photoionization, direct radiation pressure, non-thermal pressure due to multiple scattering of IR and photons, and Type II SN explosions.
This paper is organized as follows. Section 2 describes the initial conditions, numerical methods, and physical parameters of our simulations. Section 3 examines the formation process of a massive compact cluster and effects of stellar feedback on it. Section 4 discusses the relative importance of several forms of stellar feedback, the compactness of the massive cluster, and caveats in our simulations. Finally, Section 5 summarizes our results.
2 Radiation-Hydrodynamic Simulations
We perform RHD simulations of cloud–cloud collisions with the adaptive mesh refinement code ramses-rt (Teyssier, 2002; Rosdahl & Teyssier, 2015). For each spherical cloud, an initial number density of and temperature of are adopted. The initial radius of the clouds is set as , based on the mass–size relations of observed GMCs (Roman-Duval et al., 2010; Heyer et al., 2009; Oka et al., 2001). We place two clouds with mass 100 pc apart in a uniform medium with density and temperature . Turbulent velocity fields following the Kolmogorov power spectrum are developed over half of the free-fall time () of the cloud, at which point the virial parameter of each cloud reaches . We generate the random force fields via an Ornstein-Uhlenbeck process in a Fourier domain with a compressive to solenoidal ratio of 1:3 (see e.g., Federrath et al., 2010). To avoid a bulk cloud-scale motion due to the random forces, we limit the wave numbers to be greater than 6. The simulated volume of is covered by coarse cells with 4 pc resolution, which are further refined up to 0.25 pc (fiducial) or 0.125 pc (high-resolution case) when the gas mass in a cell exceeds . To better capture turbulent structures, the thermal Jeans length is resolved using at least 32 cells until the maximum refinement level is reached (Federrath & Klessen, 2012). Additionally, cells are refined if the change in pressure with respect to the neighboring cells is greater than 100%. To reduce the computational cost, we limit the refinement to regions representing a GMC using two passive scalars. Specifically, the outside of the clouds is minimally refined unless of the cell mass stems from either of the clouds. These yield computational cells, of which 1/3 are resolved at the maximum level.
To simulate star formation, the sink particle algorithm developed by Bleuler & Teyssier (2014) is employed. First, we identify gravitationally bound gas clumps using the Parallel HiErarchical Watershed (phew) algorithm (Bleuler et al., 2015) with a density of , where is the threshold density for sink particle formation. Following Bleuler & Teyssier (2014), we adopt , where is the speed of sound, is the gravitational constant, and is the size of the finest cell. The corresponding values for the runs with and resolutions are and , respectively. The accretion onto the sink particle is modeled using a flux accretion scheme. If the mass of a sink particle exceeds , a star particle of mass is created, which generates ultraviolet and optical photons, as detailed below.
The numerical methods and physical models of gas cooling and stellar feedback employed herein are identical to those employed in Kimm et al. (2019). The hydrodynamic equations are solved using the MUSCL scheme with a multi-dimensional MonCen limiter and HLLC Riemann solver (Toro et al., 1994). For radiative transfer, a GLF solver is adopted with a reduced speed of light approximation (, Rosdahl et al. 2013). The Courant number of 0.8 is used. To model photoionization, direct radiation pressure, non-thermal pressure due to multiple scattering of IR photons, and photo-electric heating due to dust, eight photon groups are employed, as detailed in Kimm et al. (2019, see their Table 1) in units of eV, these are: [0.1, 1.0), [1.0, 5.6), [5.6, 11.2), [11.2, 13.6), [13.6, 15.2), [15.2, 24.59), [24.59, 54.42), and [54.42,). The explosion of Type II SNe is modeled using a mechanical scheme developed by Kimm et al. (2015). To bracket the impact of strong radiation feedback, we also examine an extreme scenario where additional pressure due to photons is included, assuming that the local velocity structures of the scattering medium are static (Kimm et al., 2018). The spectral energy distribution of each star particle is derived from the Binary Population And Spectral Synthesis model (Stanway et al. 2016, BPASS v2.0) assuming a Kroupa initial mass function (IMF) with lower and upper cut-off masses of and , respectively. The initial metallicity of the clouds is set as , where is the solar metallicity. We adopt the metal yield of 0.075 for SN explosions. Gas cooling due to primordial species (HI, HII, HeI, HeII, HeIII, , and e-) is included by solving the non-equilibrium chemistry (Rosdahl et al., 2013; Katz et al., 2017), and the cooling due to metallic species is included based on the Cloudy calculations (Ferland et al., 1998) and fine-structure line cooling by Rosen & Bregman (1995, ‘cc07’ model in ramses).
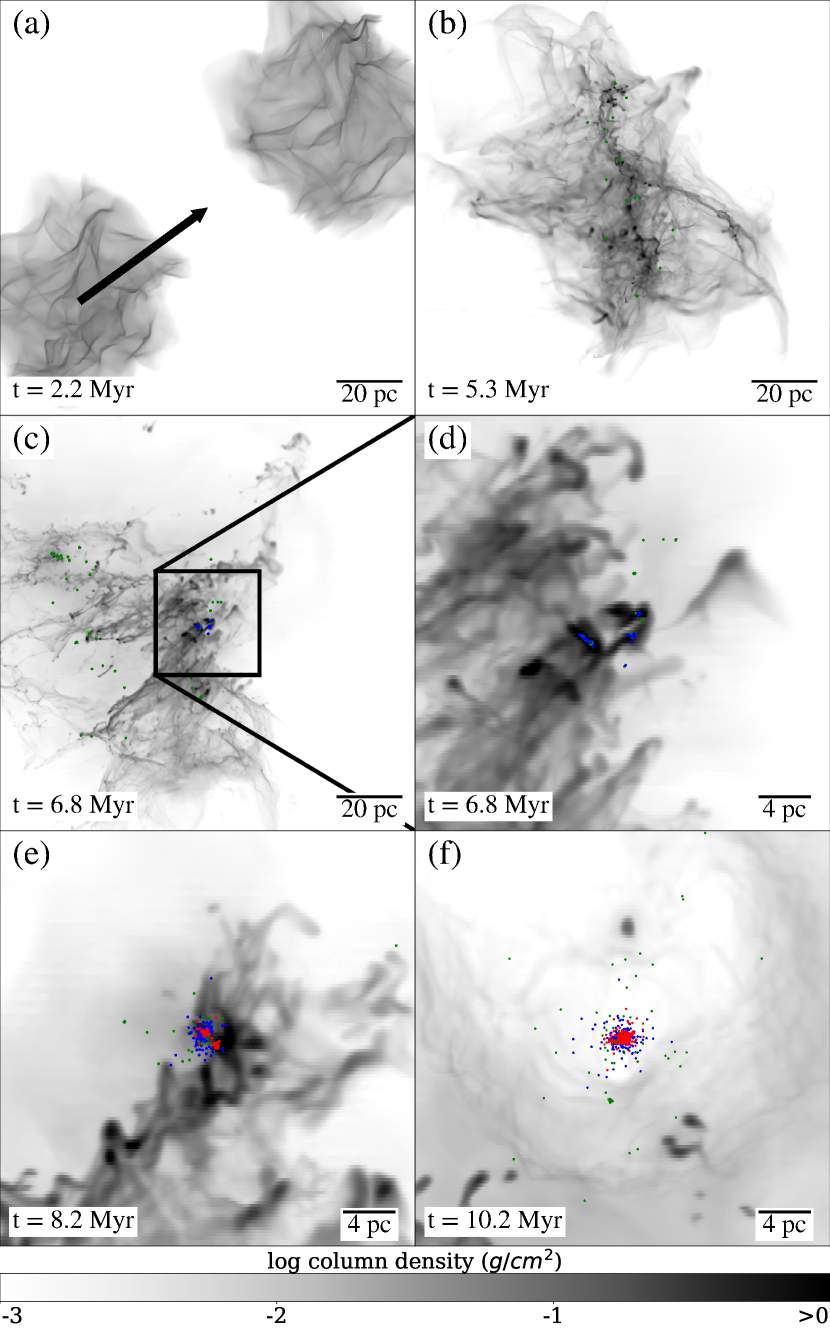
To model the head-on collision of two massive clouds, the velocity is added to the cloud in the lower left at (Figure 1, panel-(a)), and the other is kept stationary to minimize the numerical diffusion caused by the relative motion of clouds across the hydrodynamic grid (e.g. Robertson et al., 2010). In this study, is set to , motivated by the velocity range of collisions that induce locally enhanced star formation according to the recent idealized simulations of a disk galaxy embedded in a dark matter halo (Yoo et al., 2020, priv.comm.)111We also examined the case with , motivated by the high-velocity collision inferred from the radio observation of the formation of super star clusters in the Antennae galaxies (Tsuge et al., 2021). However, we found that with the clouds become gravitationally unbound and stretched along the direction of the collision, they form no star clusters.. We also perform a simulation with no cloud collision (Run-Static, ) as a control sample. Each simulation is run for –, at which point no additional stars are formed during the last Myr. The star clusters are identified using the DBSCAN method (Ester et al., 1996). The final cluster mass and radius are measured 1 Myr after the end of star formation in the GC candidates, except in the Run-woRF-woSN run where star formation continues. These correspond to 10.7, 10.1, 12.3, 10.6, 11.0, and 12.6 Myr for Run-Fid, Run-Lya, Run-woRF, Run-HR, Run-Fid-woSN, and Run-Lya-woSN run, respectively. In the case of Run-Static where no GC candidate is formed, we measure the stellar mass at , which is 1 Myr after the end of star formation in the entire simulated volume. Table 1 summarizes the setup of our simulations and physical properties of the GC candidate.
3 Results
3.1 Formation of a massive compact cluster
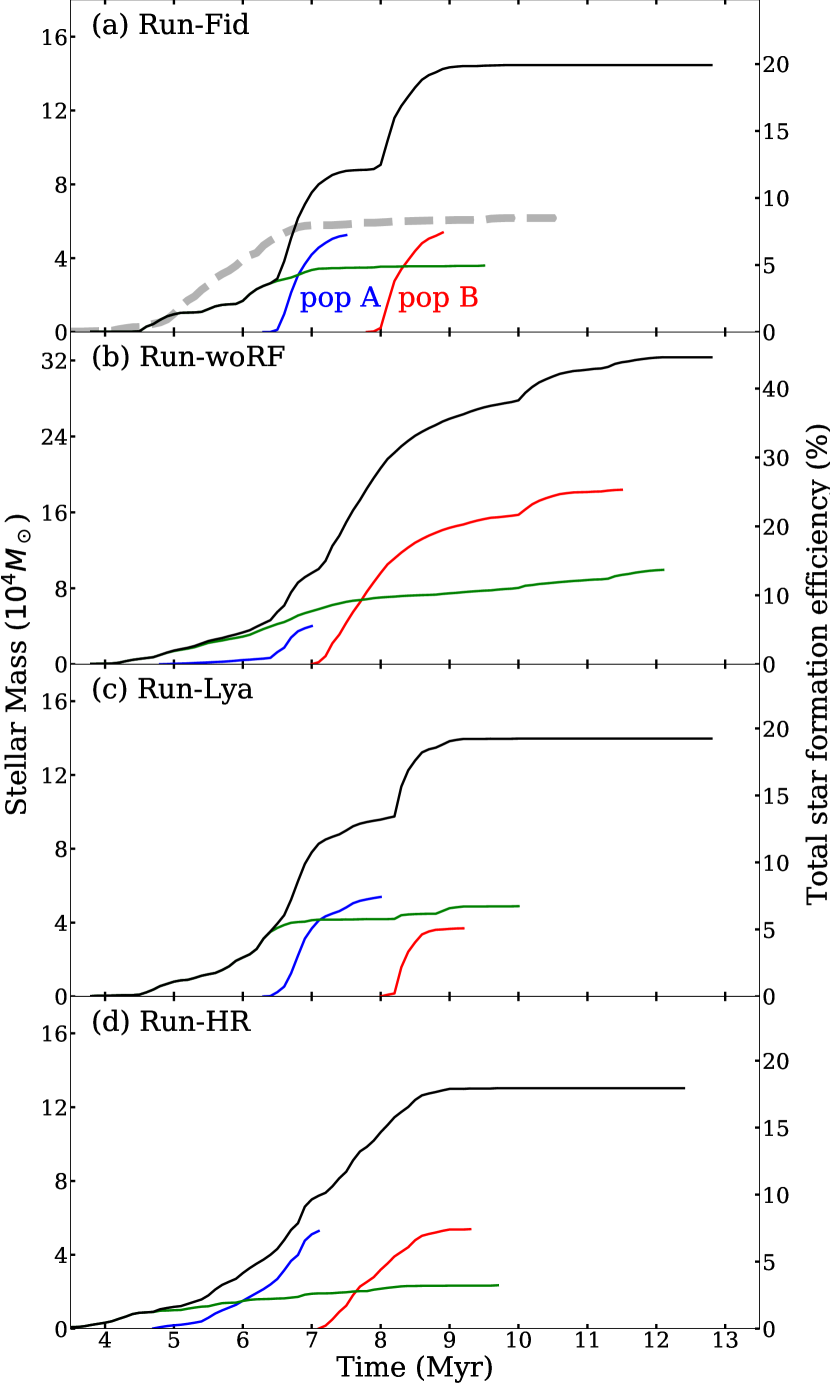
We begin by showing how a compact, massive star cluster forms when two GMCs, each of mass , collide head-on with (Run-Fid). As shown in Figure 1, the two clouds first coalesce at with a mild compression at their interface (panel-b). Because of the turbulent structures of the GMCs, star formation is not immediately triggered at the interface (c.f., Hunter et al., 2021), but the gas continues to collapse locally. At this stage, stars with the total stellar mass of are formed; they account for only of the total stellar mass produced by the end of the simulation. Note that none of these stars belong to the massive compact star cluster that emerges later. Most of the potential GC population starts appearing after the coalescence (). Several dense gas clumps that are located within a small region () first form stars individually and then start to merge around (not shown, but see the blue dots in Figure 1). The star cluster formed from the multiple clumps is similar to the GC formation picture presented in the hydrodynamic simulations of dwarf galaxy mergers (Lahén et al., 2019). Neighboring clouds and diffuse gas continue to accrete onto the cluster and form stars (red dots) until the radiation feedback entirely disrupts the gas clump at . This is corroborated in Figure 2 (panel-a), which depicts the star formation histories of the colliding GMCs. In this figure, the two populations, shown using blue and red lines (A and B, respectively), indicate that the compact cluster does not form in a single event but emerges due to the local collapse and merger, followed by gas accretion. The formation process occurs over a short timescale of –, resulting in a final cluster of mass with a half-mass radius of 0.33 pc in the fiducial case.
We note that the star formation efficiency per free-fall time is considerably higher () than in observed molecular clouds (1–2%) (Krumholz & Tan, 2007; Utomo et al., 2018). It is generally argued that this observed low efficiency arises from turbulence-regulated star formation in clouds with relatively low column densities and marginally high virial parameters – (e.g., Krumholz et al., 2006, 2009). In contrast, our simulated GMCs have lower virial parameters () and higher gas column densities (), compared to GMCs located in the Local Group galaxies (Bolatto et al., 2008) or the Milky Way (Heyer et al., 2009). Indeed, in model Run-static where no collision is introduced, of gas is converted into stars per free-fall time (Figure 2 (panel-a), grey dashed line), although no GC candidate is formed in Run-static. Such a high star formation efficiency is often obtained in the simulations of GMCs with high gas surface densities (e.g., Grudić et al., 2021; Kimm et al., 2022). We surmise that these more extreme physical conditions, typical of high-redshift galaxies, increase the likelihood of forming dense and compact clumps during cloud–cloud collisions, thus providing a favorable environment for viable GC candidate formation by boosting star formation efficiency.
In addition to the main cluster, the simulated GMCs form small compact star clusters with radius . In the fiducial run, two stellar aggregations with particles are identified; their masses and half-mass radii are , and , , respectively. They form either in a single clump (former) or during the merging of gas clumps (latter); however, no subsequent gas accretion occurs in these small systems, unlike the formation process of massive GC candidates. Such stellar aggregations are also formed in the simulation without cloud collision (Run-Static). We note that these small clusters do not form in the higher resolution run (Run-HR), as gas fragmentation is better captured, yielding even smaller clumps in size and mass (e.g., Price & Federrath, 2010; Federrath & Klessen, 2012). Stellar feedback then efficiently disperses gas clumps before they merge and form a massive clump that would otherwise end up as a star cluster of mass . In contrast, the GC candidate is still present in Run-HR, denoting that the formation of the massive compact cluster is less affected by resolution.
3.2 Effects of radiation feedback
With the potential GC, we study the impact of radiation feedback on the stellar mass, gas inflow/outflow, and metal enrichment of the compact clusters.
3.2.1 Star formation history
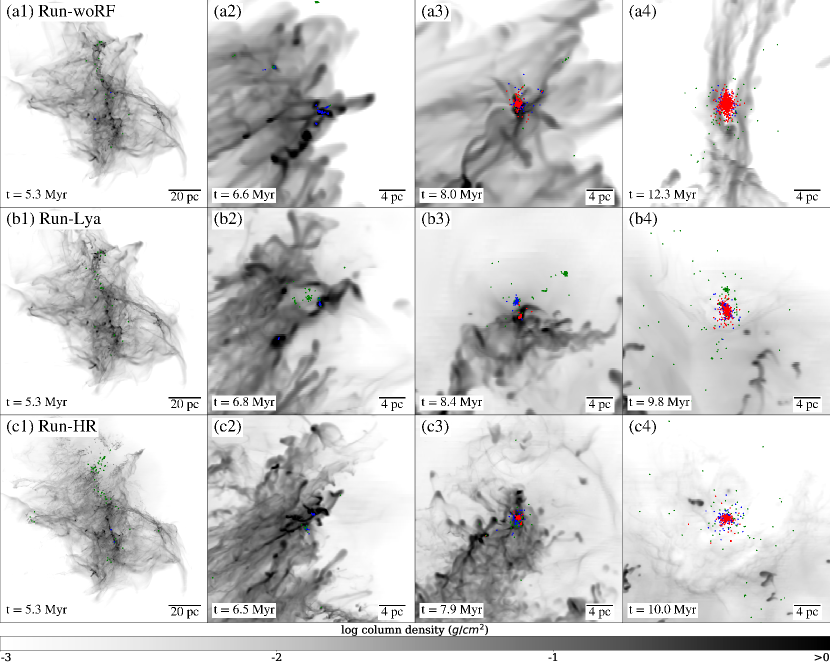
Figures 2–3 present the star formation histories and column density distributions of the run without radiation feedback (Run-woRF) where the star particles do not produce photons. Thus, both photoionization and radiation pressure due to UV and the multiple scattering of IR photons are ignored, while still considering SN explosions.
We find that an approximately twice more massive GC candidate forms in the Run-woRF run than in the fiducial run. In Figure 2, the stellar mass of the population A (stars formed before the one final massive clump appears) is slightly reduced, but this is because the mergers between gas clumps take place earlier than those in the fiducial run. The growth of stellar masses is not controlled in Run-woRF, and stars continue forming even after at which point the radiation feedback blows the gas away in Run-Fid (see also Figure 3). Consequently, 31% of the two GMCs is converted into the GC candidate within in Run-woRF, while only 15% forms stars in the Run-Fid run. Additionally, the mass of the second or third massive stellar aggregations increases by a factor of 2–3 ( or , respectively) in the absence of radiation feedback. This clearly demonstrates the importance of radiation in the formation of compact clusters. Thus, any simulation that does not account for radiation feedback will likely overestimate the stellar mass of a GC by a factor of .
The predicted stellar mass of a potential GC may decrease even further if additional nonthermal pressure operates on star-forming sites (see the second row in Figure 3). As demonstrated by Dijkstra & Loeb (2008, see also ), the resonant scattering of photons can accelerate dust-poor gas to several tens of , possibly suppressing the formation of metal-poor star clusters (e.g., Kimm et al., 2018; Abe & Yajima, 2018). Since the column density of neutral hydrogen in our metal-poor star-forming clumps tends to be high (), photons can easily scatter – times. Accordingly, the typical force multiplier of photons (), which is a measure of the enhancement in momentum transfer compared to the single scattering limit, can be large (–) (Kimm et al., 2018, see their Fig. 1). Thus, pressure may play an important role in GC-forming sites. Strictly speaking, the number of resonant scatterings sensitively depends on the velocity structure of the ISM, but here the scattering medium is assumed to be static to maximize the impact of feedback. Therefore, the Run-Lya run should be considered as an extreme model where early feedback due to radiation is enhanced, disrupting star-forming clumps. More realistic simulations will likely yield results between the fiducial and Run-Lya model.
We find that the additional pressure prevents the gas from accreting onto the formation site and suppresses the total stellar mass growth. The stellar mass of population A is little affected because the gas clumps rapidly collapse before the pressure becomes effective. However, feedback from this population reduces the gas mass within the radius of 6 pc (10 pc) from the cluster center at from () in the fiducial run to (), respectively. Moreover, as shown in Figure 2 (panel-(c)), pressure intervenes in the star formation of population B in (see the red line), which is significantly faster than that for the fiducial case, wherein it takes to quench star formation. The mass of population B is reduce by 33% in Run-Lya, and the total stellar mass of the potential GC decreases by 16% ().
3.2.2 Gas inflow and outflow
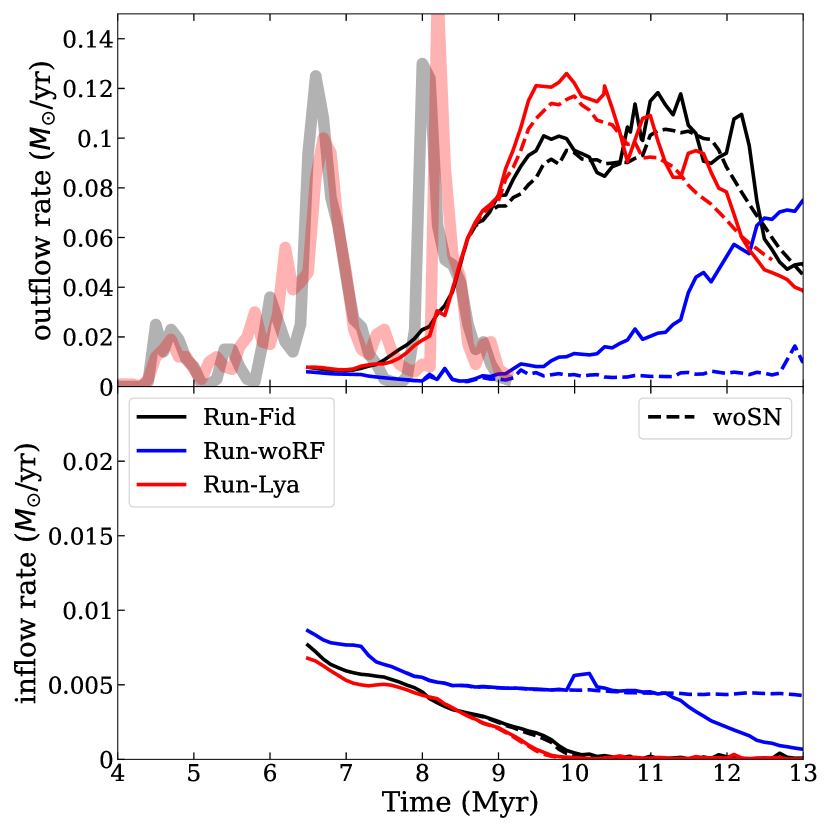
Figure 4 presents the gas outflow and inflow rates measured at the spherical surface of radius 128 pc from the center of the two GMCs (gas plus stars). The surface is taken as large as possible in order to avoid any confusion due to the colliding motion of the two GMCs. By doing so, we confirm that the net inflow plus outflow rate is close to zero in Run-woRF-woSN.
Outflows start appearing at even before the massive compact cluster forms and destroys the gas clumps. This happens because the radiation from the underlying population in the neighboring region also drives the winds (see the green lines in Figure 2). After , SN explosions from the underlying population also play a role in enhancing the gas outflow, as can be inferred from the comparison with the simulations without SNe (dashed lines in Figure 4). The dense gas in the potential GC-forming site is dispersed only at , and SN explosions from the GC candidate are mainly responsible for the enhanced outflows at , with velocities up to at Myr. Given that the outflow rates are at , the bulk mass loading factor may be estimated as , where is simply taken as the total stellar mass divided by 5 Myr. In contrast, if we take the stellar mass of the underlying population, the mass loading factor would increase by a factor of four ().
The outflow rates in the fiducial run with radiation feedback are systematically larger than those of Run-woRF at . The typical density and velocity of the outflows are 1–2 and 30–100 , respectively. Note that even in this case with a high star formation efficiency of , the density of the gas outflows on the GMC scale is significantly smaller than the electron density () inferred from the metal emission lines in star-forming galaxies at high redshift (e.g., Sanders et al., 2016; Schreiber et al., 2019). We attribute this to the fact that photoionization heating overpressurizes the medium, efficiently lowering the density (e.g., Krumholz et al., 2007); in contrast shock compression due to SNe may play a role on the galactic scale (Schreiber et al., 2019). The outflowing density and velocity in the Run-Lya run further increase due to the destruction of the dense star-forming clumps because of the strong radiation pressure. This increases the outflows by . Furthermore, gas inflow rates are suppressed in the runs with radiation feedback, and even become almost zero within from the onset of star formation; this indicates that the impact of radiation is not limited to a small volume of star-forming clumps but extends to a large solid angle. The outflows become weak rapidly at , as the majority of the GMC gas is blown out and the average density in the sphere with radius of is reduced ( at ).
Note that the formation of a potential GC ends before their massive stars explode as SNe. This means that radiation can drastically alter the environment into which SNe propagate (e.g., Chevance et al., 2022). For example, SNe around emerge at in the absence of radiation feedback (Run-woRF), but they explode at in the fiducial run (see yellow lines in Figure 6). Given that the final momentum from SNe () is proportional to (e.g., Thornton et al., 1998), the high-density environments denote that from SNe that emerge early in Run-woRF (i.e., before they destroy the star-forming clouds) will likely be underestimated by , mitigating the effect of SNe on galactic scales.
3.2.3 Internal metal enrichment
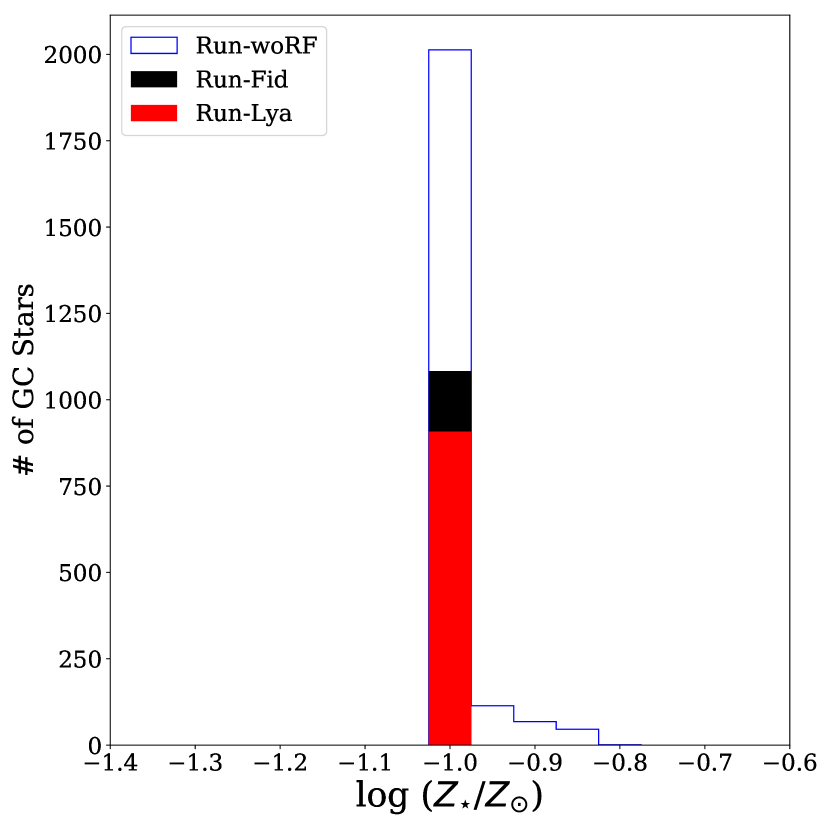
As is well established, young GCs are composed of simple stellar populations with a small internal spread in [Fe/H] (e.g., Hollyhead et al., 2019). In general, the observed metallicity spread in Milky Way GCs is (Carretta et al., 2009; Bailin, 2019). We find that the presence of radiation feedback suppresses the internal metal enrichment due to SNe. In our simulations, Type II SN explosions occur between 3.5 and 40 Myr when stars more massive than evolve off the main sequence, but the formation of the star clusters ends when their age is less than 3 Myr (, Figure 2). Thus, no stellar particle is significantly self-enriched by the explosion of SNe inside the GC candidate. Although some of the stars formed before the collision explode at , only a tiny amount of the ejecta is accreted onto the sink and all of the cluster stars exhibit metallicity close to the initial metallicity (), i.e., (Figure 5).
In contrast, the run without radiation feedback comprises a non-negligible fraction (16%) of the GC stars that are self-enriched (). Owing to the explosions of massive stars and efficient gas consumption, star formation is still quenched quite early () but the metallicity of the cluster stars increases up to . Although this metallicity is not significantly large, care must be taken especially when modeling chemical mixing in multiple populations of GCs using hydrodynamic simulations without radiative transfer.
We note that the presence of radiation feedback does not necessarily indicate zero metallicity spread in GCs. First, any potential variation in the intrinsic metallicity of the colliding GMCs is neglected in this work (e.g., De Cia et al., 2021). If the initial metallicities of the GMCs are different, the cluster formed by their mergers will inevitably have an internal metallicity spread (e.g., McKenzie & Bekki, 2021). Second, the star formation timescale could be longer than the SN timescale, if the GMCs are significantly more massive. For example, in a cosmological RHD simulation of a dark matter halo with mass (Kimm et al., 2016), the stellar metallicities of GC candidates increase up to from zero metallicity. This is because the gas mass in the halo is an order of magnitude larger than the mass of the colliding GMCs and the star formation continues for , allowing the SN ejecta to be recycled for . Finally, as suggested in the literature (e.g., Kim & Lee, 2018), multiple star formation episodes followed by metal enrichment on several hundreds of Myr-to-Gyr timescales may well explain the complex chemical abundance patterns observed in GCs (Bastian & Lardo, 2018; Carretta, 2019). These diverse conditions will be the subject of future studies and our simulations should be regarded as controlled experiments for better understanding the detailed effects of radiation feedback in GC (candidate) formation.
4 Discussion
4.1 Dominant radiation feedback process
Several types of radiation feedback occur in GMCs, such as photoionization heating or direct radiation pressure. To determine their relative importance in the suppression of star formation in GC-forming sites, we compute the maximum extent to which photoionization heating (), direct radiation pressure (), and pressure () balance the ISM pressure in Figure 6. These scales are computed as (Rosdahl & Teyssier, 2015; Kimm et al., 2017)
| (1) | ||||
| (2) | ||||
| (3) |
where is the number of ionizing photons radiated per unit time, is the temperature of the ionized medium, and is the recombination coefficient at (Hui & Gnedin, 1997). The thermal and turbulent pressures are calculated within a sphere of radius 2 pc from the cluster center, as and , respectively, where is the mean molecular weight. The pressure due to gravity is taken as . To evaluate the effect of direct radiation pressure due to UV and optical photons, the luminosity absorbed by hydrogen, helium, and dust () is computed. Additionally, the total Ly luminosity emitted by gas within the same volume is computed from the recombinative and collisional radiation, as described in Kimm et al. (2018). The effect of non-thermal IR pressure is not presented here, as its contribution to the total pressure is negligible in our simulation. This is because the typical optical depth of the IR photons by dust is small () and they simply escape without being trapped in such metal-poor environments.
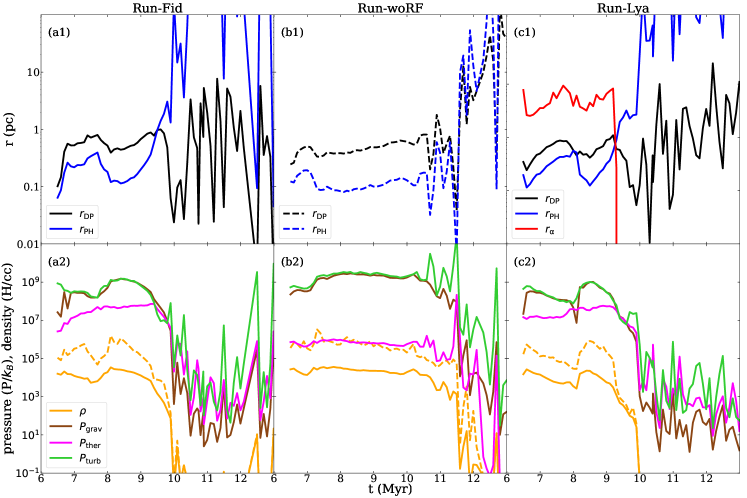
Figure 6 shows that in the fiducial run, direct radiation pressure more effectively controls gas collapse than photoionization heating while forming the potential GC population (). This is also evident in Run-woRF if and are measured, based on the luminosities expected from the stellar population (panel (b1)). In the run with , is even larger than , indicating that pressure is the strongest form of radiation feedback early on. However, plunges at once the cloud is fully ionized and freely escapes the system.
Specifically, in the early stage of cluster formation (), the stellar mass grows and the volume-weighted gas density within the central 2 pc sphere decreases (panels (a2) and (c2) in Figure 6). Subsequently, the pressure due to gravity and turbulence drops, which increases and in the runs with radiation feedback. Note that the turbulent pressure and the pressure due to gravity are similar at (before the dense clumps are disrupted), as the initial virial parameters of the GMCs are set to . Despite the decrease in density, the thermal pressure tends to build up or remain constant because the radiation feedback heats up the gas; however, is still subdominant compared to or . In contrast, in Run-woRF is smaller than that in the other runs by more than an order of magnitude, as the cloud temperature is kept cold (). At , the gas density increases again in Run-Fid and Run-Lya due to the merger with other gas clumps, causing temporary reductions in both and . Once the direct radiation pressure removes the gas from the central region, photoionization takes over and rapidly expands at 222We also confirm that the effect of photoelectric heating is subdominant compared to photoionization heating. This is done by simulating the ionization fronts in a uniform medium with and with and without photoelectric heating.. Then, the gas density in the cluster-forming region reduces to a level similar to the ISM (), and the absorption of optical and UV light becomes insignificant ().
4.2 Compactness of the massive cluster
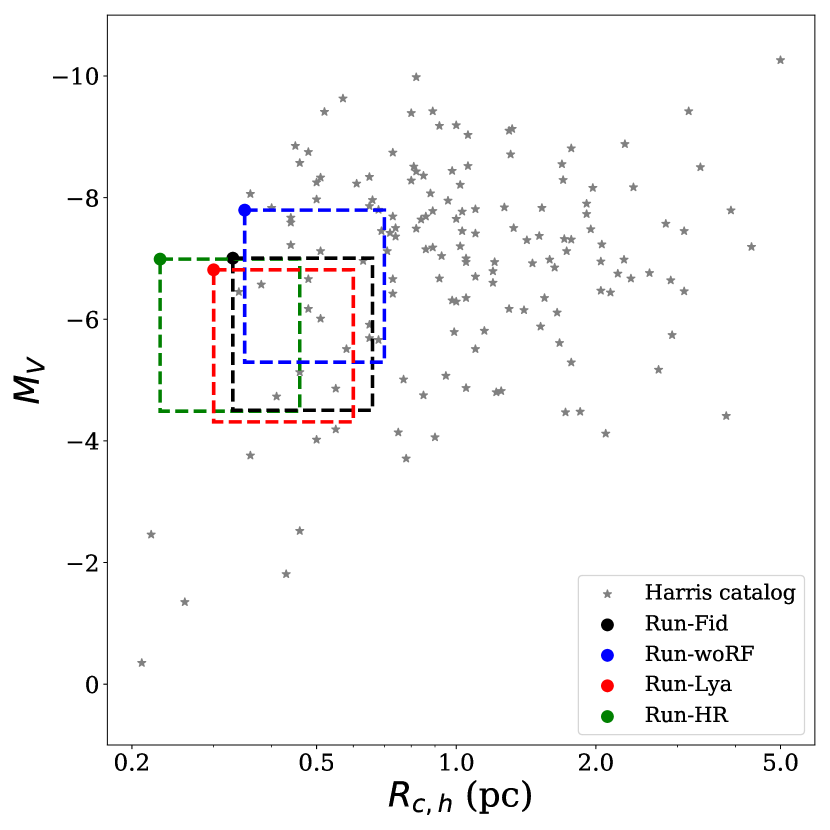
Figures 1 and 3 show that the formed clusters are generally very compact; the half-mass radius of the Run-Fid cluster is with a stellar mass of at the end of the simulation. The final mass of the cluster decreases by 16% in Run-Lya or increases by a factor of in Run-woRF, but their are still comparable to that of the fiducial case. Furthermore, the cluster size is even more compact () in the run with the higher resolution (Run-HR), demonstrating that the size may not yet have converged. This is likely because the turbulent structure of the cluster-forming region is not fully resolved. As noted in previous studies, the Jeans length needs to be resolved using more than 32 cells to capture the turbulent structure in the ISM (e.g., Federrath & Klessen, 2012). However, herein the Jeans length in the cluster forming region is often resolved using only 8 or so cells (). Nevertheless, because the cluster is formed by mergers of gas clumps and stars bearing angular momentum, we believe that the resultant stellar structure will not be arbitrarily compact. Moreover, since the massive star cluster is better resolved in Run-HR than in the fiducial case, the cluster size is unlikely to dramatically change. However, we note that the stellar mass of the cluster might be overestimated, given that an intermediate-mass black hole could form via stellar collisions in dense clusters (e.g., Katz et al., 2015).
Figure 7 compares the compactness of the simulated clusters (filled circles) with that of the present-day Milky Way GCs (gray points). We employ the mass-to-light ratio of , typical of GCs with Gyr (Baumgardt, 2017), to estimate the V-band luminosity of the simulated clusters. We remind the reader that such cloud-cloud collisions may occur at high redshift () during the formation of dwarf galaxies (e.g., Kim et al., 2018b; Sameie et al., 2022). Figure 7 shows that at these luminosities, the simulated clusters are more compact than the Milky Way GCs (). However, Gieles et al. (2010, 2011) argued that the GCs are likely to lose up to of their initial stellar mass due to stellar evolution, tidal disruption, and evaporation due to two-body relaxation, while their size increases by a factor of up to two (see also Larsen et al., 2012; Madrid et al., 2012; Kruijssen, 2015; Rodriguez et al., 2022). If these effects are considered, as shown by dashed boxes in Figure 7, it is possible that the simulated clusters evolve into normal present-day GCs. Although a direct N-body simulation is needed to accurately follow the evolution of the GC candidate and to determine whether the structure can survive from tidal disruption, our results suggest that the cloud–cloud collision may be a viable route for the formation of GC.
4.3 Caveats
We present one of the first studies that attempt to understand the impact of radiation feedback on the formation of massive compact clusters using RHD (see also, Dobbs et al., 2022). However, several caveats should be considered when interpreting our results. First, although a high resolution of up to is employed herein, along with an aggressive refinement scheme to capture turbulent interactions, the size of the simulated clusters does not fully converge. As discussed in the previous section, the adoption of resolution elements that can resolve the Jeans length using more than 32 cells may produce a slightly more compact cluster. Second, our star particle of mass represents a coeval cluster, but this should be modelled in a more realistic way by sampling the individual stellar mass for a given IMF (e.g., Geen et al., 2018). To mimic the uncertainty in the IMF sampling, additional simulations are performed with a larger stellar mass resolution of , but the stellar mass of the potential GC is only changed by and our conclusions on the formation process remain largely unchanged. Third, several physical processes that may be relevant for GC formation are neglected. Grudić et al. (2022a) showed that although they are not responsible for disrupting clouds, protostellar jets can play an important role in regulating massive star formation. Momentum-driven stellar winds may also disperse very dense gas in the vicinity of metal-rich O stars, although they are less effective than photoionization heating in destroying gas clouds with – (e.g., Dale et al., 2013). These imply that the stellar mass in our simulations may be overestimated. In contrast, Sakre et al. (2021) argued that strong magnetic fields delay gas collapse, increasing the number of massive dense cores when the field lines are aligned with the cloud collision axis. Finally, the determination of the stellar mass formed during GMC collisions may be affected by numerical diffusion. As pointed out by Pontzen et al. (2021), numerical diffusion present in Eulerian codes tend to delay gas collapse. This may increase the probability of the formation of a compact cluster due to the suppression of star formation in the moving GMC prior to the collision, although our higher resolution run, where diffusion is reduced somewhat demonstrates that this is not a dominant effect. The inclusion of magnetic fields, which are believed to play such a role (Sakre et al., 2021) might also alleviate this numerical issue.
5 Conclusions
Motivated by recent numerical and observational findings (e.g., Kim et al., 2018b; Tsuge et al., 2021), we simulated the formation of a massive compact cluster via the collision of two GMCs, each weighing , using RHD simulations. In particular, we focused on the impact of radiation feedback on the formation process of GC candidates and found that it can play an important role in determining the star formation histories, stellar masses, and metallicity distributions (see also Dobbs et al., 2022). Our results are summarized as follows.
-
1.
A massive star cluster () is formed when two GMCs collide. Roughly half of the cluster stars are formed in several gas clumps that collapse 1 Myr after the coalescence of the GMCs. The other half is produced in the massive clump that is formed by the merging of the early star-forming clumps and the accretion of neighboring gas (Figure 1–3). In total, of the gas clouds turns into a GC candidate in 2–4 Myr.
-
2.
Radiation feedback efficiently controls the growth of stellar mass in cluster-forming gas clumps. Star formation is completed in in the presence of radiation feedback (Run-Fid), while the cluster-forming site keeps accreting the neighboring gas clumps and forming stars for when the radiation feedback is neglected (Run-woRF). Thus, the cluster mass in Run-woRF is over-estimated by a factor of , compared to that in the fiducial case (Figure 2).
-
3.
Among the various radiation feedback processes considered throughout the formation of the potential GC, the dominant mechanism for the suppression of the gas collapse is the direct radiation pressure, i.e., momentum transfer via the absorption of LyC radiation. However, once the gas density drops to due to outflows driven by direct radiation pressure and gas consumption by star formation, photoionization is more dominant than direct radiation pressure in Run-Fid (Figure 6). The impact of non-thermal radiation pressure due to IR photons is always negligible due to the low dust optical depth.
-
4.
The additional pressure due to the multiple scatterings of photons partially inhibits the gas accretion onto the cluster-forming sites and suppresses the stellar mass by in Run-Lya. The effect of Ly pressure is only noticeable after a sufficient number of stars have formed and it progressively weakens as the star-forming region becomes ionized (Figure 6).
-
5.
The simulated clusters are much more compact than the present-day Milky Way GCs. The half-mass radius of the cluster is at the end of the simulations, which is about three times smaller than the typical size of Milky Way GCs.
-
6.
Radiation feedback suppresses the internal metal enrichment due to SN explosions, which is consistent with the observations of a simple stellar population in the star clusters younger than (Bastian & Lardo, 2018). However, 15% of the cluster stars are self-enriched by SNe in the run without radiation feedback.
Our numerical experiments focused on one way of forming a compact, massive star cluster during a head-on collision between two GMCs. However, any process that triggers rapid gas collapse and star formation warrants investigation, including galaxy mergers (e.g., Whitmore & Schweizer, 1995; Renaud et al., 2015; Kim et al., 2018b; Lee et al., 2021), to fully understand the GC formation process. Although the star cluster mass may be overestimated herein due to the absence of other forms of feedback, such as protostellar jets or stellar winds, the impact of direct radiation pressure and photoionization is likely to be persistent in other GC formation scenarios. As shown in Section 3.2.3, the early feedback affects the local environment into which SNe propagate, and hence the metal enrichment in the star-forming clouds and neighboring medium. This implies that chemical mixing is complex in star-forming sites and warrants further studies on the detailed chemical evolution of GCs (e.g., Tenorio-Tagle et al., 2015; Bastian & Lardo, 2018; Kim & Lee, 2018; Calura et al., 2019).
References
- Abe & Yajima (2018) Abe, M., & Yajima, H. 2018, Monthly Notices of the Royal Astronomical Society: Letters, 475, L130
- Bailin (2019) Bailin, J. 2019, The Astrophysical Journal Supplement Series, 245, 5
- Bastian & Lardo (2018) Bastian, N., & Lardo, C. 2018, Annual review of Astronomy and Astrophysics, 56, 83
- Baumgardt (2017) Baumgardt, H. 2017, Monthly Notices of the Royal Astronomical Society, 464, 2174
- Bleuler & Teyssier (2014) Bleuler, A., & Teyssier, R. 2014, Monthly Notices of the Royal Astronomical Society, 445, 4015
- Bleuler et al. (2015) Bleuler, A., Teyssier, R., Carassou, S., & Martizzi, D. 2015, Computational Astrophysics and Cosmology, 2, 5
- Bolatto et al. (2008) Bolatto, A. D., Leroy, A. K., Rosolowsky, E., Walter, F., & Blitz, L. 2008, The Astrophysical Journal, 686, 948
- Calura et al. (2019) Calura, F., D’Ercole, A., Vesperini, E., Vanzella, E., & Sollima, A. 2019, Monthly Notices of the Royal Astronomical Society, 489, 3269
- Cambrésy et al. (2002) Cambrésy, L., Beichman, C., Jarrett, T., & Cutri, R. 2002, The Astronomical Journal, 123, 2559
- Carretta (2019) Carretta, E. 2019, Astronomy & Astrophysics, 624, A24
- Carretta et al. (2009) Carretta, E., Bragaglia, A., Gratton, R., D’Orazi, V., & Lucatello, S. 2009, Astronomy & Astrophysics, 508, 695
- Chevance et al. (2022) Chevance, M., Kruijssen, J. D., Krumholz, M. R., et al. 2022, Monthly Notices of the Royal Astronomical Society, 509, 272
- Dale et al. (2013) Dale, J., Ngoumou, J., Ercolano, B., & Bonnell, I. 2013, Monthly Notices of the Royal Astronomical Society, 436, 3430
- De Cia et al. (2021) De Cia, A., Jenkins, E. B., Fox, A. J., et al. 2021, Nature, 597, 206
- Dijkstra & Loeb (2008) Dijkstra, M., & Loeb, A. 2008, Monthly Notices of the Royal Astronomical Society, 391, 457
- Dobashi et al. (2019) Dobashi, K., Shimoikura, T., Katakura, S., Nakamura, F., & Shimajiri, Y. 2019, Publications of the Astronomical Society of Japan, 71, S12
- Dobbs et al. (2022) Dobbs, C., Bending, T., Pettitt, A. R., & Bate, M. 2022, Monthly Notices of the Royal Astronomical Society, 509, 954
- Dobbs et al. (2020) Dobbs, C., Liow, K., & Rieder, S. 2020, Monthly Notices of the Royal Astronomical Society: Letters, 496, L1
- Ester et al. (1996) Ester, M., Kriegel, H.-P., Sander, J., & Xu, X. 1996, in Proceedings of the Second International Conference on Knowledge Discovery and Data Mining, KDD’96 (AAAI Press), 226–231. http://dl.acm.org/citation.cfm?id=3001460.3001507
- Federrath & Klessen (2012) Federrath, C., & Klessen, R. S. 2012, The Astrophysical Journal, 761, 156
- Federrath et al. (2010) Federrath, C., Roman-Duval, J., Klessen, R., Schmidt, W., & Mac Low, M.-M. 2010, Astronomy & Astrophysics, 512, A81
- Ferland et al. (1998) Ferland, G., Korista, K., Verner, D., et al. 1998, Publications of the Astronomical Society of the Pacific, 110, 761
- Fukui et al. (2017) Fukui, Y., Tsuge, K., Sano, H., et al. 2017, Publications of the Astronomical Society of Japan, 69, L5
- Geen et al. (2017) Geen, S., Soler, J. D., & Hennebelle, P. 2017, Monthly Notices of the Royal Astronomical Society, 471, 4844
- Geen et al. (2018) Geen, S., Watson, S. K., Rosdahl, J., et al. 2018, Monthly Notices of the Royal Astronomical Society, 481, 2548
- Gieles et al. (2010) Gieles, M., Baumgardt, H., Heggie, D. C., & Lamers, H. J. 2010, Monthly Notices of the Royal Astronomical Society: Letters, 408, L16
- Gieles et al. (2011) Gieles, M., Heggie, D. C., & Zhao, H. 2011, Monthly Notices of the Royal Astronomical Society, 413, 2509
- Grudić et al. (2021) Grudić, M. Y., Diederik Kruijssen, J., Faucher-Giguère, C.-A., et al. 2021, Monthly Notices of the Royal Astronomical Society, 506, 3239
- Grudić et al. (2022a) Grudić, M. Y., Guszejnov, D., Offner, S. S., et al. 2022a, arXiv preprint arXiv:2201.00882
- Grudić et al. (2022b) Grudić, M. Y., Hafen, Z., Rodriguez, C. L., et al. 2022b, arXiv preprint arXiv:2203.05732
- Heitsch et al. (2009) Heitsch, F., Ballesteros-Paredes, J., & Hartmann, L. 2009, The Astrophysical Journal, 704, 1735
- Heyer et al. (2009) Heyer, M., Krawczyk, C., Duval, J., & Jackson, J. M. 2009, The Astrophysical Journal, 699, 1092
- Heyer et al. (2006) Heyer, M. H., Williams, J. P., & Brunt, C. M. 2006, The Astrophysical Journal, 643, 956
- Hollyhead et al. (2019) Hollyhead, K., Martocchia, S., Lardo, C., et al. 2019, Monthly Notices of the Royal Astronomical Society, 484, 4718
- Howard et al. (2019) Howard, C. S., Pudritz, R. E., Sills, A., & Harris, W. E. 2019, Monthly Notices of the Royal Astronomical Society, 486, 1146
- Hui & Gnedin (1997) Hui, L., & Gnedin, N. Y. 1997, Monthly Notices of the Royal Astronomical Society, 292, 27
- Hunter et al. (2021) Hunter, G. H., Clark, P. C., Glover, S. C., & Klessen, R. S. 2021, arXiv preprint arXiv:2109.06195
- Katz et al. (2017) Katz, H., Kimm, T., Sijacki, D., & Haehnelt, M. G. 2017, Monthly Notices of the Royal Astronomical Society, 468, 4831
- Katz et al. (2015) Katz, H., Sijacki, D., & Haehnelt, M. G. 2015, Monthly Notices of the Royal Astronomical Society, 451, 2352
- Kim et al. (2018a) Kim, J.-G., Kim, W.-T., & Ostriker, E. C. 2018a, The Astrophysical Journal, 859, 68
- Kim et al. (2018b) Kim, J.-h., Ma, X., Grudić, M. Y., et al. 2018b, Monthly Notices of the Royal Astronomical Society, 474, 4232
- Kim & Lee (2018) Kim, J. J., & Lee, Y.-W. 2018, The Astrophysical Journal, 869, 35
- Kimm et al. (2022) Kimm, T., Bieri, R., Geen, S., et al. 2022, The Astrophysical Journal Supplement Series, 259, 21
- Kimm et al. (2019) Kimm, T., Blaizot, J., Garel, T., et al. 2019, Monthly Notices of the Royal Astronomical Society, 486, 2215
- Kimm et al. (2015) Kimm, T., Cen, R., Devriendt, J., Dubois, Y., & Slyz, A. 2015, Monthly Notices of the Royal Astronomical Society, 451, 2900
- Kimm et al. (2016) Kimm, T., Cen, R., Rosdahl, J., & Yi, S. K. 2016, ApJ, 823, 52
- Kimm et al. (2018) Kimm, T., Haehnelt, M., Blaizot, J., et al. 2018, Monthly Notices of the Royal Astronomical Society, 475, 4617
- Kimm et al. (2017) Kimm, T., Katz, H., Haehnelt, M., et al. 2017, Monthly Notices of the Royal Astronomical Society, 466, 4826
- Kravtsov & Gnedin (2005) Kravtsov, A. V., & Gnedin, O. Y. 2005, The Astrophysical Journal, 623, 650
- Kruijssen (2015) Kruijssen, J. D. 2015, Monthly Notices of the Royal Astronomical Society, 454, 1658
- Krumholz et al. (2007) Krumholz, M. R., Klein, R. I., & McKee, C. F. 2007, The Astrophysical Journal, 656, 959
- Krumholz et al. (2006) Krumholz, M. R., Matzner, C. D., & McKee, C. F. 2006, The Astrophysical Journal, 653, 361
- Krumholz et al. (2009) Krumholz, M. R., McKee, C. F., & Tumlinson, J. 2009, The Astrophysical Journal, 699, 850
- Krumholz & Tan (2007) Krumholz, M. R., & Tan, J. C. 2007, The Astrophysical Journal, 654, 304
- Lahén et al. (2019) Lahén, N., Naab, T., Johansson, P. H., et al. 2019, ApJ, 879, L18
- Larsen et al. (2012) Larsen, S., Strader, J., & Brodie, J. 2012, Astronomy & Astrophysics, 544, L14
- Lee et al. (2021) Lee, J., Shin, E.-j., & Kim, J.-h. 2021, The Astrophysical Journal Letters, 917, L15
- Madrid et al. (2012) Madrid, J. P., Hurley, J. R., & Sippel, A. C. 2012, The Astrophysical Journal, 756, 167
- McKenzie & Bekki (2021) McKenzie, M., & Bekki, K. 2021, Monthly Notices of the Royal Astronomical Society, 507, 834
- Oka et al. (2001) Oka, T., Hasegawa, T., Sato, F., et al. 2001, The Astrophysical Journal, 562, 348
- Peebles (1984) Peebles, P. J. E. 1984, The Astrophysical Journal, 277, 470
- Pfeffer et al. (2018) Pfeffer, J., Kruijssen, J. D., Crain, R. A., & Bastian, N. 2018, Monthly Notices of the Royal Astronomical Society, 475, 4309
- Pontzen et al. (2021) Pontzen, A., Rey, M. P., Cadiou, C., et al. 2021, Monthly Notices of the Royal Astronomical Society, 501, 1755
- Price & Federrath (2010) Price, D. J., & Federrath, C. 2010, Monthly Notices of the Royal Astronomical Society, 406, 1659
- Renaud et al. (2017) Renaud, F., Agertz, O., & Gieles, M. 2017, Monthly Notices of the Royal Astronomical Society, 465, 3622
- Renaud et al. (2015) Renaud, F., Bournaud, F., & Duc, P.-A. 2015, MNRAS, 446, 2038
- Robertson et al. (2010) Robertson, B. E., Kravtsov, A. V., Gnedin, N. Y., Abel, T., & Rudd, D. H. 2010, Monthly Notices of the Royal Astronomical Society, 401, 2463
- Rodriguez et al. (2022) Rodriguez, C. L., Hafen, Z., Grudić, M. Y., et al. 2022, arXiv preprint arXiv:2203.16547
- Roman-Duval et al. (2010) Roman-Duval, J., Jackson, J. M., Heyer, M., Rathborne, J., & Simon, R. 2010, The Astrophysical Journal, 723, 492
- Rosdahl et al. (2013) Rosdahl, J., Blaizot, J., Aubert, D., Stranex, T., & Teyssier, R. 2013, Monthly Notices of the Royal Astronomical Society, 436, 2188
- Rosdahl & Teyssier (2015) Rosdahl, J., & Teyssier, R. 2015, Monthly Notices of the Royal Astronomical Society, 449, 4380
- Rosen & Bregman (1995) Rosen, A., & Bregman, J. N. 1995, The Astrophysical Journal, 440, 634
- Sakre et al. (2021) Sakre, N., Habe, A., Pettitt, A. R., & Okamoto, T. 2021, Publications of the astronomical society of Japan, 73, S385
- Sameie et al. (2022) Sameie, O., Boylan-Kolchin, M., Hopkins, P. F., et al. 2022, arXiv preprint arXiv:2204.00638
- Sanders et al. (2016) Sanders, R. L., Shapley, A. E., Kriek, M., et al. 2016, The Astrophysical Journal, 816, 23
- Schreiber et al. (2019) Schreiber, N. F., Übler, H., Davies, R. L., et al. 2019, The Astrophysical Journal, 875, 21
- Smith et al. (2017) Smith, A., Bromm, V., & Loeb, A. 2017, Monthly Notices of the Royal Astronomical Society, 464, 2963
- Stanway et al. (2016) Stanway, E. R., Eldridge, J., & Becker, G. D. 2016, Monthly Notices of the Royal Astronomical Society, 456, 485
- Takahira et al. (2018) Takahira, K., Shima, K., Habe, A., & Tasker, E. J. 2018, PASJ, 70, S58
- Tanvir & Dale (2020) Tanvir, T. S., & Dale, J. E. 2020, Monthly Notices of the Royal Astronomical Society, 494, 246
- Tenorio-Tagle et al. (2015) Tenorio-Tagle, G., Munoz-Tunon, C., Silich, S., & Cassisi, S. 2015, The Astrophysical Journal Letters, 814, L8
- Teyssier (2002) Teyssier, R. 2002, Astronomy & Astrophysics, 385, 337
- Thornton et al. (1998) Thornton, K., Gaudlitz, M., Janka, H.-T., & Steinmetz, M. 1998, The Astrophysical Journal, 500, 95
- Tomaselli & Ferrara (2021) Tomaselli, G. M., & Ferrara, A. 2021, Monthly Notices of the Royal Astronomical Society, 504, 89
- Toro et al. (1994) Toro, E. F., Spruce, M., & Speares, W. 1994, Shock waves, 4, 25
- Trenti et al. (2015) Trenti, M., Padoan, P., & Jimenez, R. 2015, ApJ, 808, L35
- Tsuge et al. (2021) Tsuge, K., Tachihara, K., Fukui, Y., et al. 2021, Publications of the Astronomical Society of Japan, 73, 417
- Utomo et al. (2018) Utomo, D., Sun, J., Leroy, A. K., et al. 2018, The Astrophysical Journal Letters, 861, L18
- Whitmore & Schweizer (1995) Whitmore, B. C., & Schweizer, F. 1995, The Astronomical Journal, 109, 960
- Yoo et al. (2020) Yoo, T., Kimm, T., & Rosdahl, J. 2020, Monthly Notices of the Royal Astronomical Society, 499, 5175