Crystal and magnetic structures of Ni2In compounds ( = Tb and Ho)
Abstract
Crystal and magnetic structures of Ni2In ( = Tb and Ho) have been studied by powder neutron diffraction at low temperatures. The compounds crystallize in an orthorhombic crystal structure of the Mn2AlB2-type. At low temperatures, the magnetic moments localized solely on the rare earth atoms form antiferromagnetic structures. The Tb magnetic moments, equal to 8.65(6) and parallel to the -axis, form a collinear magnetic structure described by the propagation vector . This magnetic structure is stable up to the Néel temperature equal to 40 K. For Ho2Ni2In a complex, temperature-dependent magnetic structure is detected. In the temperature range 3.5-8.6 K, an incommensurate magnetic structure, described by the propagation vector is observed, while in the temperature interval 2.2-3.1 K the magnetic order is described by two propagation vectors, namely, and its third harmonics . Below 2 K, a coexistence of all magnetic structures detected at higher temperatures is observed. For all magnetic phases, the Ho magnetic moments are parallel to the -axis. The low temperature heat capacity data confirm a first order transition near 3 K.
I Introduction
There is a strong interest in the development of novel magnetically ordered materials with unconventional properties. The Ni2In compounds crystallize in the orthorhombic crystal structure (space group ) [1]. Magnetic and specific heat measurements indicate that the Ni2In ( = Gd-Tm) compounds are antiferromagnets with the Néel temperatures between 5 K ( = Tm) and 40 K ( = Tb) [2]. In all compounds, except = Ho, the magnetic order is stable in a broad temperature range between 1.9 K and a corresponding Néel temperature. For Ho2Ni2In, below the Néel temperature of 9 K, an additional phase transition at equal 3.5 K (dc magnetic data) or 3.3 K (ac magnetic data and heat capacity data) is observed. The more recent paper reports K and K [3]. The antiferromagnetic order is confirmed by the neutron diffraction data for = Tb [4] as well as Er and Tm [5]. The magnetic structure is described by the propagation vectors for = Tb and for Er and Tm. The magnetic moments are found to be localized solely on the rare earth atoms. They form collinear magnetic structure and are parallel to the -axis for Tb and -axis for Er and Tm.
In order to deeper understand magnetic properties of Ni2In ( - rare earth element), we have performed new neutron diffraction measurements for Ni2In ( = Tb, Ho). Although, the magnetic structure of Tb2Ni2In has already been reported [4], the previous data have been collected for the sample containing only 10 wt % of Tb2Ni2In. In the current work we report the results obtained for a new sample consisting of Tb2Ni2In in its most part. In addition, we report for the first time the magnetic structure in Ho2Ni2In. The neutron diffraction data for Ho2Ni2In are supported by heat capacity measurements.
II Experimental details
The samples of Ni2In ( = Tb and Ho) have been prepared by arc melting of , Ni and In (all with purity at least 99.9 wt %) taken in the atomic ratio of 2:2:1. The melting has been performed under a Ti-gettered Ar atmosphere. The obtained ingots have been turned over and remelted four times in order to get homogeneous distribution of components. The samples have been homogenized in an evacuated quartz-tube at 873 K for one month, followed by cold water quenching.
The samples’ quality has been checked by X-ray powder diffraction at room temperature (PANalytical X’Pert diffractometer with CuK radiation).
Neutron diffraction patterns have been collected in the temperature range from 1.55 up to 60 K on the E6 diffractometer at the Helmholtz-Zentrum Berlin für Materialien in Energie GmbH. The incident neutron wavelength was 2.4315 Å. For Rietveld analysis of the X-ray and neutron diffraction patterns the computer program FullProf has been utilized [6], while for symmetry analysis the computer program BasIreps, which is distributed together with FullProf, has been used.
Heat capacity study have been carried out by a two-tau relaxation method in the temperature range 1.8-12 K using HC option of the Quantum Design PPMS platform.
III Results
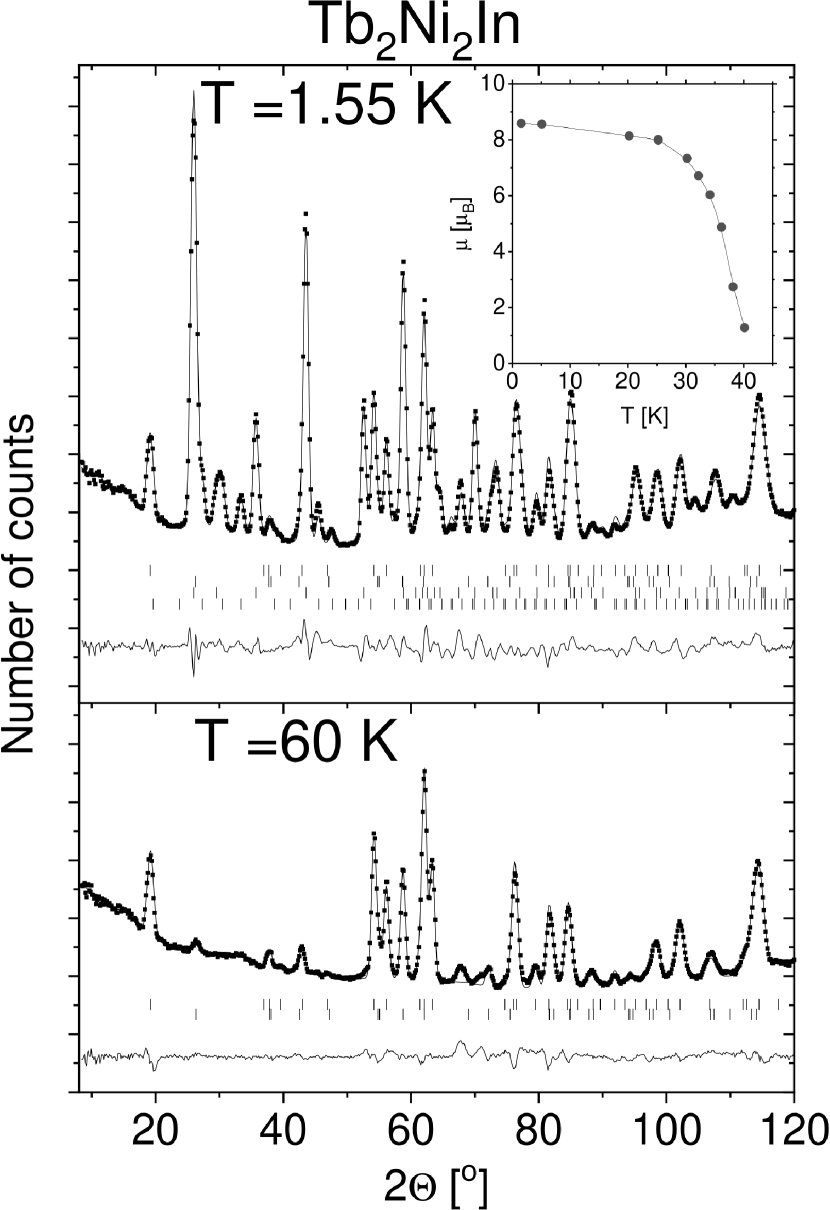
Analysis of the X-ray diffraction and neutron patterns indicate 82 wt % of Tb2Ni2In and 18 wt % of Tb2Ni1.78In for the Tb-based sample and 95.4(3) wt % of Ho2Ni2In and 4.6(3) wt % of HoNi2 for the Ho-based sample (see Figures 1a and 2a).
| [K] | 60 | 1.55 |
|---|---|---|
| [Å] | 3.913(1) | 3.910(1) |
| [Å] | 14.135(2) | 14.125(3) |
| [Å] | 3.691(1) | 3.692(1) |
| [Å3] | 204.15(14) | 203.90(16) |
| 0.3647(2) | 0.3632(3) | |
| 0.1984(3) | 0.1986(3) | |
| [%] | 6.2 | 6.6 |
| [%] | 5.0 | 5.8 |
| [K] | 20.2 | 3.7 | 2.5 | 1.5 |
|---|---|---|---|---|
| [Å] | 3.9178(5) | 3.9119(9) | 3.9117(8) | 3.9122(9) |
| [Å] | 14.202(2) | 14.184(3) | 14.184(3) | 14.184(3) |
| [Å] | 3.6715(4) | 3.6648(8) | 3.6660(7) | 3.6652(8) |
| [Å3] | 204.29(2) | 203.34(8) | 203.40(7) | 203.38(7) |
| 0.3639(4) | 0.3636(6) | 0.3639(6) | 0.3644(6) | |
| 0.1981(4) | 0.1972(8) | 0.1969(8) | 0.1975(7) | |
| [%] | 3.4 | 5.1 | 4.9 | 5.3 |
| [%] | 2.8 | 3.6 | 3.0 | 3.2 |
| distance [Å] | 20.2 K | 3.7 K | 2.5 K | 1.5 K |
|---|---|---|---|---|
| Ho1-Ni2 | 2.825(3) | 2.815(5) | 2.816(5) | 2.821(4) |
| Ho1-Ni1 | 2.986(6) | 2.99(2) | 3.00(1) | 2.99(1) |
| Ho1-In1 | 3.308(3) | 3.306(5) | 3.303(5) | 3.299(5) |
| Ho1-Ho1 | 3.6715(4) | 3.6648(8) | 3.6660(7) | 3.6652(8) |
| Ho1-Ho4 | 3.782(7) | 3.77(1) | 3.78(1) | 3.79(1) |
| Ho1-Ho2 | 3.866(8) | 3.87(2) | 3.86(1) | 3.85(2) |
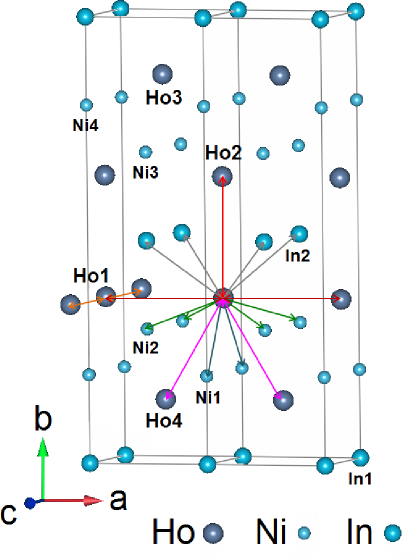
The 2:2:1 compounds crystalize in the orthorhombic crystal structure of the Mn2AlB2-type (space group ). The atoms occupy the following Wyckoff sites: at , Ni at and In at . The crystal structure of Ho2Ni2In is shown in Figure 3 together with distances between the Ho1 atom and its nearest neighbours. The refined crystal structure parameters at different temperatures are listed in Table 1 for Tb2Ni2In and Table 2 for Ho2Ni2In, respectively. The data confirm that the crystal structure is stable down to low temperatures. The shortest interatomic distances between the Ho1 atom and its nearest neighbours in Ho2Ni2In are listed in Table 3.
Four magnetic atoms in the sublattice with the local symmetry are denoted as: , , , . The and atom positions are related to the and ones, respectively, by the centering translation .
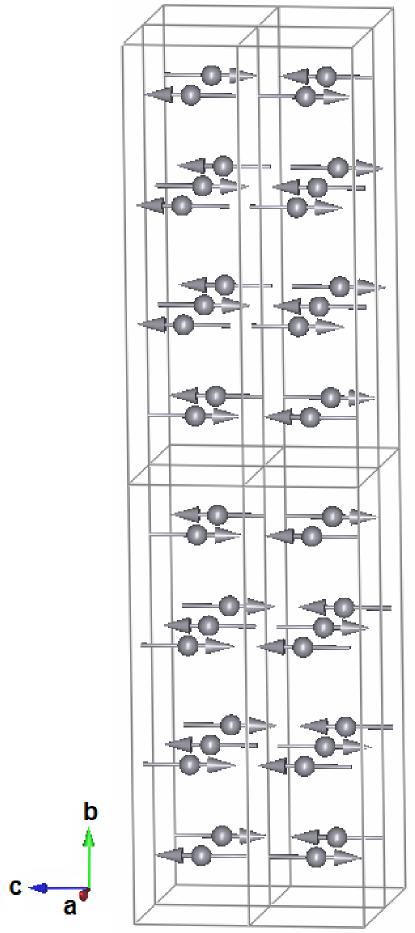
The neutron diffraction pattern of Tb2Ni2In, collected at 1.55 K (see Figure 1b), contains additional Bragg reflections originating from the magnetic order. These reflections can be indexed with the use of the propagation vector . The same propagation vector describes magnetic order in the isostructural Er2Ni2Pb compound [7]. Symmetry analysis provides four magnetic structure models related to – for details see Table II in [7]. In case of Tb2Ni2In, the best agreement with the experimental data ( = 5.0%) is obtained for the model with Tb magnetic moments equal to 8.65(6) and parallel to the -axis. The moments follow the sign sequence for the Tb1, Tb2, Tb3 and Tb4 atoms in the crystallographic unit cell, respectively. The corresponding magnetic unit cell is shown in Figure 4. Temperature dependence of the Tb magnetic moment (see the insert in Figure 1) provides the Néel temperature equal to 40 K, which is in a good agreement with the results of macroscopic magnetic measurements [2].
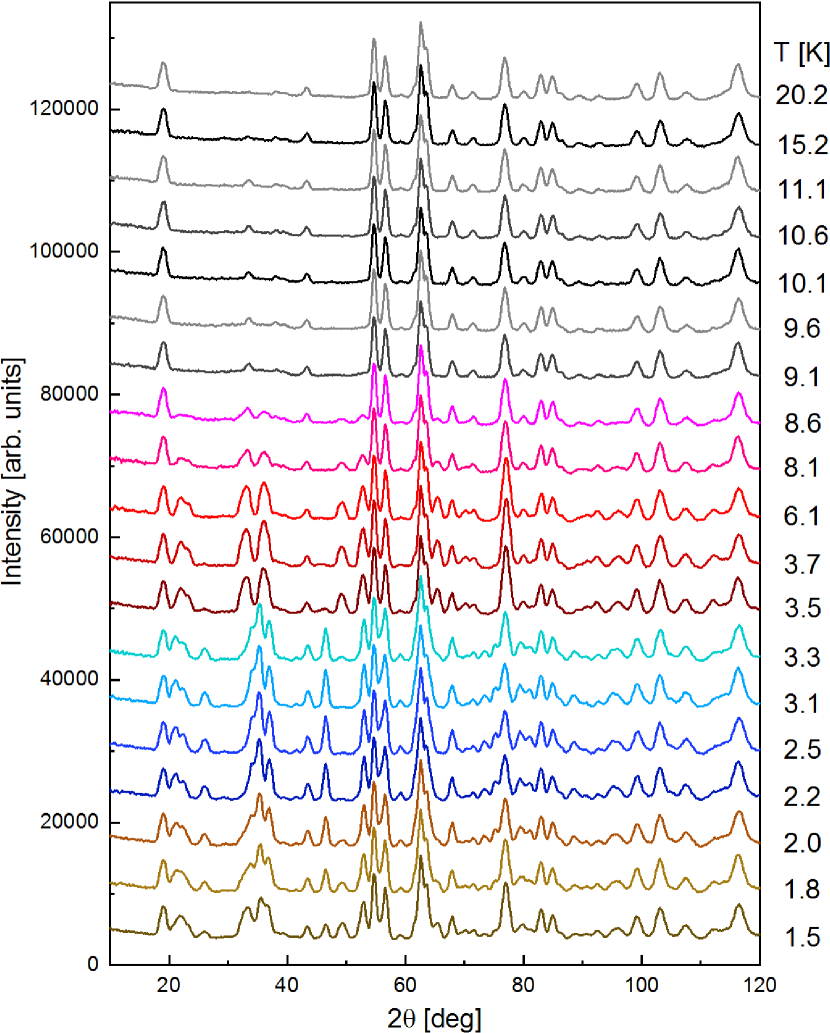
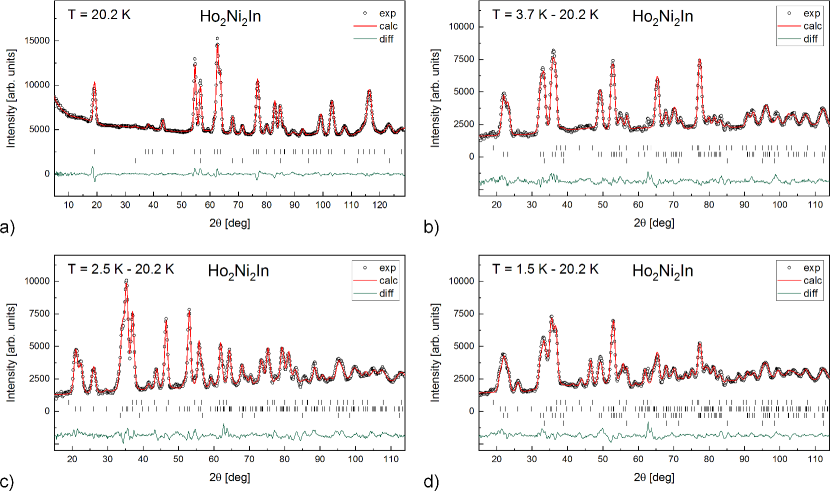
Neutron diffraction patterns of Ho2Ni2In, collected in the 1.5-20.2 K range, are presented in Figure 5. Ho2Ni2In remains paramagnetic down to 9.1 K. The Bragg reflections of magnetic origin appear in the pattern collected at 8.6 K. With decreasing temperature the Ho2Ni2In magnetic structure undergoes two transitions visible as distinct changes in the diffraction pattern at ca. 3.5 K and ca. 2.0 K, respectively. In order to extract pure magnetic contribution, the paramagnetic pattern taken at K has been subtracted from the patterns recorded at lower temperatures – representative examples are shown in Figures 2b-d. Propagation vectors describing magnetic structure have been determined using the k-search computer program, while for symmetry analysis of magnetic structures the BasIreps program has been utilized. Both programs are parts of the FullProf package [6]. The ferromagnetic contribution arising from the HoNi2 impurity phase has been included in all refinements performed for data collected below 13.5 K [8]. It has been assumed that all magnetic moments in HoNi2 are of the same magnitude and point at the [111] direction.
| IR1 | IR2 | ||||||||||
| BV1 | BV2 | BV3 | BV1 | BV2 | BV3 | ||||||
| Ho1 | |||||||||||
| 1 0 0 | 0 1 0 | 0 0 1 | 1 0 0 | 0 1 0 | 0 0 1 | ||||||
| Ho2 | |||||||||||
| 1 0 0 | 0 1 0 | 0 0 1 | 1 0 0 | 0 1 0 | 0 0 1 | ||||||
| Ho2Ni2In | |||||||||||
| [K] | [] | [] | [] | [] | [] | [] | [] | [%] | |||
| 3.7 | Ho1 | 10.28(9) | 10.28(9) | 0.7580(3) | 0.5198(3) | 5.3 | |||||
| Ho2 | 10.28(9) | 10.28(9) | |||||||||
| 1.5 | Ho1 | 8.2(2) | 8.2(2) | 0.7568(5) | 0.5191(5) | 5.4 | |||||
| Ho2 | 8.2(2) | 8.2(2) |
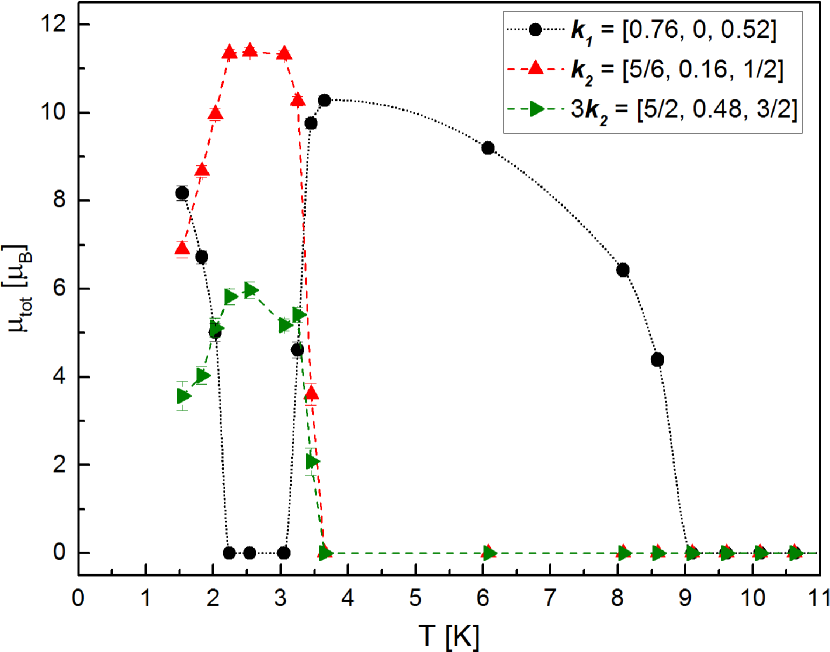
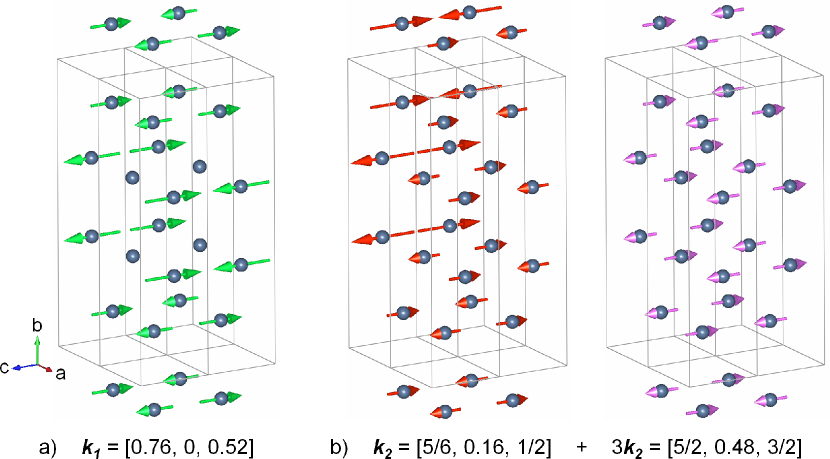
The Bragg reflections of magnetic origin, observed in the 3.5-8.6 K temperature range, can be indexed with an incommensurate propagation vector . Symmetry analysis for and the Wyckoff site provides two irreducible representations: IR1 and IR2. Both representations allow for non-zero contribution to the total magnetic moments along , , directions (Table 4). All Ho atoms belong to one orbit, therefore they are constrained by symmetry and modulation of their magnetic moments has identical amplitude. The IR1 representation assumes parallel ordering of the -axis components of magnetic structure and antiparallel ordering of the - and -axis components for the Ho1 and Ho2 atoms belonging to the same crystal unit cell. For IR2, the -axis components are antiparallel, while the - and -axis ones are parallel. The results of Rietveld refinement favor the magnetic structure model related to the IR2 representation with magnetic moments oriented only along the -axis. A representative difference pattern ( K - 20.2 K) is presented in Figure 2b, while the corresponding magnetic structure is shown in Figure 6a. The resultant magnetic structure is antiferromagnetic. The modulation amplitude increases initially with decreasing temperature reaching 10.3(1) at = 3.7 K (see Figure 7). At the same temperature, new unindexed reflections of low intensity become visible, indicating beginning of magnetic phase transition. At = 3.5 K and 3.3 K, a co-existence of two different magnetic phases is observed. The modulation amplitude related to the propagation vector decreases to 9.8(2) and 4.6(2) at 3.5 K and 3.3 K, respectively, and finally drops to zero at = 3.1 K.
| IR1 | IR2 | ||||||
| BV1 | BV2 | BV1 | |||||
| 4j | Ho1 | 1 0 0 | 0 1 0 | 0 0 1 | |||
| Ho2 | 1 0 0 | 0 1 0 | 0 0 1 | ||||
| [K] | Ho2Ni2In | [] | [] | [] | [] | [%] | |
| 2.5 | Ho1 | 11.41(9), 6.0(2) | 11.41(9), 6.0(2) | 0.1615 | 4.9 | ||
| Ho2 | 11.41(9), 6.0(2) | 11.41(9), 6.0(2) | |||||
| 1.5 | Ho1 | 6.9(2), 3.5(3) | 6.9(2), 3.5(3) | 0.159(2) | 5.9 | ||
| Ho2 | 6.9(2), 3.5(3) | 6.9(2), 3.5(3) | |||||
Indexing of Bragg reflections of magnetic origin, observed between 2.2 and 3.1 K (see Figure 2c), requires two propagation vectors, namely, and its third harmonics, , indicating that the resultant modulation of magnetic moments differs from purely sinusoidal one, observed at higher temperatures. Symmetry analysis provides identical irreducible representations (IR1 and IR2) for both and . IR1 describes magnetic ordering within the -plane, while IR2 the one along the -axis (see Table 5). The Ho atoms are divided into two orbits – the first one containing the Ho1, Ho3 pair and the second one containing the Ho2, Ho4 pair. The agreement with experimental pattern is obtained for the IR2 representation (the Ho magnetic moments are parallel to the -axis). The components of magnetic structure described by the propagation vector and its third harmonics are visualized in Figure 6b for K. Although the splitting into two orbits allows for different modulation amplitudes and a phase shift between orbits, the Rietveld refinement implies identical modulation amplitudes and zero phase shift between the (Ho1, Ho3) and (Ho2, Ho4) atom pairs. The amplitude of modulation related to the propagation vector equals 11.3-11.4 in the 2.2-3.1 K range, while the component related to is about two times smaller and equal to 5.2-6.0 (see Figure 7). This relationship between components continues also below 2.2 K, where another magnetic phase transition occurs. It is worth noting that the magnetic structure related to and resembles the high-temperature magnetic structure related to as both magnetic structures are antiferromagnetic and the magnetic moments are oriented along the -axis.
At the lowest studied temperatures, a re-appearance of Bragg reflections of magnetic origin, indexed by the propagation vector is observed – notice the presence of magnetic Bragg reflection at = 49.3∘ in Figures 2b-d as well as follow thermal evolution of the Ho2Ni2In neutron diffraction pattern shown in Figure 5. A clear co-existence of the magnetic phase described by and that related to the , pair is visible below 2.0 K. The modulation amplitude of magnetic moments related to the propagation vector increases with decreasing temperature reaching finally 8.2(2) at K. It exceeds the contributions related to the and propagation vectors, which decrease at K to 6.9(2) and 3.6(4) , respectively.
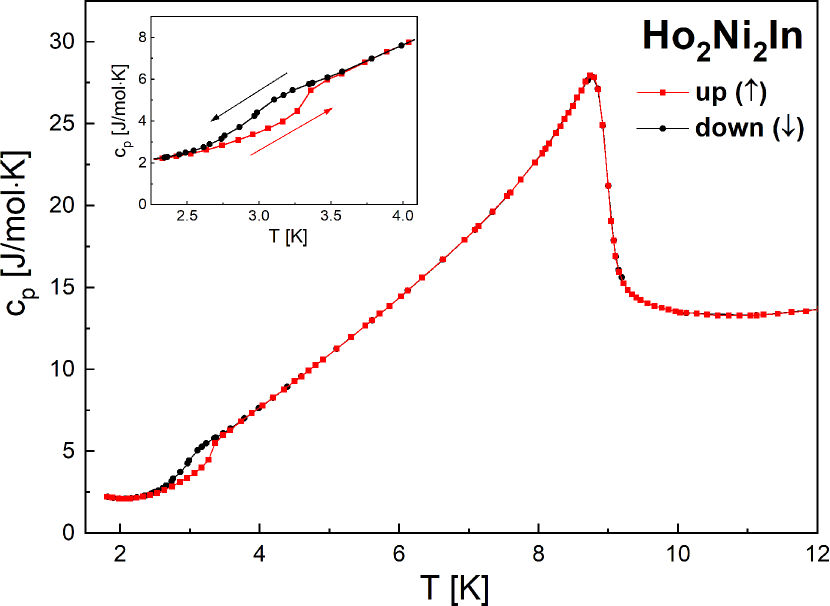
In order to get more information about the nature of low-temperature magnetic phase transitions, additional heat capacity measurements have been performed in the temperature range 1.8-12 K with both increasing and decreasing temperature (see Figure 8). A lambda-shaped maximum at 9.0 K is typical of the second-order transition from antiferro- to paramagnetic state, while a distinct thermal hysteresis visible in the temperature range 2.5-3.5 K (see the insert in Figure 8) is characteristic of the first-order transition and coincides with the transition temperature between the magnetic phase described by the propagation vector and that related to the and vector pair.
IV Discussion
Analysis of the X-ray diffraction pattern as well as nuclear contribution to the neutron diffraction pattern in function of temperature indicates that the orthorhombic crystal structure is stable in a broad temperature range including the magnetically ordered state (see Tables 1 and 2). The crystal structure is highly anisotropic with the lattice constant more than three times larger than the and ones (see Figure 3). The structure consists of the -planes of various kinds stacked along the -axis direction, namely, the atoms planes are intercalated between the Ni- and In-planes following the sequence: In-R-Ni-Ni-R-In-R-Ni-Ni-R-In. The shortest distances between the Ho atoms within the -plane and those located at different planes differ (see Table 3) – the lowest are found along the -axis which is the direction of magnetic moment in the ordered state.
The results reported in this work indicate different kinds of collinear antiferromagnetic orderings present in the investigated compounds, namely, a commensurate one in Tb2Ni2In and an incommensurate one in Ho2Ni2In. In Tb2Ni2In, the low-temperature magnetic structure is described by the propagation vector , leading to a magnetic unit cell that has the lattice parameters doubled with respect to the crystallographic cell along all three principal crystallographic directions (see Figure 4). In Ho2Ni2In, a sequence of incommensurate modulated magnetic structures appears with decreasing temperature. Below 9 K a magnetic structure related to is observed, while in the temperature range 2.2 and 3.1 K two propagation vectors ( and ) are required to describe the magnetic structure. Finally, below 2 K a coexistence of both above mentioned magnetic structures is detected.
Temperature-induced transformations of magnetic structures have been found in a number of intermetallic compounds (see Table 1 in [9]). Such transformations of the magnetic structure can be understood on the basis of a realistic mean-field model, which takes into account both periodic-change-field and crystal electric field effects [9]. A sequence of magnetic structures similar to those reported in this work for Ho2Ni2In has been previously observed for UNi2Si2 [10]. With decreasing temperature, an incommensurate modulated magnetic structure () transforms into an intermediate simple antiferromagnetic one, and finally again to a modulated one () with a ferromagnetic component. Such an evolution of magnetic structure has been interpreted on the basis of the Heisenberg model with biquadratic exchange [11].
The magnetic moments in Tb2Ni2In and Ho2Ni2In are parallel to the -axis, while they are parallel to the -axis in Ni2In ( = Er and Tm) [5]. Such a change of orientation of the magnetic moment with increasing number of the electrons can be attributed to change of sign of the Stevens operator which is negative for Tb and Ho and positive for Er and Tm [12].
In both compound the - interatomic distances are about 3.7 Å and therefore they are larger than the sum of respective ionic radii. Such a result suggest presence of indirect exchange interactions of the RKKY-type. The RKKY model predicts proportionality between the Néel temperature and the de Gennes factor defined as , where is a Landé splitting factor and is a total angular momentum of the corresponding magnetic ion [13]. Figure 11 in [2] shows a comparison between the experimentally determined Néel temperatures for Ni2In ( = Gd–Tm) and those calculated according the RKKY theory. A large discrepancy between the experimental and calculated temperatures for Tb2Ni2In indicates a strong influence of the crystalline electric field (CEF) on magnetic state formation [14]. Therefore the magnetic structures in Ni2In ( - rare earth element) result from competition between the RKKY- and CEF-type interactions. Such a competition may lead to complex magnetic properties including temperature-induced magnetic order-order transitions [15]. It is worth noting that such transitions have been observed also in the isostructural Ni2Pb ( = Ho, Er) compounds [16, 7]. In Ho2Ni2Pb, a sine-modulated commensurate magnetic order described by the magnetic unit cell develops below K. The magnetic structure turns into square-modulated one below K. In Er2Ni2Pb, an incommensurate modulated magnetic structure () has been detected below K. With decreasing temperature, two intermediate incommensurate magnetic phases, related to the and propagation vectors, respectively, appears. A commensurate magnetic structure, involving two propagation vectors ( and ), is found as magnetic ground state.
V Summary and conclusions
The results presented in this work confirm that the crystal structure of ternary Ni2In ( = Tb and Ho) is orthorhombic of the Mn2AlB2-type (space group ) in both paramagnetic and magnetically ordered states. At low temperatures the rare earth magnetic moments are found to order antiferromagnetically with the rare earth magnetic moments being parallel to the -axis. In Tb2Ni2In, a commensurate () collinear antiferromagnetic structure with is formed below K. In Ho2Ni2In, a sequence of order-order magnetic transitions is observed. An incommensurate antiferromagnetic sine-modulated structure, related to , is detected below K. The structure turns around 3 K into another incommensurate one, which is described by two different propagation vectors, namely, and . Below 2 K the structure related to reappears and a coexistence of both above mentioned magnetic structures is observed. Heat capacity data reveal that the transition at 3 K is of the first-order type.
Acknowledgements
Kind hospitality and financial support extended to two of us (S. B. and A. S.) by the Helmholtz-Zentrum Berlin für Materialien und Energie (HZB) is gratefully acknowledged.
References
- Zaremba et al. [1988] V. I. Zaremba, V. A. Bruskov, P. Yu. Zavalii, Ya. M. Kalychak, Crystal structure of Ni2In compounds ( = Y, Sm, Gd, Tb, Ho, Er, Tm, Lu), Izv. Akad. Nauk SSSR, Neorg. Mater. 24 (1988) 409–411 (Engl. transl.: Inorg. Mater. 24 (1988) 330–332).
- Szytuła et al. [2015] A. Szytuła, S. Baran, J. Przewoźnik, Yu. Tyvanchuk, Ya. Kalychak, Magnetic properties and specific heat of Ni2In ( = Gd–Tm) compounds, J. Magn. Magn. Mater. 387 (2015) 83–89. 10.1016/j.jmmm.2015.03.084.
- Zhang et al. [2019] Z. Zhang, P. Wang, H. Rong, L. Li, Structural and cryogenic magnetic properties of Ni2In ( = Pr, Nd, Dy and Ho) compounds, Dalton Trans. 48 (2019) 17792–17799. 10.1039/c9dt03245b.
- Szytuła et al. [2013] A. Szytuła, S. Baran, A. Hoser, Ya. M. Kalychak, B. Penc, Yu. Tyvanchuk, Neutron diffraction studies of Tb2Ni2-xIn intermetallic compounds, Acta Phys. Pol. A 124 (2013) 994–997. 10.12693/APhysPolA.124.994.
- Baran et al. [2017] S. Baran, A. Szytuła, A. Hoser, Collinear antiferromagnetic structure in Ni2In ( = Er, Tm), J. Alloys Compd. 696 (2017) 1278–1281. 10.1016/j.jallcom.2016.12.072.
- Rodríguez-Carvajal [2001] J. Rodríguez-Carvajal, Recent developments of the program fullprof, Newsletter of the Commission for Powder Diffraction of the IUCr 26 (2001) 12–19.
- Prokes̆ et al. [2008] K. Prokes̆, E. Muñoz-Sandoval, A. D. Chinchure, J. A. Mydosh, Competing magnetic structures and magnetic transitions in Er2Ni2Pb: Powder neutron diffraction measurements, Phys. Rev. B 78 (2008) 014425. 10.1103/PhysRevB.78.014425.
- Ćwik et al. [2018] J. Ćwik, Y. Koshkid’ko, K. Nenkov, E. A. Tereshina, K. Rogacki, Structural, magnetic and magnetocaloric properties of HoNi2 and ErNi2 compounds ordered at low temperatures, J. Alloys Compd. 735 (2018) 1088–1095. 10.1016/j.jallcom.2017.11.194.
- Gignoux and Schmitt [1993] D. Gignoux, D. Schmitt, Competition between commensurate and incommensurate phases in rare-earth systems: Effects on magnetic phase diagrams, Phys. Rev. B 48 (1993) 12682–12691. 10.1103/PhysRevB.48.12682.
- Lin et al. [1991] H. Lin, L. Rebelsky, M. F. Collins, J. D. Garrett, W. J. L. Buyers, Magnetic structure of , Phys. Rev. B 43 (1991) 13232–13239. 10.1103/PhysRevB.43.13232.
- Mailhot et al. [1992] A. Mailhot, M. L. Plumer, A. Caillé, P. Azaria, Effect of biquadratic exchange on the axial heisenberg model: Application to the magnetic phase transitions in , Phys. Rev. B 45 (1992) 10399–10407. %****␣R2Ni2In_arXiv_20220715.tex␣Line␣850␣****10.1103/PhysRevB.45.10399.
- Stevens [1952] K. W. H. Stevens, Matrix elements and operator equivalents connected with the magnetic properties of rare earth ions, Proc. Phys. Soc. A 65 (1952) 209–215. 10.1088/0370-1298/65/3/308.
- Gennes [1962] P. G. D. Gennes, Interactions indirectes entre couches 4f dans les métaux de terres rares, J. Phys. Radium 23 (1962) 510–521. 10.1051/jphysrad:01962002308-9051001.
- Noakes and Shenoy [1982] D. R. Noakes, G. K. Shenoy, The effect of a crystalline electric field on the magnetic transition temperatures of rare-earth rhodium borides, Phys. Lett. A 91 (1982) 35–36. 10.1016/0375-9601(82)90258-4.
- Rossat-Mignod [1987] J. Rossat-Mignod, Magnetic structures, in: K. Sköld, D. L. Price (Eds.), Methods in Experimental Physics, volume 23, Elsevier, San Diego, 1987, pp. 69–157.
- Prokes̆ et al. [2005] K. Prokes̆, E. Muñoz-Sandoval, A. D. Chinchure, J. A. Mydosh, Uncompensated antiferromagnetic structure of Ho2Ni2Pb, Eur. Phys. J. B 43 (2005) 163–174. 10.1140/epjb/e2005-00039-1.