1Midnapore City College, Kuturia, Bhadutala, Paschim Medinipur, West Bengal, India 721129
Detection of interstellar cyanamide (NH2CN) towards the hot molecular core G10.47+0.03
Abstract
In the interstellar medium, the amide-type molecules play an important role in the formation of the prebiotic molecules in the hot molecular cores or high mass star formation regions. The complex amide-related molecule cyanamide (NH2CN) is known as one of the rare interstellar molecule which has a major role in the formation of urea (NH2CONH2). In this article, we presented the detection of the emission lines of cyanamide (NH2CN) towards the hot molecular core G10.47+0.03 between the frequency range 158.49–160.11 GHz using the Atacama Large Millimeter/submillimeter Array (ALMA) interferometric radio telescope. The estimated column density of the emission lines of NH2CN using the rotational diagram model was (NH2CN) = (6.600.1)1015 cm-2 with rotational temperature () = 201.23.3 K. The fractional abundance of NH2CN with respect to H2 towards the G10.47+0.03 was (NH2CN) = 5.07610-8. Additionally, we estimated the NH2CN/NH2CHO abundance ratio towards the G10.47+0.03 was 0.170, which was nearly similar with NH2CN/NH2CHO abundance ratio towards the IRAS 16293–2422 B and Sgr B2 (M). We found that the observed abundance of NH2CN with respect to H2 towards the G10.47+0.03 fairly agrees with the theoretical value predicted by Garrod (2013). We also discussed the possible formation and destruction pathways of NH2CN.
keywords:
ISM: individual objects (G10.47+0.03) – ISM: abundances – ISM: kinematics and dynamics – stars: formation – stars: massivesabya.pal@gmail.com
09 Decembar 202124 May 2022
xyz/123 \artcitid#### \volnum000 2021 \pgrange1–11 \lp11
1 Introduction
In the interstellar medium (ISM), cyanamide (NH2CN) is one of the rare amide-type molecule that was created with two individual nitrogen atoms. In prebiotic chemistry, the complex organic molecule NH2CN is converted into urea (NH2CONH2) after the reaction with H2O, which plays a very important role in the formation of the biochemical and biological process (Kilpatrick, 1947). The NH2CN was the first interstellar molecule that contained an NCN frame (Turner et al., 1975). The NH2CN molecule has a pyramidal equilibrium structure with 0+ and 0- substates (Sharma, 2021). The electric dipole moments of NH2CN molecule with 0+ and 0- substate were D and D, respectively (Brown et al., 1985). In ISM, carbodiimide isomer (HNCNH) was created due to the photochemical reaction of NH2CN and induced thermal reactions in the presence of interstellar ice analogs (Duvernay et al., 2005). The carbodiimide molecule was used to link biological processes with the assembly of peptides and amino acids (Williams & Ibrahim, 1981). Earlier, the emission lines of NH2CN were detected towards the hot molecular core (HMC) Sgr B2 (Turner et al., 1975), Orion KL (White et al., 2003), and the high-mass protostar IRAS 20126+410 (Palau et al., 2017). The emission lines of NH2CN were tentatively detected towards the low-mass star formation region Barnard 1b (Marcelino et al., 2018). Recently, an NH2CN molecule was detected towards the low mass solar-type protostar IRAS 16293–2422 B using ALMA in the framework of the Protostellar Interferometric Line Survey (PILS) (Coutens et al., 2018). Towards the IRAS 16293–2422 A, Coutens et al. (2018) do not see any evidence of NH2CN because the emission lines are broader than 16293–2422 B (2 km s-1). The emission lines of NH2CN was also detected from NGC 1333 IRAS2A using the Plateau de Bure Interferometer (PdBI) (Coutens et al., 2018). Outside of Milkyway, NH2CN molecule was also detected towards the galaxy NGC 253 and M82 (Martín et al., 2006; Aladro et al., 2011).
| Observation date | On-source time | Frequency range | Spectral resolution | Sensitivity (10 Km s-1) |
|---|---|---|---|---|
| (yyyy-dd-mm) | (hh:mm) | (GHz) | (kHz) | (mJy beam-1) |
| 2017-07-03 | 00:28.72 | 158.49–159.43 | 1128.91 | 0.78 |
| – | – | 159.18–159.65 | 488.28 | 0.80 |
| – | – | 159.49–160.43 | 1128.91 | 0.79 |
| – | – | 159.64–160.11 | 488.28 | 0.79 |
In ISM, G10.47+0.03 (hereafter, G10) is a highly chemically rich HMC that was located at a distance of 8.6 kpc (Sanna et al., 2014). The luminosity of G10 was 106 L⊙, which is one of the highest luminosity star-forming region in the galaxy and particular interest to the investigation of the complex molecular lines (Rolffs et al., 2009). This HMC is one of the young cluster in ISM. Earlier, Gorai et al. (2020) detected the emission lines of formamide (NH2CHO), methyl isocyanate (CH3NCO), and isocyanic acid (HNCO) towards the G10 using ALMA. Recently, the emission lines of aldehyde and alcohol-related molecules, such as methanol (CH3OH), ethylene glycol ((CH2OH)2), acetaldehyde (CH3CHO), propanal (CH3CH2CHO), glycolaldehyde (HOCH2CHO), acetone (CH3COCH3), methyl formate (CH3OCHO), and dimethyl ether (CH3OCH3) were also detected towards the G10 using ALMA (Mondal et al., 2021). The complex prebiotic molecule methenamine (CH2NH) and methylamine (CH3NH3) were also detected towards the G10, which was known as a possible precursor of the simplest amino acid glycine (Suzuki et al., 2016; Ohishi et al., 2019). Recently, the emission lines of another possible glycine precursor molecule, amino acetonitrile (NH2CH2CN) were also detected towards the G10 using ALMA (Manna & Pal, 2022). After the successful detection of amino acetonitrile towards the G10, Manna & Pal (2022) also estimated the upper limit column density of glycine conformer I and II was 1.251015 cm-2 and 4.861013 cm-2.
In this article, we presented the interferometric detection of cyanamide (NH2CN) towards the G10 between the frequency range 158.49–160.11 GHz using ALMA. The observations and data reduction were presented in Section 2 The result of the detection of emission lines of NH2CN was shown in Section 3 The discussion and conclusion were shown in Section 4 and Section 5
2 Observations and data reductions
To search for the emission lines of complex organic molecular gases towards the HMC candidate G10, we used the interferometric raw data of Atacama Large Millimeter/Submillimeter Array (ALMA)111https://almascience.nao.ac.jp/asax/ cycle 4 with 12 m array data (#2016.1.00929.S., PI: Ohishi, Masatoshi). The observation of molecular lines towards the G10 was carried out with ALMA band 4 with an observed phase center ()J2000 = (18:08:38.232, –19:51:50.400). A total of thirty-nine antennas were used during the observation of G10. The observation aims to study the five-strong emission lines of the simplest amino acid glycine towards the G10. The observed frequency range was taken between 158.49–160.43 GHz with an angular resolution of 1.76′′. During the observation of G10, the flux calibrator was taken as J1733–1304, the phase calibrator was taken as J1832–2039, and the bandpass calibrator was taken as J1924–2914. The systematic velocity () of G10 was 67–68 km s-1 (Rolffs et al., 2011). During the observation, the minimum baseline was 15 m and the maximum baseline was 331 m. The observation summary is presented in Table 1. Gorai et al. (2020) presented a detailed description of the observations of G10 using ALMA.
Observed frequency Transition Peak intensity S FWHM VLSR Remark (GHz) (–) (K) (s-1) (K) (Debye2) (km s-1) (km s-1) (K km s-1) 158.8418 8(1,8)–7(1,7),V = 1 119.75 3.9510-4 7.297 143.888 10.5850.46 68.7010.14 68.2025.69 Non blended 158.8911 8(1,8)–7(1,7), V = 0 48.81 4.0510-4 3.902 442.242 10.2420.42 68.6830.15 42.9713.22 Non blended 159.5236∗ 8(7,1)–7(7,0), V = 1∙ 795.05 9.5010-5 6.298 34.195 10.1380.37 68.5390.72 52.2036.75 Slightly blended 159.5951 8(2,7)–7(2,6), V = 1 162.29 3.7310-4 8.726 401.860 10.7480.38 68.6350.93 70.27711.26 Non blended 159.6032∗ 8(6,2)–7(6,1), V = 1 612.81 1.7810-4 7.650 191.434 10.8350.82 68.2360.21 83.62516.36 Blended 159.6077 8(2,6)–7(2,5), V = 1 162.30 3.7310-4 7.650 401.798 10.8950.83 68.2380.23 83.86916.27 Blended 159.6360∗ 8(7,1)–7(7,0), V = 0 740.02 9.7810-5 3.769 105.364 10.7040.54 68.7840.18 31.9065.21 Blended 159.6671∗ 8(5,3)–7(5,2), V = 1 458.26 2.4810-4 11.912 88.867 10.5821.05 68.9820.88 26.2212.98 Blended 159.7167∗ 8(4,4)–7(4,3), V = 1 331.58 3.0510-4 5.380 328.002 10.9560.98 68.5970.69 100.45323.29 Blended 159.7316∗ 8(6,2)–7(6,1), V = 0 553.82 1.8310-4 0.613 65.570 10.2360.76 68.6930.82 1.6960.19 Blended 159.7499 8(3,6)–7(3,5), V = 1 232.90 3.4910-4 0.826 125.180 10.6830.84 68.7260.65 5.1080.96 Blended 159.8104∗ 8(5,3)–7(5,2), V = 0 395.72 2.5510-4 4.469 274.038 10.4900.64 68.5970.76 63.69512.27 Blended 159.8147 8(0,8)–7(0,7), V = 1 105.83 4.0810-4 4.469 438.265 10.4900.69 68.5900.79 69.42810.38 Blended 159.8785∗ 8(4,4)–7(4,3), V = 0 266.09 3.1510-4 2.564 112.499 10.3681.69 68.5030.51 22.5573.69 Non blended 159.9188 8(2,7)–7(2,6), V = 0 92.51 3.9310-4 1.838 140.305 10.8230.75 68.5610.92 18.6611.29 Blended 159.9335 8(2,6)–7(2,5), V = 0 92.51 3.9310-4 9.869 140.313 10.8260.79 68.5960.73 85.14810.36 Non blended 159.9427 8(0,8)–7(0,7), V = 0 34.54 4.2010-4 15.239 149.774 10.3280.69 68.6940.82 157.86716.38 Non blended 160.1040 8(3,6)–7(3,5), V = 0 164.91 3.6710-4 5.569 391.627 10.0681.92 68.7931.29 57.90710.23 Non blended 160.1051 8(3,5)–7(3,4), V = 0 164.91 3.6710-4 5.570 391.627 10.0611.98 68.7931.23 57.90610.20 Non blended
– Transitions contain double with frequency difference less than 100 kHz. The quantum numbers of the second are not shown.
∙ denoted the optical thick.
For the reduction of the interferometric raw data of G10, we used the Common Astronomy Software Application (CASA 5.4.1)222https://casaguides.nrao.edu/ with the standard data reduction pipeline delivered by the ALMA observatory (McMullin et al., 2007). During the analysis, the continuum flux density of the flux calibrator for each baseline was scaled and matched with the Perley-Butler 2017 flux calibrator model with 5% accuracy using task SETJY (Perley & Butler, 2017). The task SETJY sets the model visibility amplitude and phase associated with a flux density scale and a specified clean component image into the model column of the data set. After the flux, bandpass, and gain calibration using the data reduction pipeline, we separated the calibrated target data using the CASA task MSTRANSFORM with rest frequency in each spectral window. The CASA task MSTRANSFORM is often used after the initial calibration of the target data to make a smaller measurement set with only the data that will be used in further flagging, spectral imaging, and self-calibration. After the split of target data, We performed a first-order baseline fit to subtract the continuum emission from spectral data cubes in the CASA pipeline using the task UVCONTSUB. For the analysis, we separated each spectral window into two data cubes, continuum, and line emission, using the task UVCONTSUB. Now, we create the spectral data cubes of G10 using task TCLEAN with the rest frequency of each spectral window. After the generation of the spectral data cubes, we applied the self-calibration using the tasks GAINCAL and APPLYCAL. After the creation of the spectral data cube, we used the task IMPBCOR for the correction of the synthesized beam pattern.
3 Result
3.1 Continuum emission towards the G10
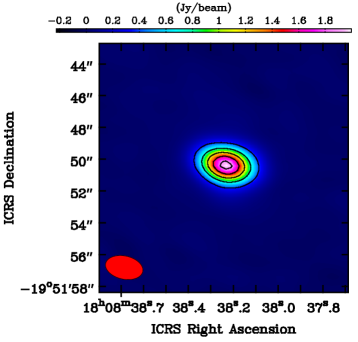
We presented the millimeter continuum emission image of G10 at wavelength 1.87 mm (159.92 GHz), which is presented in Figure 1. In a continuum image, the surface brightness colour scale has the unit of Jy beam-1. After the generation of the continuum emission map, we fitted the 2D Gaussian over the continuum image using CASA task IMFIT and we obtained the peak flux 1.9120.01 Jy beam-1 and integrated flux 2.4980.03 Jy. The synthesized beam size of the continuum image was 2.381.45′′. The position angle of the continuum image was 77.513∘. The observed beam size of the continuum image is not sufficient to resolve the continua. Recently, Gorai et al. (2020) estimated the peak flux density and integrated flux density of G10 at frequency 159.45 GHz to be 1.86 Jy beam-1 and 2.477 Jy using ALMA. Earlier, Rolffs et al. (2011) detected the millimeter continuum emission between the frequency range 201–691 GHz with the variation of flux density 6–95 Jy corresponding spectral index 2.8.
3.2 Line emission towards the G10
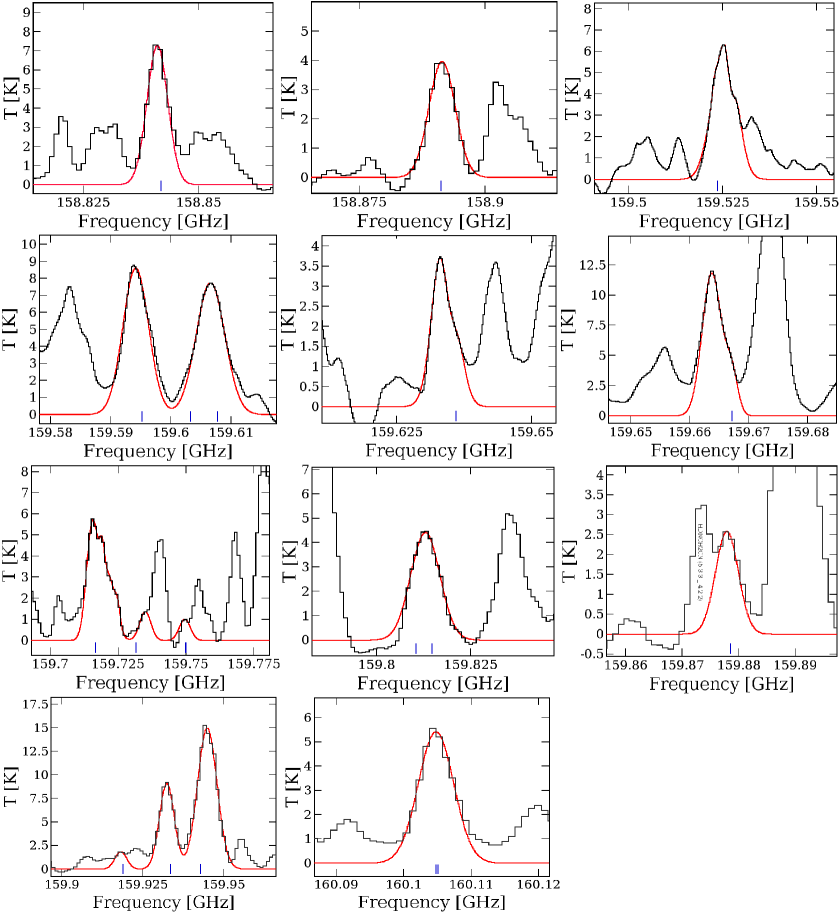
We extracted the sub-millimeter molecular emission spectra of G10 from the continuum subtracted spectral data cubes to create a 2.5′′ diameter circular region at the center of RA (J2000) = (18h08m38s.232), Dec (J2000) = (–19∘51′50′′.440). The systematic velocity () of the sub-millimeter spectra of G10 was 68.50 km s-1. After the extraction of the chemically rich molecular sub-millimeter spectrum from G10, we used CASSIS333http://cassis.irap.omp.eu/?page=cassis (Vastel et al., 2015) for the identification of the emission lines of complex organic molecules. After deep spectral analysis, we identified the emission lines of the amide-related molecule cyanamide (NH2CN), which was known as a precursor of urea. For identification of the emission lines of NH2CN, we used the Cologne Database for Molecular Spectroscopy (CDMS)444https://cdms.astro.uni-koeln.de/cgi-bin/cdmssearch (Müller et al., 2005) or Jet Population Laboratory (JPL) 555https://spec.jpl.nasa.gov/ftp/pub/catalog/catform.html (Pickett et al., 1998) molecular spectroscopic databases. The hot core G10 was extremely chemically rich and the detection of the proper emission lines of NH2CN was very difficult due to contamination of other nearby molecular transitions. We detected a total of nineteen rotational transition lines of NH2CN between the frequency range of 158.49–160.43 GHz towards the G10.
After the detection of the emission lines of NH2CN from G10, we fitted the Gaussian model over the observed spectra of NH2CN using the line analysis module in CASSIS. After the fitting of Gaussian model over the observed emission lines of NH2CN, we calculated the Full-Width Half Maximum (FWHM), quantum numbers (–), upper state energy (), Einstein coefficients (), peak intensity and integrated intensity (). There was no missing transition of NH2CN in this data. The summary of the detected transitions of NH2CN was presented in Table 2 and the observed spectra of NH2CN with Gaussian fitting were shown in Figure 2. In Figure 2, the black spectra indicated the observed millimeter spectra of G10, and the red synthetic spectra indicated the Gaussian model which was overlaid on the observed spectra of NH2CN. We observed some hyperfine transitions of NH2CN are presented corresponding to a single spectral profile because the present spectral resolution is not sufficient to resolve the emission lines of NH2CN. The continuum emission was completely subtracted from the emission spectra. Our detected maximum transition lines of NH2CN towards the G10 were blended with other nearby molecular lines because the observed transitions did not resolve due to the low spectral resolution.
| Transition | Emitting region | |
|---|---|---|
| (–) | (K) | [′′] |
| J = 8(1,8)–7(1,7),V = 1 | 119.75 | 1.123 |
| J = 8(1,8)–7(1,7), V = 0 | 48.81 | 1.139 |
| J = 8(2,7)–7(2,6), V = 1 | 162.29 | 1.196 |
| J = 8(4,4)–7(4,3), V = 0 | 266.09 | 1.263 |
| J = 8(2,6)–7(2,5), V = 0 | 92.51 | 1.179 |
| J = 8(0,8)–7(0,7), V = 0 | 34.54 | 1.279 |
| J = 8(3,6)–7(3,5), V = 0 | 164.91 | 1.038 |
| J = 8(3,5)–7(3,4), V = 0 | 164.91 | 1.039 |
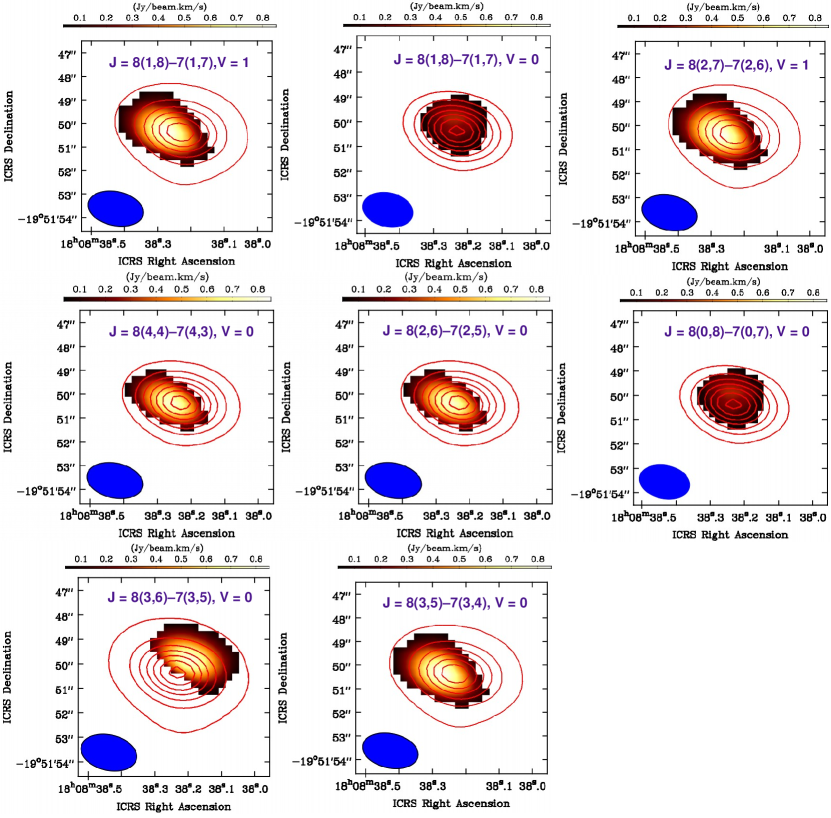
3.3 Spatial distribution of NH2CN
After the detection of the emission lines of NH2CN towards the G10, we created the integrated emission map of NH2CN using task IMMOMENTS in CASA. The integrated emission map was presented in Figure 3 which overlaid the 1.87 mm continuum emission. We noticed the emission map of NH2CN has a peak at the position of the continuum. The integrated emission maps of NH2CN were created by integrating the spectral data cubes in the velocity range where the emission lines of NH2CN were detected. We extracted the integrated emission map only for the unblended transition of NH2CN. The integrated emission map indicated that the different transitions of NH2CN molecule emit from the different locations of the warm inner region of the hot core due to the different upper state energy (Eup) of all unblended transitions. We measured the emitting region of NH2CN by fitting the 2D Gaussian of the integrated emission map of NH2CN using CASA task IMFIT towards the G10. The deconvolved beam size of the emitting region was calculated by the following equation
| (1) |
| Simulated Valuesa | Observed Valuesb | |||
|---|---|---|---|---|
| Species | Fast | Medium | Slow | G10 |
| f(NH2CN) T (K) | f(NH2CN) T (K) | f(NH2CN) T (K) | f(NH2CN) T (K) | |
| NH2CN | 267 | 205 | 195 | 201.20 |
Notes: a – Values taken from Table 8 of Garrod (2013);
b – this work.
where was the diameter of the circle whose area () was enclosing line peak and was the half-power width of the synthesized beam (Rivilla et al., 2017). The estimated emitting region of NH2CN with unblended transitions is presented in Table 3. The emitting region of NH2CN was varies between 1.038′′–1.279′′. We noticed that the emitting region of NH2CN is smaller than the beam size of the integrated emission map which indicated the unblended transition lines of NH2CN are not well spatially resolved or, at best, marginally resolved.
3.4 Rotational diagram analysis of NH2CN
We have detected the multiple hyperfine transition lines of NH2CN towards the G10. The rotational diagram method is one of the best way to obtain the column density () in cm-2 and rotational temperature () in K of the detected emission lines of NH2CN. Initially, we assumed that the detected NH2CN spectra were optically thin and that they populated the Local Thermal Equilibrium (LTE) conditions. The assumption of LTE condition was reasonable towards the G10 because the density of inner regions of the hot core was 7107 cm-3 (Rolffs et al., 2011; Gorai et al., 2020; Manna & Pal, 2022). The equation of column density for optically thin emission lines can be written (Goldsmith & Langer, 1999),
| (2) |
where, is the Boltzmann constant, is the integrated intensity, is the electric dipole moment, is the degeneracy of the upper state, is the rest frequency, and the strength of the transition lines were indicated by . The total column density of detected species under LTE conditions can be written as,
| (3) |
where is the partition function at extracted rotational temperature () and is the upper state energy of the observed molecular lines. In another way, the Equation 3 can be rearranged as,
| (4) |
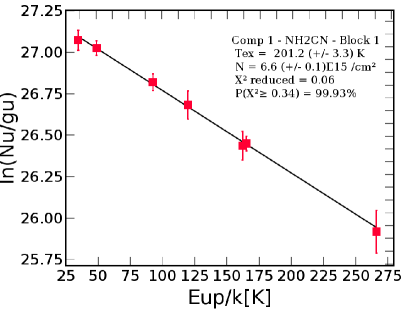
Equation 4 presented a linear relationship between upper energy (Eu) and ) of the detected molecule NH2CN. The value ) was estimated from the equation 2. From equation 4, it is indicated that spectral data points with respect to different transition lines of NH2CN should be fitted with a straight line whose slope is inversely proportional to , with its intercept yielding , which in turn will help to estimate the molecular column density. During the rotational diagram analysis, we extracted the line parameters such as FWHM, upper energy (), Einstein coefficients (Aij), and integrated intensity () using a Gaussian fitting over the originally observed transition of NH2CN using CASSIS. The fitting properties are presented in Table 2. We noticed some hyperfine transitions of NH2CN exists corresponding to a single spectral profile because the present spectral resolution is not sufficient to resolve the transition lines of NH2CN. We used the high-intensity hyperfine transitions of NH2CN in our rotational diagram analysis. We have observed the maximum transitions of NH2CN contaminated with nearby molecular transitions. So, we used only unblended transitions of NH2CN during the rotational diagram analysis. We noticed that the J = 8(7,1)–7(7,0), V = 1 transition line of NH2CN was slightly blended but that line was optically thick. This transition of NH2CN was excluded from the rotation diagram analysis because the rotational diagram method is applicable only for optically thin emission lines. The computed rotational diagram of NH2CN was shown in Figure 4. In the rotational diagram, the vertical red error bars were the absolute uncertainty of ) originated from the error of the estimated which was calculated after fitting the Gaussian model over the detected unblended emission lines of NH2CN. Using the rotational diagram analysis, we estimated the column density of NH2CN was (NH2CN) = (6.600.1)1015 cm-2 with rotational temperature = 201.203.3 K. The estimated fractional abundance of NH2CN with respect to H2 was (NH2CN) = 5.07610-8 where column density of H2 was (H2) = 1.31023 cm-2 (Suzuki et al., 2016).
We also calculated that the NH2CN/NH2CHO abundance ratio towards the G10 was 0.170, which agreed well with the NH2CN/NH2CHO ratios of the low mass star-formation region IRAS 16293 B and the hot core Sgr B2 (M). The column density of NH2CHO towards the G10 was 3.881016 cm-2 (Gorai et al., 2020). We estimated the NH2CN/NH2CHO abundance ratio because NH2CN and NH2CHO share NH2 as a common precursor (Coutens et al., 2018). The NH2CN/NH2CHO ratio towards the IRAS 16293 B was 0.2 (Coutens et al., 2018) and Sgr B2 (M) was 0.15 (Belloche et al., 2013). The NH2CN/NH2CHO ratio in another hot core Orion KL seems to be higher, i.e.0.4–1.49 (White et al., 2003).
4 Discussion
4.1 Comparison with observation and theoretical abundances of NH2CN
Now we compared our calculated abundance of NH2CN with three-phase warm-up modeling results of Garrod (2013). Garrod (2013) assumed that there would be an isothermal collapse phase after a static warm-up phase. In the first phase, the density increases from = 3103 to 107 cm-3 under the free-fall collapse, and the dust temperature falls to 8 K from 16 K. In the second phase, the dust temperature varies from 8 K to 400 K but the density remains constant at 107 cm-3 (Garrod, 2013). The number density () of G10 was 107 cm-3 and temperature of the warm region was 150 K (Rolffs et al., 2011; Gorai et al., 2020; Ohishi et al., 2019; Suzuki et al., 2016). So, the three-phase warm-up hot core model of Garrod (2013) is suitable for understanding the chemical evolution of NH2CN towards the G10. In the three-phase warm-up model, Garrod (2013) used the fast, medium, and slow warm-up models based on the time scale. In Table 4, we compared the estimated fractional abundance of NH2CN with the three-phase warm-up model of Garrod (2013) and we noticed that the simulation result was nearly similar to our observational results. We found the medium warm-up model best matched the observed abundance of NH2CN towards the G10. During the comparison of the observed abundances and simulated abundances of NH2CN, we noticed the tolerance factor 1.5 which is a reasonably good agreement between the observational and theoretical results. Earlier, Manna & Pal (2022) and Ohishi et al. (2019) also claimed that the medium warm-up model was the best for the environment of G10.
4.2 Formation and destruction mechanism of NH2CN
In the ISM, the low mass protostar IRAS 16293–2422 B was the only interstellar source where multiple emission lines of NH2CN was detected (Coutens et al., 2018). Earlier, Coutens et al. (2018) tried to understand the formation pathways of NH2CN towards the ISM sources without much success. According to the Kinetic Database for Astrochemistry (KIDA)666http://kida.astrophy.u-bordeaux.fr/, there are no known gas-phase reactions. In the UMIST 2012 astrochemistry chemical reaction network (McElroy et al., 2013), there are present two known gas-phase reactions which lead to the synthesis of NH2CN in the ISM sources. According to the UMIST 2012 astrochemistry database, the NH2CN molecule will produce in the ISM via two pathways, (1) Neutral-neutral reaction between ammonia (NH3) and cyanide (CN) in the grain surfaces of HMCs created NH2CN (CN+NH3NH2CN+H) (Smith et al., 2004), and 2) Electronic recombination of NH2CNH+ created NH2CN (NH2CNH++e-NH2CN+H) but to create this ion is through protonation of NH2CN itself (Coutens et al., 2018). The reaction between NH3 and CN is the most efficient pathway to create NH2CN in the grain surfaces of both HMCs and solar like protostars because NH3 and CN are the high abundant compounds in the ISM (Smith et al., 2004; Coutens et al., 2018). Recently, Coutens et al. (2018) claimed the NH2CN molecule created towards the IRAS 16293–2422 B between the reaction of NH3 and CN. Similarly, NH2CN molecule will destroy via three pathways, 1) Cosmic ray-induced photo-reaction (NH2CN+CRPHOTNH2+CN), 2) Ion-neutral reaction (H3++NH2CNNH2CNH++H2), and 3) Photoprocess reaction (NH2CN+hNH2+CN). Jiménez et al. (2020) presented the possible chemical pathways to the formation of urea, 2-amino-oxazole, beta-ribocytidine-2’, 3’-cyclic phosphate (pyrimidine ribonucleotide), and cytosine from NH2CN using the biochemistry synthesis routes towards the HMC and Sun-like protostars.
5 Conclusion
In summary, we have detected evidence of the emission lines of NH2CN which was known as a direct precursor of urea. We draw the following conclusions,
We successfully detected a total of nineteen rotational emission lines of NH2CN towards the hot core G10 between the frequency range of 158.49–160.11 GHz.
We estimated the statistical column density of NH2CN was (6.600.1)1015 cm-2 with rotational temperature 201.23.3 K. The fractional abundance of NH2CN with respect to H2 towards the G10 was 5.07610-8. We also estimated the NH2CN/NH2CHO abundance ratio was 0.170.
We encourage detailed theoretical and experimental studies using the three-phase chemical kinetics model to understand the proper formation mechanism of NH2CN towards the HMCs, galaxies, and other chemically rich sources.
ACKNOWLEDGEMENTS
We thank the anonymous referee for the helpful comments that improved the manuscript. The plots within this paper and other findings of this study are available from the corresponding author upon reasonable request this paper makes use of the following ALMA data: ADS /JAO.ALMA#2016.1.00929.S. ALMA is a partnership of ESO (representing its member states), NSF (USA), and NINS (Japan), together with NRC (Canada), MOST and ASIAA (Taiwan), and KASI (Republic of Korea), in co-operation with the Republic of Chile. Joint ALMA Observatory is operated by ESO, AUI/NRAO, and NAOJ.
References
- Aladro et al. (2011) Aladro, R., Martín, S., Martín-Pintado, J. et al. 2011, A&A, 535, A84
- Brown et al. (1985) Brown, R. D., Godfrey, P. D., Kleibömer, B., 1985, Journal of Molecular Spectroscopy, 2, 257-273
- Belloche et al. (2013) Belloche, A., Müller, H. S., Menten, K. M., Schilke, P., & Comito, C. 2013, A&A, 559, A47
- Coutens et al. (2018) Coutens, A., Willis, E. R., Garrod, R. T., et al. 2018, A&A, 612, A107
- Duvernay et al. (2005) Duvernay, F., Chiavassa, T., Borget, F., & Aycard, J.-P. 2005, J. Phys. Chem. A, 109, 603
- Garrod (2013) Garrod, R. T. 2013, ApJ, 765, 60
- Gorai et al. (2020) Gorai, P., Bhat, B., et al. 2020, ApJ 895 86
- Goldsmith & Langer (1999) Goldsmith, P. F., & Langer, W. D. 1999, apj, 517, 209
- Jiménez et al. (2020) Jiménez-Serra, I., Martín-Pintado, J., Rivilla, V. M., Rodríguez-Almeida, L., Alonso, A. E. R., Zeng, S., Cocinero, E. J., Martín, S., Requena-Torres, M., Martín-Domenech, R., Testi, L.,2020, Astrobiology, 20, 9, 1048-1066
- Kilpatrick (1947) Kilpatrick, M. L. 1947, J. Am. Chem. Soc., 69, 40
- Mondal et al. (2021) Mondal, S. K., Gorai, P., Sil, M., Ghosh, R., Etim, E. E., Chakrabarti, S. K., Shimonishi, T., Nakatani, N., Furuya, K., Tan, J. C., Das, A., 2021, arXiv:2108.06240
- Martín et al. (2006) Martín, S., Mauersberger, R., Martín-Pintado, J., Henkel, C., García-Burillo, S., 2006, ApJ, 164, 2,450-476
- Marcelino et al. (2018) Marcelino, N., Gerin, M., Cernicharo, J., et al. 2018, A&A, 620, A80
- Manna & Pal (2022) Manna, A., & Pal, S., 2022, Life Sciences in Space Research, 34, 9–15
- Müller et al. (2005) Müller, H. S. P., SchlMder, F., Stutzki, J. & Winnewisser, G. 2005, Journal of Molecular Structure, 742, 215–227
- McElroy et al. (2013) McElroy, D., Walsh, C., Markwick, A. J., Cordiner, M. A., Smith, K., Millar, T. J., 2013, A&A, 550, A36
- McMullin et al. (2007) McMullin, J. P., Waters, B., Schiebel, D., Young, W., & Golap, K. 2007, in Astronomical Society of the Pacific Conference Series, Vol. 376, Astronomical Data Analysis Software and Systems XVI, ed. R. A. Shaw, F. Hill, & D. J. Bell, 127
- Ohishi et al. (2019) Ohishi, M., Suzuki, T., Hirota, T., Saito, M. & Kaifu, N. 2019, PASJ, 71
- Palau et al. (2017) Palau, A., Walsh, C., Sánchez-Monge, Á., Girart, J. M., Cesaroni, R., Jiménez-Serra, I., Fuente, A., Zapata, L. A., Neri, R., 2017, MNRAS, 467, 2723
- Perley & Butler (2017) Perley, R. A., Butler, B. J. 2017, ApJ, 230, 1538
- Pickett et al. (1998) Pickett, H. M., Poynter, R. L., Cohen, E. A., et al. 1998, Journal of Quantitative Spectroscopy and Radiative Transfer, 60, 883
- Rolffs et al. (2011) Rolffs, R., Schilke, P., Zhang, Q., & Zapata, L. 2011, A&A, 536, A33
- Rolffs et al. (2009) Rolffs, R., Schilke, P., Zhang, Q., Wyrowski, F., Menten, K., Zapata, L., 2009, Astronomical Society of the Pacific Conference Series, 417, 215
- Rivilla et al. (2017) Rivilla, V. M., Beltran, M. T., Cesaroni, R., et al. 2017, A&A, 598, A59
- Smith et al. (2004) Smith, I. W. M., Herbst, E., & Chang, Q. 2004, MNRAS, 350, 323
- Sharma (2021) Sharma, M. K., Astrophysics, 2021, 64,71-80
- Suzuki et al. (2016) Suzuki, T., Ohishi, M., Hirota, T., Saito, M., Majumdar, L., Wakelam, V., 2016, ApJ, 825, 1, 79
- Sanna et al. (2014) Sanna, A., Reid, M. J., Menten, K. M., et al. 2014, ApJ, 781, 108
- Turner et al. (1975) Turner, B. E., Liszt, H. S., Kaifu, N., & Kisliakov, A. G. 1975, ApJ, 201, L149
- Vastel et al. (2015) Vastel, C., Bottinelli, S., Caux, E., Glorian, J. M., & Boiziot, M. 2015, in SF2A-2015: Proceedings of the Annual Meeting of the French Society of Astronomy and Astrophysics, 313–316
- Williams & Ibrahim (1981) Williams, A., & Ibrahim, I. T. 1981, Chem. Rev., 81, 589
- White et al. (2003) White, G. J., Araki, M., Greaves, J. S., Ohishi, M., & Higginbottom, N. S. 2003, A&A, 407, 589