Experimental End-To-End Delay Analysis of LTE cat-M With High-Rate Synchrophasor Communications
Abstract
Micro-Phasor Measurement Units (-PMUs) are devices that permit monitoring voltage and current in the distribution grid with high accuracy, thus enabling a wide range of smart grid applications, such as state estimation, protection and control. These devices need to transmit the synchronous measurements of voltage and current, also known as synchrophasors, to the power utility control center at high rate. The use of wireless networks, such as LTE, to transmit synchrophasor data is becoming increasingly popular. However, synchrophasors are included in small frames and it would be more efficient to use low power cellular solutions, such as LTE cat-M. In this work, we present experimental research on the deployment of a -PMU with the ability to connect over a commercial LTE cat-M network. The deployed -PMU is built with off-the-shelf hardware, such as Arduino microcontrollers, and is used to transmit data—compliant with the IEEE C37.118.2 standard—at a variable rate from 1 frame/s to 80 frames/s. A detailed network performance analysis is carried out to show the suitability of LTE cat-M to support -PMU communications. Experimental results on performance indicators, such as delay and jitter, are reported. The effect of the LTE cat-M access mechanism on the time distribution of frame arrivals is also thoroughly analyzed.
Index Terms:
LTE cat-M, Internet of Things (IoT), Synchrophasor, micro-PMU, Smart Grid.I Introduction
Phasor Measurement Units (PMUs) have traditionally been used to monitor the power grid and represent one of the major drivers in the transition from the old centralized power grid into the modern, diverse, and distributed smart grid. These devices permit the computation of the so-called synchrophasors, which are time-synchronized estimations of the magnitude and phase of voltage and/or current waveforms. Phasor Measurement Units also measure other quantities, such as frequency, and Rate of Change of Frequency (ROCOF), and are able to provide estimates of active and reactive power [1]. PMU data are extremely time-sensitive and their transmission is mainly regulated by two sets of standard procedures, namely IEC 61850 [2] and IEEE C37.118.2 [3]. Synchrophasor data are employed in a number of smart grid applications, which mainly differ in the reporting rate and in the communication requirements, such as delay and frame error rate. A thorough overview of the most common PMU applications along with their reporting and communication requirements is provided in [4], where applications are categorized based on the required time resolution and latency. Latency spans across a wide range of values: for example, protection and control applications require a maximum latency in the order of a few ms, whereas other applications, such as state estimation or outage management, can tolerate network delays in the order of 1 s. Traditional PMUs, mainly used in the transmission grid [5], provided a Total Vector Error (TVE) precision of , a phase angle accuracy of , a magnitude resolution of and an angle resolution of with around frames per second [6].
In recent years, a need for higher precision measurements in the distribution systems and micro grids entailed the deployment of a new type of synchrophasor measurement device, i.e., the micro-PMU (or -PMU). This type of devices is characterized by a TVE precision of , a phase angle accuracy of , a magnitude resolution of and an angle resolution of with up to frames per second [7]. In the last decade, with the increased use of distributed generation elements, such as photovoltaic and wind farms, -PMUs have proliferated and need to be connected to the power grid in order to collect their synchrophasor data.
PMUs and -PMU are connected to Phasor Data Concentrator (PDC), which are in charge of collecting synchrophasors from several PMUs, aligning them, and then forwarding them to the power utility [1]. Traditionally, wired connectivity, such as Ethernet or power line communications (PLCs), have been preferred due to their high performance and low delay. However, in recent years, wireless networks are becoming an increasingly popular solution to connect -PMUs to the Internet thanks to their flexibility, ease of installation and scalability. Previous work on wireless networks for PMUs or -PMUs has predominantly focused on cellular technologies, such as WiMax, UMTS [8] and LTE [9, 10]. However, the coverage of WiMax is not extensively available, consequently undermining large-scale -PMU deployments. On the other hand, UMTS and LTE, despite providing a quasi-ubiquitous coverage, were conceived to support human traffic, which is considerably different from -PMU traffic [11]. One basic difference lies in the size of the synchrophasor frames, which are in the order of a few tens of Bytes, as opposed to the larger data commonly exchanged in human traffic such as video streaming or web surfing. As a result, the large resources required for LTE transmission, in terms of bandwidth and energy, would not be efficiently used to transmit -PMU data.
Therefore, in this work, we are proposing to wirelessly connect -PMUs using LTE cat-M, one of the so-called Cellular-Internet of Things (C-IoT) technologies [12]. This LTE-based technology is characterized by a limited use of the frequency spectrum and a lower cost, both in terms of hardware (LTE cat-M radio are cheaper than standard LTE radios) and in terms of data plans, which are cheaper with respect to other cellular networks. In order to test the suitability of LTE cat-M to transmit synchrophasor data, we deployed a -PMU using Arduino microcontroller boards and a GPS module. This prototype of -PMU is connected to an AC power signal generator, samples the power signal, generates synchrophasor frames (compliant with the IEEE C37.118.2 standard), and transmits them to a laptop, which represents the PDC, using a commercial LTE cat-M network in the US. To the best of our knowledge, this is the first study to propose using LTE cat-M for -PMU communications.
The main contributions of this paper are: i) the development of a low-cost low-complexity prototype of a -PMU with LTE-M transmission capability, ii) the characterization of frames and transmission rates compliant to the IEEE C37.118.2 standard, and iii) an experimental analysis of end-to-end delay of LTE cat. M for synchrophasor communications. The remainder of this paper is structured as follows: in Section II, an overview of the state of the art is presented; in Section III, the proposed system modelling is described; numerical results are reported in Section IV; finally, the conclusions of this research are discussed in Section V.
II State of the Art
The pervasive installation of Distributed Energy Resources into power distribution systems along with the popularity of demand-response initiatives have led distribution networks to work outside their operational limits. To cope with the more stringent requirements on these systems, recent trends show that improvements of the distribution system management are preferred over network capacity increase [13]. PMUs and -PMUs are key elements to increase the observability and enhance metering in distribution networks [14]. These devices are expected to bring about substantial improvements in power systems in terms of reliability, security, and overall performance [14].
There is a great deal of literature analyzing the positive effect of synchrophasor devices on the performance of distribution systems [15, 16, 17, 18, 19]. In particular, Mohsenian et al provided examples to demonstrate the importance of using PMUs and -PMUs in the distribution grid [15]. They showed, in one of these examples, how to use data from multiple PMUs to identify a short-circuit fault event, therefore allowing a quick deployment of field crews at fault location. They also advocated the importance of developing predictive analytics based on machine learning and big data techniques [15]. In [16], Chai et al. proposed to use PMUs to enable real-time state estimation. To cope with the lack of a solid and steady communication infrastructure, the authors introduced C-DAX, a communication platform based on the information-centric networking theory. C-DAX employs a combination of PLC and optical fiber to support synchrophasor communications [16]. A real-time monitoring infrastructure was also proposed by Pignati et al. in [18], based on a hierarchical architecture with Ethernet, single-pair high-speed digital subscriber line and optical fiber. The proposed system was deployed on the EPFL campus and an average end-to-end latency of 65 ms was obtained. A similar hierarchical architecture was considered in [19] with a combination of wired and wireless technology. Wireless links were emulated using the well-known EMANE platform111Networks and Communication Systems Branch: EMANE. Available: http://cs.itd.nrl.navy.mil/work/emane/index.php..
The use of wireless networks to support synchrophasor communications has become increasingly popular in recent years [20, 9, 21, 22, 23, 10]. In [20], it was proposed to use WiMax technology for the wide area PMU communications. The authors employed existing network simulation software (i.e., OPNET) in order to evaluate different scheduling services in a network with a maximum of 50 PMUs, a reporting rate of 25 Hz and a maximum application delay of 40 ms. Network simulation for PMU communications was also performed in [10], where the authors considered a smart-city environment with a realistic LTE cellular infrastructure. The employed network simulator222Available at www.trafficm2modelling.com., permitted considering up to 21 PMUs and 25 thousands PMUs along with traffic generated from more than 300 thousands smart meters; however, human traffic was not considered [24, 25]. A more realistic study with LTE was carried out in [9], where Dervivskadic et al. used a commercial LTE network to support data transmission from 10 PMUs. The authors analyzed the total PDC reporting latency with 4 different logics and then compared the experimental LTE results against a wired network benchmark with optical fiber.
Even though latest generations of wireless networks provide promising results, the variability of wireless transmissions entails the possibility of dropping frames or unpredictable degradation of the performance, leading to large delays and potentially compromising the success of the considered power system applications. In order to cope with this effect, [21] proposed a statistical method to compensate for bad communication data. Pourramezan et al. later proposed a novel method to coordinate different PDCs to mitigate the variability of data transmitted by different PMUs over a commercial LTE network [23]. Zhu et al. proposed in [26] to use spatial-temporal correlations of PMUs data to to fix missing measurements and abnormal values.
| PMU Name | GridTrak PMU [27] | OpenPMU V1 [28] | OpenPMU V2 [28] | Mohapatra [29] | Our Design |
|---|---|---|---|---|---|
| Approx. cost | 150$ | 400$ | 100$ | 500$ | 150$ |
| Hardware | dsPIC30F microcontroller | NI DAQ | BeagleBone B. | Arduino Due | Arduino Mega |
| Software | C# | LabView | Linux | Linux, Python | Python |
| Open-Source | Yes | No | Yes | Yes | Yes |
| IEEE C37.118.2 Compliance | Yes | Yes | Yes | No | Yes |
| Communication | Wired | Wired | Wired | Wired | Wireless (LTE cat-M) |
LTE cat-M was originally introduced by 3GPP in Release 13 with a reduced bandwidth with respect to legacy LTE, coverage enhancement modes, support for half-duplex communications, and power reduction techniques, such as enhanced discontinuous reception. It was later improved with mobility enhancements (Rel. 14), improved spectral efficiency (Rel. 15), and ultra-low power wake-up radio operation to extend User Equipment (UE) battery life (Rel. 16). The performance of LTE cat-M has been investigated by a large body of literature [30, 31, 32, 33, 34, 35]. In particular, Elsaadany et al. presented an overview on the features and challenges of cellular networks for IoT applications [30], focusing on the characteristics of the physical layer of LTE cat-M and exploring the pros and cons of this technology compared to available alternatives, such as LTE cat-0 and NB-IoT. [31, 32, 35] used NS-3 to perform simulation at the network layer: [31] analyzed a large-scale scenario with 500 end devices, however no indication of the type of traffic generated by each device was provided; [32] focused on the impact of network parameters, such as the number of repetitions, on the error rate, coverage, and battery life; [35] proposed a comparison of network performance with LTE cat-0 and observed a larger achieved throughput, with lower delay, frame losses and jitter with respect to LTE cat-0. [34] evaluated the possibility of allocating fractions of resource blocks to UEs with small frames to transmit, as in the 5G massive machine-type communication scenario. An experimental study to analyze the coverage enhancement of LTE cat-M with respect to legacy LTE was proposed in [33]. Despite the realistic setup considered in this study, also complemented with simulation results using Matlab, no information was provided on latency nor on the type of traffic generated by the UEs.
The deployment of PMU prototypes has already been investigated by a good deal of research and a comprehensive literature review can be found in [36]. In particular, [29] employed 3 micro-controllers for phasor measurement and reporting. Another example is the work done in the OpenPMU project [28] to create a low cost open-source PMU. OpenPMU V1 uses National Instrument hardware and LabView software, but OpenPMU V2 employs complete open-source hardware and software. In the case of GridTrak PMU, presented in [27], two micro-controllers are used, one for Phasor generation and another for PPS generation. Differently from the existing literature, where wired technologies and protocols, such as Ethernet, were adopted, for this work we deployed a low-cost -PMU with the ability to transmit data using LTE cat-M. A comparison of our work against some of the existing low-cost research-oriented PMU deployments is shown in Table I.
III System Description
The objectives of this study are to deploy a functional prototype of -PMU with the ability to wirelessly transmit synchrophasor data to the PDC and to study the suitability of LTE cat-M to transmit synchrophasor frames. In order to achieve these features, our -PMU consists of two main modules, i.e., i) a synchrophasor generator module and ii) a communication module. The schematic of the system architecture is illustrated in Figure 1, where the -PMU prototype and the PDC node are enclosed in dashed boxes. The -PMU box also contains two dotted boxes, which represent the two aforementioned modules. The PDC node is represented by a laptop connected to the Internet through an Ethernet cable. Our testbed also includes an AC signal generator (which can produce voltage signals with a 0-5V amplitude and a frequency in the range 1Hz-65534Hz) and a commercial LTE cat-M network with an eNodeB connected to the Internet333The core of the LTE cat-M network is not shown in Figure 1, as it is not within the scope of this work.. In the remainder of this section, the system components are described in more detail.
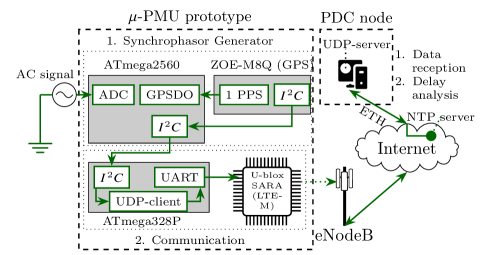
III-A Synchrophasor generation module
In order to test the creation and transmission of realistic synchrophasor data, we need an AC signal to be monitored and an accurate time source. An Arduino ATmega2560 is employed to get the instantaneous voltage values from the AC signal generator and compute the synchrophasors. We can generally indicate with the vector of synchrophasors measured at time . In particular, includes the voltage magnitude , phase , frequency and ROCOF . The system schematic for the synchrophasor generation module can be found in the upper portion of Figure 1. The baseline version of ATmega2560 mounts a 10-bit Analog to Digital Converter (ADC), which is used to sample the AC signals. The accuracy of the sampling timing is extremely important as any irregularity can undermine the successful computation of the power indicators in . The sampling is controlled by an Interrupt Service Routine (ISR), which detects the rising edges of Pulse-Width Modulation (PWM) signals. PWM signals are generated by a GPS Digital Oscillator (GPSDO), implemented within the ATmega2560. The main function of the GPSDO is to generate predefined, equidistant pulses synchronized with the detection of 1 pulse per second (PPS) from the ZOE-M8Q GPS module by means of an ISR. Thus, a Hz PWM signal generated by the GPSDO will lead to a Hz sampling by the ADC, which is enough to run a 32-point Discrete Fourier Transform (DFT) on a Hz signal. Different rates can be used to sample power signals at a different nominal frequency. For example, a frequency of Hz would require a sampling rate of Hz.
The GPS module, connected to the ATmega2560 over interface, is used to maintain an accurate time synchronization. Fresh timing data is requested from the GPS at the start of every second, marked by the rising edge of the 1 PPS signal. The time between subsequent PPS peaks is calculated using internal timers of the micro-controller rendering an accuracy of 1 s for time-stamping. The primary reason for limiting timing requests to once per second only is due to the hardware limitations of the GPS module. The time-stamp of a given generated phasor is denoted by .
As already indicated, a -PMU must be able to measure the frequency and calculate the ROCOF of the AC signal. For that purpose, a sine to square wave converter circuit with a step down transformer is implemented, similarly to what was done in [29]. The AC signal is fed into the the circuit and the output is a square wave with voltage ranging from 0 V to 3 V. Another ISR is used to keep track of the rising edges of the square wave to calculate the time difference between two consecutive rising edges, which represents the period of the signal. The frequency is then calculated as the reciprocal of the period. The ROCOF was computed as , as shown in [37].
A 32-point DFT is used for estimating the magnitude and phase of the AC signal. A 32-element buffer is updated as soon as a new sample is generated by the ADC, which is controlled by the PWM signal from the GPSDO. A counter keeps track of the number of samples and as soon as it reaches 32, DFT is run. The power signal sampling and the subsequent computation correspond to the first step of the Synchrophasor generation phase, displayed on the timeline in Figure 2. The second step in this phase is represented by the transmission (using the interface) of synchrophasor to the ATmega328P, which is responsible for the wireless transmission to the PDC node.
III-B Communication module
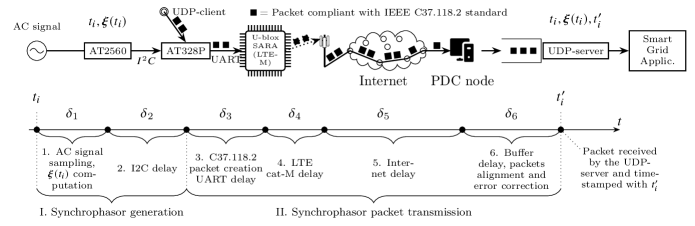
Figure 2 illustrates the workflow related to synchrophasor frames, represented here by black squares, from their creation in the ATmega328P device to their reception at the UDP-server hosted in the PDC node, which is represented by a laptop connected to the Internet. In particular, in the upper portion of the figure, we have a system schematic with the different components included in the testbed: they appear from left to right according to their sequential use in the workflow. In the bottom part of Figure 2, it is possible to observe a timeline representing the two main phases in the workflow, i.e., I. synchrophasor generation and II. synchrophasor frame transmission, and the six required steps. The first two steps (included in Phase I) take place within the the Arduino ATmega2560 and were extensively described in the previous section. In order to perform the third and fourth steps (i.e., frame creation and frame transmission, respectively), we have used an ATmega328P, which is connected to the ATmega2560 over interface. This interface between the synchrophasor generation module and the communication module is also visible in Figure 1.
Once a synchrophasor is computed and timestamped with time , the next step is to incorporate it in a frame, which corresponds to step 3 in Figure 2. In this work, we are following the IEEE C37.118.2 standard [3], whose main structure is shown in Figure 3: the frame size for a single phase system is 26 bytes and for a 3-phase system is 42 bytes. These values are related to a scenario with fixed 16-bit formats. Among the frame fields, it is worth highlighting: (i) the Second of Century (SOC) and Fraction of Second (FRACSEC), which represent the time-stamp, (ii) PHASORS, which includes the estimated magnitude and phase of the monitored AC signal; (iii) FREQ, representing the operating frequency, and (iv) DFREQ, which represents the ROCOF indicator. The last field CHK is a checksum used for burst error detection according to the Cyclic Redundancy Check (CRC) technique [3]. Further details on the IEEE C37.118.2 frame structure can be found in [3, 1].
As shown in Figure 2, the transport protocol we used for the transmission of the synchrophasor frames is UDP, which assures low overhead and low latency communication as opposed to TCP, which is more suitable for reliable data transfers. A Python-based UDP client application was implemented in the ATmega328P to transmit synchrophasor frames and a Python-based UDP server was deployed at the PDC node to receive and collect these frames. Once synchrophasor frames are created, they are sent to the U-blox SARA module for thansmission over LTE cat-M. Frame creation and transmission over UART interface to the network module correspond to step 3 in Figure 2. The U-blox SARA module is then used to transmit frames to the LTE cat-M eNodeB (step 4). Frames are then transmitted over the Internet (step 5) until reaching the PDC node, where they are realigned444With UDP, frames can be received out-of-order. and eventual errors are corrected using CRCs (step 6). Frames are finally received by the UDP server, which adds a time-stamp (i.e., ). Received frames can be then used in a broad range of smart grid applications, as discussed in Section I. The time stamp is used in the end-to-end delay analysis provided in the next section.
III-C End-to-end delay and data analysis
Once frames are received by the UDP server, they can be used to evaluate network performance and analyze the synchrophasor data. One of the most important parameters to evaluate network performance (and assess the suitability of LTE cat-M for synchrophasor transmission) is the end-to-end delay, hereafter denoted as , which is defined as the time elapsed from , when is generated, to , when is received. Therefore, we have that . In Figure 2, it is shown that the reception time is computed at the PDC, after the frame is correctly received by the UDP-server. However, in order to have meaningful and consistent values for and , the two devices measuring them, i.e., ATmega2560 and the laptop, respectively, need to be accurately synchronized. In order to achieve high precision synchronization, we used an NTP server, which is synchronized with the the same GPS satellite used by our ZOE-M8Q GPS module.
As shown in Figure 2, consists of the sum of the delays for each of the six steps, denoted by with : In particular, represents the time needed to sample the power signal and compute ; represents the time needed to transmit from the ATmega2560 to the ATmega328P over interface; represents the time to create a frame and transmit it over the UART interface to the LTE cat-M card; and represent the network delay; represents the buffer delay, i.e., the time needed to sort frames that are received at the PDC not in the correct order.

III-D Overview of LTE cat-M technology
[38] CAT-NB1 CAT-M1 CAT-1 LoRa Peak Data Rate 27.2/62.5 kb/s (DL/UL) 375 kb/s (DL/UL) 10/5 Mb/s (DL/UL) 20 Kb/s (DL/UL) Radio Spectrum 180 KHz 1.4 MHz 20 MHz 125 KHz Latency 1.5-10 s 100-150 ms 50-100 ms High (Device Dependent) Max. Coupling Loss 164 dB 155.7 dB - 165 dB Tx Power 46dBm/23dBm (DL/UL) 43dBm/23dBm (DL/UL) 23dBm (DL/UL) 27dBm (DL/UL) Noise Figure 9dB/5dB (DL/UL) 5dB/3dB (DL/UL) 5dB (DL/UL) 9dB (DL/UL) Number of antennas 1 1 2 1 VoLTE support No Yes Yes No Power Consumption LOW LOW HIGH LOW
The synchrophasors , generated according to the mechanisms described in sections III-A and III-B, need to be transmitted over a wireless network. In light of a steep increase of distributed generation elements to be integrated in the power distribution grid, a cheap and easy-to-install cellular IoT network is a good candidate to support this kind of high rate and small size communications. The main alternatives in the cellular IoT technologies are LTE cat-M and NB-IoT[39, 40]. Other communication technologies like LoRa and LTE CAT-1 should also be part of the discussion. The main reason behind not considering LTE CAT-1 for this application was the high power consumption and the main area where it excels, high data rate is not a requirement. On the other hand LoRa is highly power efficient but its low data rate and high latency makes it an in-viable option. A comparison between the standards is shown in Table II. LTE cat-M was preferred over NB-IoT thanks to lower latency, higher peak data rate, and better coverage [41]. LTE cat-M is a low-power wide-area (LPWA) air interface that enables connection between IoT and M2M devices with medium data rate requirements. It can support up-link and down-link speeds of 375 kb/s in half duplex mode which is ideal for IoT applications requiring a low to medium data rate [42]. Another benefit of LTE-M is "frequency hopping" among LTE sub-carriers making LTE-M more resistant to fading, interference as well as network congestion issues [43]. For this work, we use a commercial LTE cat-M network from a US-based carrier to transmit the synchrophasor data generated with the AT-mega2560.
IV Experimental Results
In this section, experimental results on the generation of synchrophasors and on the performance of the proposed communication solution are reported.
IV-A Synchrophasor generation
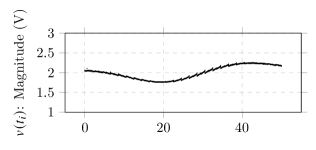
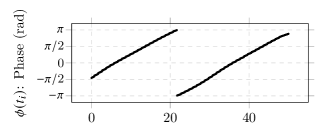
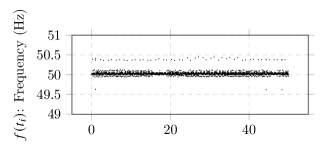
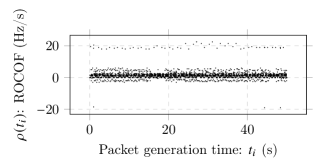
Experimental results were obtained with the AC signal generator yielding a power signal with nominal values for magnitude and frequency of V and Hz, respectively. Synchrophasors are computed and reported at a rate of frames/s and the obtained values are shown in Figure 4. This figure includes, from the top to the bottom, magnitude , phase , frequency and ROCOF , obtained in a s experiment.
The frequency plot, depicted in Figure LABEL:sub@fig:Fre, shows that fluctuates around the nominal value of Hz. These fluctuations can have several causes, such as imperfections in the signal generator device or in the sine to square wave converter circuit described in Section III-A. In particular, the AC signal generator could operate at a frequency . As previously identified in [29], this fluctuation leads to incorrect DFT computation, whose sampling frequency is based on , and causes (i) a fluctuation in the magnitude as a sinusoidal at a frequency , as shown in Figure LABEL:sub@fig:Mag, and (ii) a “saw-tooth” behaviour of the phase , confirmed by Figure LABEL:sub@fig:Pha, where keeps on growing from to when . Since is predominantly ( of the observed values) greater than (see Figure LABEL:sub@fig:Pha), we can notice a similar trend to a sinusoidal in the magnitude plot in Figure LABEL:sub@fig:Mag and the expected saw-tooth behaviour in the phase plot in Figure LABEL:sub@fig:Pha. , computed as [37], has a similar trend to (Figure LABEL:sub@fig:ROCOF). This analysis shows the capability of the deployed -PMU to estimate magnitude, phase, and frequency of a voltage waveform. In the remainder of this section, we provide a detailed analysis of the experimental LTE cat-M network performance results.
IV-B Network performance
Network performance is extremely important to assess the feasibility of the proposed synchrophasor sensing and communication framework and to understand how to use the generated synchrophasor data. In this section, we carry out a detailed analysis of relevant network Key Performance Indicators, such as the delay and jitter. The delay has components , as discussed in Section III-C. From our experimental results, and last less than 1 ms, whereas takes on average 1 to 2 ms. is equal to zero for almost all the synchrophasor frames in our experiments. Therefore, in what follows, we will focus on the LTE cat-M delay and on the Internet delay, which correspond to and , respectively.
As was illustrated in Figure 2, synchrophasors are reported using an UDP socket: the client is located in the AT328P, and transmits the synchrophasors at a fixed rate ; the server is running at a laptop, connected to the Internet through a DSL router and an Ethernet cable. The server functionally represents the PDC and is in charge of receiving the frames containing synchrophasor data, realign them, compensate for errors in the communication: these data are then available to be analyzed and used, as an example, for control and monitoring applications. Moreover, as previously mentioned, the PDC must compute the delay , which represents the time elapsed from the moment is generated, i.e., , and the time instant when is received at the destination, i.e., . These delay values are stored at the laptop hosting the UDP server for post-processing and data analysis. The inter-transmission time between consecutive frames, hereafter denoted as , can be easily computed as .
In Table III, statistics on the delay obtained with our experimental setup are provided for different values of reporting rate , ranging from to frames/s. The most common values for are and frames/s, however we decided to test the communication system with a broad range of reporting rates in order to gain a deeper insight on the suitability of LTE cat-M for a wide variety of smart grid applications. In Table III, we included minima and maxima, standard deviations, first and third quartiles (i.e., and ), jitters, 95%-confidence intervals of the true mean of the delay and frame loss. The average value of the delay, which can be found in the last column on the right, ranges from ms, obtained with frames/s, to ms, obtained with frames/s. It is worth pointing out that no frame loss or performance degradation is observed when the reporting rate grows. From this observation, it can be inferred that LTE cat-M is able to successfully and promptly deliver synchrophasor frames being transmitted at rates of at least up to frames per second. It is also worth highlighting that the standard deviation is very small, ranging from to ms, which also translates into narrow confidence intervals. The main source of variability in the delay , as it will become evident in the rest of the analysis, comes from the access portion .
| Report. rate (frames/s) | Delay (ms) | |||||||
|---|---|---|---|---|---|---|---|---|
| min | max | st.d. | Q1 | Q3 | jitter | 95%-CI | Fr. Loss | |
| 1 | 145.37 | 201.17 | 20.19 | 147.22 | 187.29 | 40.02 | 0% | |
| 10 | 136.14 | 231.89 | 22.47 | 156.29 | 196.16 | 30.03 | 0% | |
| 50 | 138.47 | 514.56 | 18.34 | 159.93 | 184.75 | 19.61 | 0% | |
| 60 | 136.69 | 246.34 | 17.96 | 157.33 | 188.12 | 18.36 | 0% | |
| 80 | 132.97 | 226.44 | 17.05 | 148.86 | 177.91 | 14.14 | 0% | |
| PMU num. | Delay (ms) | |||||||
|---|---|---|---|---|---|---|---|---|
| min | max | st.d. | Q1 | Q3 | jitter | 95%-CI | Fr. Loss | |
| 1 | 123.84 | 550 | 56.10 | 148.28 | 183.99 | 20.23 | 0% | |
| 2 | 138.65 | 330 | 41.92 | 166.19 | 199.35 | 25.54 | 0% | |
| 3 | 136.46 | 651 | 49.65 | 162.04 | 195.07 | 22.5 | 0% | |
| Frame Size (bytes) | Delay (ms) | Loss | ||||||
|---|---|---|---|---|---|---|---|---|
| min | max | st.d. | Q1 | Q3 | jitter | 95%-CI | ||
| 26 (1-Phase) | 138.47 | 514.56 | 18.34 | 159.93 | 184.75 | 19.61 | 0% | |
| 42 (3-Phase) | 160.64 | 293.08 | 14.61 | 182.20 | 204.73 | 16.83 | 0.2% | |
| 52 (2x) | 164.11 | 259 | 17.29 | 158.9 | 183 | 31.67 | 0.6% | |
| 78 (3x) | 168.14 | 367.62 | 20.37 | 195.96 | 226.41 | 30.14 | 3.3% | |
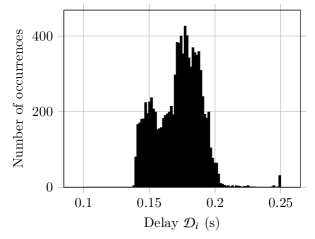
The distribution of the delay obtained with frames/s is shown in Figure 5. Delays are distributed in the interval between 140 and 250 ms, even though approximately % of frames is received within ms. The maximum value of ms, reported in Table III, is not shown in the distribution graph as it is a single value obtained in the first frame transmission (due to to the time needed to establish the connection), which makes it irrelevant to the network performance analysis. These results further corroborates the finding that LTE cat-M is a suitable communication solution to transmit synchrophasor data.
A multi-PMU setup and framesize variation were also considered as a part of the analysis. Table IV depicts the frame statistics of a 3 PMU setup which transmits simultaneously at . The 95%-confidence interval of the delay as well as the frame loss is consistent with the results obtained before. Table V shows the impact of frame size variation on the frame statistics, where single phase (26 bytes), 2x single phase (52 bytes), 3x single phase (78 bytes) and 3-Phase (42 bytes) frames were considered. We observed that an increase in the frame size corresponds to increased frame losses. However, the delay is not majorly impacted and, as indicated by the 95% CI, stays consistently within the 140-250ms range.
Further insight into the network performance can be gained analyzing Figure 6, which displays how the delay evolves with respect to the transmission time in a scenario with Hz. In the s observation window reported in this figure, it is possible to notice that the delays are not uniformly distributed in the range between ms and 200 ms but are concentrated in the vicinity of , , , and ms. A zoom with the delay of 12 consecutive synchrophasor frames is depicted in a box on top of Figure 6. A pattern is identified for each group of four consecutive synchrophasor frames, whose delay decreases from the first to the last. In particular, in each group, the first frame is received with a delay of around ms, the second with a delay of around ms, the third with a delay of around ms, and the fourth and last with a delay of around ms. This behaviour is observed throughout the whole experiment with synchrophasors per second.
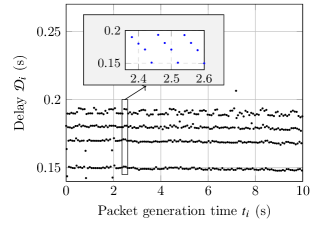
In order to explain the reason for such a pattern in the observed delays, it is important to consider the mechanism used to allocate radio resources in LTE cat-M networks. In particular, before each frame transmission, the UE must send a scheduling request control message to the eNodeB, and must wait for a scheduling grant, which indicates the time and frequency resources to be used for frame transmission. However, scheduling grants are transmitted, along with other data, in the system information (SI) with a periodicity that depends on the network parameter si-WindowLength-BR-r13, which could range from ms to ms [44]. In the commercial network used to obtain our results, this parameter is equal to ms. In the scenario at hand, we have a reporting rate frames/s, which leads to an inter-departure time ms. Therefore, 4 frames are expected to be transmitted between two consecutive SI frames. In each 4-frame group, the delay decreases from the first to the last due to decreasing waiting time until the following SI transmission.
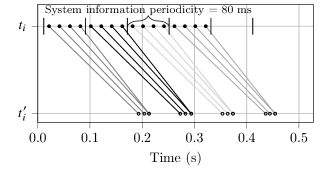
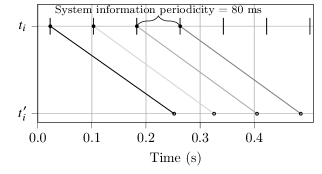
To better visualize this effect, in Figure 7, we have reported the generation time and the reception time for a number of consecutive synchrophasor frames. It is worth highlighting that is very close to the transmission time of synchrophasor frame, as , and are negligible, as discussed in Section III-C. Note also that each synchrophasor frame is represented by a segment with the starting point in the -timeline at the top and the ending point in the -timeline at the bottom. For the experiment with frames/s, groups of 4 frames are observed in Figure LABEL:sub@fig:PV_50, and the segments representing frames in the same group are drawn with the same color in the gray scale. It is worth highlighting the differences in time-distributions of frame transmissions (represented by filled circles on the top timeline) and of the frame receptions (represented by empty circles on the bottom timeline): frame transmission times are equally spaced by ms, whereas the reception times of frames in the same group are just a few ms apart. It is also possible to note that the delay of frames in each group decreases from the first, which has the longest waiting time to the following SI transmission, to the last one, which is the one with the lowest waiting time to the following SI transmission. In Figure LABEL:sub@fig:PV_12, a similar plot was generated for a scenario with frames/s, where a considerably more regular distribution of frame arrival times can be observed. This is due to the fact that frames are transmitted at an inter-departure time of ms, which is equal to the SI periodicity parameter: this means that frames wait, on average, the same time before being transmitted over LTE cat-M.
V Conclusions
In this paper, we presented research on the experimental deployment of a -PMU device and an analysis of the feasibility of using the LTE cat-M network to support high-rate data collection from these devices. A functional prototype of a -PMU was deployed using simple hardware, such as Arduino micro-controllers and GPS antennas. The deployed -PMU was equipped with a wireless card to transmit over an LTE cat-M commercial network.
A wide variety of reporting rates for synchrophasor data (i.e., 1 to 80 frames/s) was considered in order to represent the traffic generated by a broad range of potential smart grid use cases, such as protection and control applications, state estimation, and outage management. Synchrophasor data were generated in compliance with the widely adopted IEEE C37.118.2 standard.
A detailed LTE cat-M network performance analysis was carried out, with average delays below ms in all the considered scenarios, making LTE cat-M particularly suitable to support this type of traffic. Finally, the effects of network parameters, such as the system information periodicity, on the network performance was studied. It was shown that this parameter considerably affects the time distribution of the frame arrivals, which is strikingly different from the periodic distribution of the frame generations.
Acknowledgment
The authors would like to thank Adarsh Govindarajan for his help with the deployment of the sine to square wave converter circuit.
References
- [1] “IEEE guide for phasor data concentrator requirements for power system protection, control, and monitoring,” IEEE Std C37.244-2013, pp. 1–65, 2013.
- [2] C. Brunner, “IEC61850 for power system communication,” in 2008 IEEE/PES Transmission and Distribution Conference and Exposition. IEEE, 2008, pp. 1–6.
- [3] “IEEE standard for synchrophasor data transfer for power systems,” IEEE Std C37.118.2-2011 (Revision of IEEE Std C37.118-2005), pp. 1–53, 2011.
- [4] A. von Meier, EStewart, A.McEachern, M.Andersen, and L.Mehrmanesh, “Precision micro-synchrophasors for distribution systems: A summary of applications,” IEEE Transactions on Smart Grid, vol. 8, no. 6, pp. 2926–2936, 2017.
- [5] N. Duan and E. M. Stewart, “Frequency event categorization in power distribution systems using micro PMU measurements,” IEEE Transactions on Smart Grid, vol. 11, no. 4, pp. 3043–3053, 2020.
- [6] “Synchrophasors for Distribution, Microgrids: PQube 3 MicroPMU.” [Online]. Available: http://www.jsdata.co.kr/down/MicroPMU_Cat.pdf
- [7] Power Standards Lab, “Introduction to microPMU,” Sept. 2017. [Online]. Available: https://www.powerstandards.com/wp-content/uploads/dlm_uploads/2017/10/Introduction-to-microPMU.pdf
- [8] A. Borghetti, R. Bottura, M. Barbiroli, and C. A. Nucci, “Synchrophasors-based distributed secondary voltage/var control via cellular network,” IEEE Transactions on Smart Grid, vol. 8, no. 1, pp. 262–274, 2017.
- [9] A. Derviškadić, P. Romano, M. Pignati, and M. Paolone, “Architecture and experimental validation of a low-latency phasor data concentrator,” IEEE Transactions on Smart Grid, vol. 9, no. 4, pp. 2885–2893, 2016.
- [10] F. Malandra, R. Pourramezan, H. Karimi, and B. Sansò, “Impact of PMU and smart meter applications on the performance of LTE-based smart city communications,” in 2018 IEEE 29th Annual International Symposium on Personal, Indoor and Mobile Radio Communications (PIMRC). IEEE, 2018, pp. 1–6.
- [11] R. Samoilenko, N. Accurso, and F. Malandra, “A simulation study on the impact of iot traffic in a smart-city lte network,” in 2020 IEEE 31st Annual International Symposium on Personal, Indoor and Mobile Radio Communications, 2020, pp. 1–6.
- [12] N. Accurso, N. Mastronarde, and F. Malandra, “Exploring tradeoffs between energy consumption and network performance in cellular-iot: a survey,” in 2021 IEEE Global Communications Conference (GLOBECOM), 2021, pp. 01–06.
- [13] S. Uddin, O. Krause, and D. Martin, “Energy management for distribution networks through capacity constrained state optimization,” IEEE Access, vol. 5, pp. 21 743–21 752, 2017.
- [14] J. Romero Aguero, D. Novosel, E. Bernabeu, B. Chiu, J. Liu, V. Rabl, T. Pierpoint, D. Houseman, B. Enayati, and S. Kolluri, “Managing the new grid: Delivering sustainable electrical energy,” IEEE Power and Energy Magazine, vol. 17, no. 4, pp. 75–84, 2019.
- [15] H. Mohsenian-Rad, E. Stewart, and E. Cortez, “Distribution synchrophasors: Pairing big data with analytics to create actionable information,” IEEE Power and Energy Magazine, vol. 16, no. 3, pp. 26–34, May 2018.
- [16] W. K. Chai, N. Wang, K. V. Katsaros, G. Kamel, G. Pavlou, S. Melis, M. Hoefling, B. Vieira, P. Romano, S. Sarri, T. T. Tesfay, B. Yang, F. Heimgaertner, M. Pignati, M. Paolone, M. Menth, E. Poll, M. Mampaey, H. H. I. Bontius, and C. Develder, “An information-centric communication infrastructure for real-time state estimation of active distribution networks,” IEEE Transactions on Smart Grid, vol. 6, no. 4, pp. 2134–2146, 2015.
- [17] Q. Yang, L. Jiang, W. Hao, B. Zhou, P. Yang, and Z. Lv, “PMU-placement in electric transmission networks for reliable state estimation against false data injection attacks,” IEEE Internet Things J. (USA), vol. 4, no. 6, pp. 1978 – 86, 2017/12/. [Online]. Available: http://dx.doi.org/10.1109/JIOT.2017.2769134
- [18] M. Pignati, M. Popovic, S. Barreto, R. Cherkaoui, G. Dario Flores, J. Le Boudec, M. Mohiuddin, M. Paolone, P. Romano, S. Sarri, T. Tesfay, D. Tomozei, and L. Zanni, “Real-time state estimation of the epfl-campus medium-voltage grid by using PMUs,” in 2015 IEEE Power Energy Society Innovative Smart Grid Technologies Conference (ISGT), 2015, pp. 1–5.
- [19] H. Gharavi and B. Hu, “Scalable synchrophasors communication network design and implementation for real-time distributed generation grid,” IEEE Transactions on Smart Grid, vol. 6, no. 5, pp. 2539–2550, 2015.
- [20] R. H. Khan and J. Y. Khan, “Wide area PMU communication over a WiMAX network in the smart grid,” in 2012 IEEE Third International Conference on Smart Grid Communications (SmartGridComm), 2012, pp. 187–192.
- [21] R. Pourramezan, Y. Seyedi, H. Karimi, G. Zhu, and M. Mont-Briant, “Design of an advanced phasor data concentrator for monitoring of distributed energy resources in smart microgrids,” IEEE Transactions on Industrial Informatics, vol. 13, no. 6, pp. 3027–3036, 2017.
- [22] R. Pourramezan, H. Karimi, J. Mahseredjian, and M. Paolone, “Real-time processing and quality improvement of synchrophasor data,” IEEE Transactions on Smart Grid, vol. 11, no. 4, pp. 3313–3324, 2020.
- [23] R. Pourramezan, H. Karimi, M. Paolone, and J. Mahseredjian, “Optimal coordination of phasor data concentrators in hierarchical synchrophasor networks,” IEEE Transactions on Industrial Informatics (to appear), 2020.
- [24] F. Malandra, L. Chiquette, L.-P. Lafontaine-Bédard, and B. Sansò, “Traffic characterization and LTE performance analysis for M2M communications in smart cities,” Pervasive and Mobile Computing, vol. 48, pp. 59–68, 2018. [Online]. Available: https://www.sciencedirect.com/science/article/pii/S1574119217306089
- [25] F. Malandra, S. Rochefort, P. Potvin, and B. Sansò, “A case study for M2M traffic characterization in a smart city environment,” in Proceedings of the 1st International Conference on Internet of Things and Machine Learning, ser. IML ’17. New York, NY, USA: Association for Computing Machinery, 2017. [Online]. Available: https://doi.org/10.1145/3109761.3109809
- [26] L. Zhu and J. Lin, “Learning spatio-temporal correlations for missing noisy PMU data correction in smart grid,” IEEE Internet of Things Journal, 2020. [Online]. Available: http://dx.doi.org/10.1109/JIOT.2020.3040195
- [27] “GridTrak - Home Page.” [Online]. Available: http://www.gridtrak.com/
- [28] “OpenPMU.” [Online]. Available: http://www.openpmu.org/home
- [29] D. Mohapatra, “Development and hardware implementation of a phasor measurement unit using microcontroller,” Mtech dessertation, National Institute Of Technology, Rourkela, India., 1996.
- [30] M. Elsaadany, A. Ali, and W. Hamouda, “Cellular LTE-A technologies for the future internet-of-things: Physical layer features and challenges,” IEEE Communications Surveys Tutorials, vol. 19, no. 4, pp. 2544–2572, 2017.
- [31] P. Masek, M. Stusek, K. Zeman, R. Drapela, A. Ometov, and J. Hosek, “Implementation of 3GPP LTE Cat-M1 technology in NS-3: System simulation and performance,” in 2019 11th International Congress on Ultra Modern Telecommunications and Control Systems and Workshops (ICUMT), 2019, pp. 1–7.
- [32] R. Ratasuk, N. Mangalvedhe, D. Bhatoolaul, and A. Ghosh, “LTE-M evolution towards 5G massive MTC,” in 2017 IEEE Globecom Workshops (GC Wkshps). IEEE, 2017, pp. 1–6.
- [33] P. Hsieh, Y. Jia, D. Parra, and P. Aithal, “An experimental study on coverage enhancement of LTE Cat-M1 for machine-type communication,” in 2018 IEEE International Conference on Communications (ICC), 2018, pp. 1–5.
- [34] G. A. Medina-Acosta, Y.-P. E. Wang, O. Liberg, J. Bergman, and A. Eriksson, “Uplink sub-PRB resource allocation for Rel-15 LTE-M,” in 2019 IEEE 90th Vehicular Technology Conference (VTC2019-Fall). IEEE, 2019, pp. 1–5.
- [35] S. Dawaliby, A. Bradai, and Y. Pousset, “In depth performance evaluation of LTE-M for M2M communications,” in 2016 IEEE 12th International Conference on Wireless and Mobile Computing, Networking and Communications (WiMob). IEEE, 2016, pp. 1–8.
- [36] D. Schofield, F. Gonzalez-Longatt, and D. Bogdanov, “Design and implementation of a low-cost phasor measurement unit: A comprehensive review,” in 2018 Seventh Balkan Conference on Lighting (BalkanLight), 2018, pp. 1–6.
- [37] G. Frigo, A. Derviškadić, Y. Zuo, and M. Paolone, “PMU-Based ROCOF Measurements: Uncertainty Limits and Metrological Significance in Power System Applications,” IEEE Transactions on Instrumentation and Measurement, vol. 68, no. 10, pp. 3810–3822, 2019.
- [38] S. Dawaliby, A. Bradai, and Y. Pousset, “In depth performance evaluation of lte-m for m2m communications,” 2016 IEEE 12th International Conference on Wireless and Mobile Computing, Networking and Communications (WiMob), pp. 1–8, 2016.
- [39] J. Chen, K. Hu, Q. Wang, Y. Sun, Z. Shi, and S. He, “Narrowband internet of things: Implementations and applications,” IEEE Internet of Things Journal, vol. 4, no. 6, pp. 2309–2314, 2017.
- [40] Y. Li, X. Cheng, Y. Cao, D. Wang, and L. Yang, “Smart choice for the smart grid: Narrowband Internet of Things (NB-IoT),” IEEE Internet of Things Journal, vol. 5, no. 3, pp. 1505–1515, 2018.
- [41] Z. Hegde, “CAT-M1 vs NB-IoT – examining the real differences,” Available athttps://www.iot-now.com/2016/06/21/48833-cat-m1-vs-nb-iot-examining-the-real-differences (2016-06-21).
- [42] “LTE-M,” Available at https://www.u-blox.com/en/blogs/innovation/why-lte-cat-m1-and-lte-cat-nb1-make-perfect-sense-gas-water-and-heat-metering (2018-02-16).
- [43] T. Kosiło, K. Radecki, J. Marski, and C. Górski, “Mobile iot systems in the urban area,” International Journal of Electronics and Telecommunications, vol. 66, no. 1, pp. 179–185, 2020.
- [44] 3GPP, “Evolved Universal Terrestrial Radio Access (E-UTRA); Radio Resource Control (RRC); Protocol specification,” 3rd Generation Partnership Project (3GPP), Technical Specification (TS) 36.331, 2019, version 15.10.0. [Online]. Available: ftp://www.3gpp.org/specs/archive/36_series/36.331/