Frictional weakening of vibrated granular flows
Abstract
We computationally study the frictional properties of sheared granular media subjected to harmonic vibration applied at the boundary. Such vibrations are thought to play an important role in weakening flows, yet the independent effects of amplitude, frequency, and pressure on the process have remained unclear. Based on a dimensional analysis and DEM simulations, we show that, in addition to a previously proposed criterion for peak acceleration that leads to breaking of contacts, weakening requires the absolute amplitude squared of the displacement is sufficiently large relative to the confining pressure. The analysis provides a basis for predicting flows subjected to arbitrary external vibration and demonstrates that a previously unrecognized second process that is dependent on dissipation contributes to shear weakening under vibrations.
Recent years have seen dramatic advances in predictive constitutive laws for steady flows of dense granular media da Cruz et al. (2005); MiDi (2004); Jop et al. (2006), which are dominated by a Coulomb-like static friction coefficient Bingham (1917); Drucker and Prager (1952). Moreover, arises primarily from anisotropic, system-spanning contact networks Peyneau and Roux (2008); Radjai et al. (2012) that can be long-range correlated near the yield criterion Thompson and Clark (2019), leading to interesting nonlocal effects Bocquet et al. (2009); Kamrin and Koval (2012); Henann and Kamrin (2013) and avalanche-type behavior Dahmen et al. (2011). The persistence of these mesoscale contact networks, often called “force chains,” during slow shear is predicated on the inherently dissipative nature of grain-grain interactions Jaeger et al. (1996); Radjai et al. (1997), which arises from plasticity at individual contacts.
Vibrations, which can be externally applied Melosh (1979, 1996); Dijksman et al. (2011); Taslagyan et al. (2015) or generated by the flow itself van der Elst et al. (2012); Taylor and Brodsky (2017); DeGiuli and Wyart (2017); Taylor and Brodsky (2020), inject energy into the system, disrupting these contact networks and reducing . Vibrations have been studied in granular pattern formation Melo et al. (1994); Umbanhowar et al. (1996), compaction (Nowak et al., 1998), structural ordering Pica Ciamarra et al. (2007a, b), clogging Caitano et al. (2021), and dense suspension rheology Garat et al. (2022), but their impact on the resistance of shear flows has been underexplored. Seminal theoretical work (Melosh, 1979) and limited experiments (Dijksman et al., 2011) have addressed parts of the problem, but the lack of a predictive framework for steady shear flows under vibration represents a significant gap in our understanding of a wide array of systems, including earthquakes, landslides, the results of impacts on asteroids, and the ability of the pharmaceutical industry to mass produce medication.
In this letter, we use discrete-element method (DEM) simulations to systematically study the frictional properties of sheared, vibrated granular media. We vary amplitude and frequency of applied vibrations, as well as grain and other system properties. We find that previously proposed criteria based on contact breaking are insufficient to predict frictional weakening; the amplitude must also exceed a critical value that varies with pressure and grain-grain energy dissipation. Thus, in addition to contact breaking, the competition between vibration (energy injection) and dissipative grain-grain interactions plays a crucial role. We also find that frictional weakening stops when the frequency exceeds the elastic response frequency of the grains. Our results serve as the basis of a constitutive law that could be used to predict more complex steady flows subject to arbitrary external vibration.
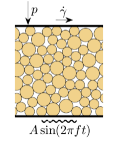
The fundamental question we consider is: when do vibrations of amplitude and frequency cause frictional weakening, i.e., to decrease significantly? We begin with a dimensional analysis of simple shear of a granular system subjected to such vibration, as in Fig. 1(a). The shear rate is imposed by moving the top wall, and the normal stress is imposed by applying a fixed external force per area to the top wall. is the average force per area required to maintain . Grains properties include diameter , mass density , elastic modulus , the restitution coefficient , and surface friction coefficient , and possibly others (e.g., shape). Neglecting vibration, five dimensionless groups are necessary to characterize such a system: the material friction coefficient , inertial number , dimensionless pressure , , and . If is small enough to be irrelevant, then, for fixed and , we can write , which can often be well approximated by , where is the static friction coefficient (Jop et al., 2006; da Cruz et al., 2005) and varies with Favier de Coulomb et al. (2017); Srivastava et al. (2021).
(a) (b)
(c)
 (d)
(d)
Including and requires two more dimensionless numbers. We choose and , which is the ratio of , the peak acceleration from the vibration, to , the acceleration resulting from the applied normal stress. Experiments by Dijksman et al. (2011) on vibration of a sheared granular bed with a free surface (using the gravitational acceleration instead ) found that when , corresponding to when the vibrated bottom wall will lose contact with the particles, allowing them to rearrange. has also been used in a variety of other systems Umbanhowar et al. (1996); Caitano et al. (2021); Garat et al. (2022). At high , the dimensionless number becomes relevant as the ratio of to the elastic frequency of grains.
The classic theory of Melosh (1979), which has been heavily utilized in the geophysical sciences (Collins and Melosh, 2003; Johnson et al., 2016), proposed that fluidization occurs when the peak acoustic pressure exceeds the confining pressure , i.e., , breaking grain-grain contacts. In an elastic wave, peak pressure can be written as Halliday et al. (1992), where is a wave speed and . Thus, the condition in terms of the parameters of this paper is . Like the framework, acoustic fluidization uses a single criterion related to contact breaking. Neither framework is set up to disentangle the independent effects of and and thus neither can uncover other criteria or processes. Other work has noted that additional parameters are likely necessary in other vibrated flows (Caitano et al., 2021), but none have clarified what the correct approach might be for the geologically important situation of shear flows.
We implement a vibrating shear flow using DEM simulations using LAMMPS Thompson et al. (2022). These simulations involve simple shear of an assembly of spherical grains via the motion of a top wall with imposed vibrations at the bottom wall, as depicted in 2D in Fig. 1(a). The horizontal dimensions are both periodic with length . Our results are insensitive to the system size and aspect ratio, which we verify by changing and as illustrated in Supplemental Material for Supplemental Material . This means our results are not primarily due to vibrational resonance based on or the ability of phonons to propagate across the system.
Grain-grain forces consist of a normal repulsive term, characterized by spring constant , and a viscoelastic damping force for normal contacts, characterized by damping coefficient that is related to a normal restitution coefficient Shäfer et al. (1996); for Supplemental Material . We focus on frictionless particles in the main text. In the Supplemental Material for Supplemental Material , we include grain-grain friction via the Cundall-Strack Cundall and Strack (1979) approach, as well as 2D simulations with bumpy particles Papanikolaou et al. (2013); Clark et al. (2017). We also show data for Hertzian contacts. In this paper we focus on the robust results that are qualitatively similar results for all cases, regardless of spatial dimension, friction, force law, or grain shape. Grain diameters are normally distributed with mean and standard deviation of . Top and bottom walls are rough, created via rigid assemblies of the same particles used in the flow, to ensure a no-slip boundary between the wall and the granular assembly. The wall-grain forces are computed as the sum of forces between wall particles and particles in the flow. We approximate via forces on the walls, which neglects second-order effects related to normal stress difference; these are very small, especially for frictionless particles at low inertial number, as shown by Srivastava et al. (2021).
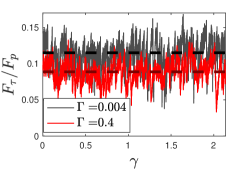
We impose a confining (downward) force on the top wall as well as a horizontal velocity ; motion of the wall in the third dimension is not allowed. We measure the total horizontal force on the wall due to all wall-grain contacts. After initial transients have decayed, fluctuates around a constant value, as shown in Fig. 1(b). For each simulation, we measure as the average, steady-state friction coefficient. The height fluctuates around an average value , and we measure the strain rate and thereby the inertial number . We do not allow the lower wall to move except for an imposed vertical harmonic displacement with amplitude and frequency .
The output of each simulation is as a function of , , , , and . Figure 1(b) shows results from two typical simulations with differing . As expected, is lower for larger . We observe very little dilation for all results we show here, i.e., does not vary strongly with or . The time step is 100 times smaller than the time scale for a grain-grain collision (see Supplemental Material for Supplemental Material ), which is sufficient to resolve vibration frequencies for . We also verify that the vibrations imposed on the bottom traverse the system by measuring their perturbation on the top wall (Figure 1(b)). Because of the large shear and correspondingly large number of samples in the mean values reported for each simulation, uncertainty estimates based on bootstrap resampling (Efron, 1982) are between 0.1 and 0.5%. This uncertainty is smaller than the symbols here and in the remainder of the figures.
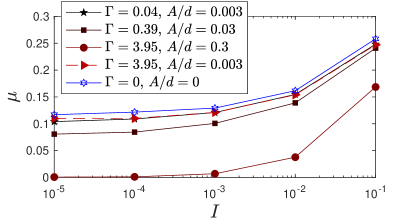
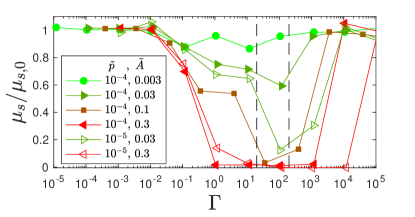
Figure 1(c) investigates the shear rate-dependent friction by measuring curves with , , and varied and (including ). For each curve, is roughly constant for , corresponding to . All measurements of use , and we verify with selected simulations at that we are in the slow-shear limit. With , , as expected for frictionless spheres Peyneau and Roux (2008); Thompson and Clark (2019). For the remainder of the paper, we denote as the friction coefficient in the limit of low inertial number and no applied vibration (e.g., for stiff, frictionless spheres, ).
The results in Fig. 1(c) demonstrate that frictional weakening cannot be predicted from alone. For three curves, we keep constant frequency and increase amplitude, and decreases as and increase, as expected. However, an additional -curve with the largest value of but a higher and lower results in friction similar to the low- result.
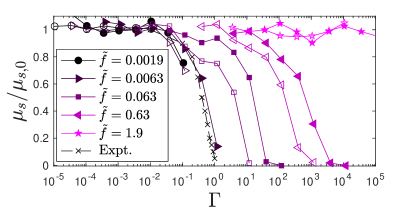
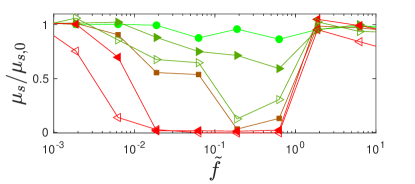
Additional support for the need for multiple parameters, and thus multiple mechanisms, to describe vibrational weakening comes from Fig. 1(d), which shows the normalized friction as a function of with held constant and increased from to 0.3. The low- simulations are an excellent match to the experimental data from Dijksman et al. (2011). However, as and are varied, the value of where transitions to zero varies dramatically, over more than three orders of magnitude. As in Figure 1(c) variations cannot be mapped simply as a function of . For , no weakening occurs since exceeds the elastic frequency of the grains. The significant dependence on , and requires a more complete description of both the parameters and the physics.
(a)
(b)
When we vary by varying and holding fixed, a clearer picture emerges, as shown in Fig. 2. Figure 2(a) again shows the normalized friction as a function of for sheared, vibrated, frictionless spheres with , but with each curve having a fixed and only the frequency varied. For , all curves have . For , we find begins decreasing in a way that depends on and . Thus, always corresponds to no frictional weakening. We also observe no frictional weakening at very high ; Fig. 2(b) demonstrates that this is due to
However, and are still not sufficient to predict frictional weakening; must be also large enough. This indicates an additional process at play. Perhaps the amplitude needs to be large enough to induce sufficient rearrangements to disrupt the force network. Weakening will not occur if these amplitudes are not high enough for a given , regardless of . We now consider how varies with and at fixed .
(a)
(b) (c)
(d) (e)
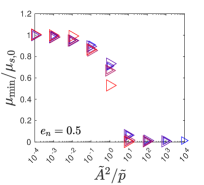
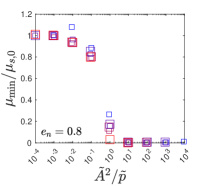
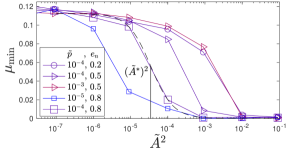
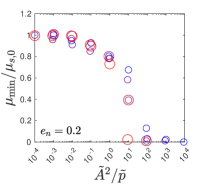
We measure as lowest value of between the dashed lines shown in Fig. 2(a), i.e., . This definition is selected so as to keep fixed throughout the comparison. We repeat all simulations for and and find very similar results to those shown in Fig. 2. Figure 3(a) shows curves of versus for different combinations of and . For small , , and decreases from to 0 at a characteristic value of , denoted , that depends on and .
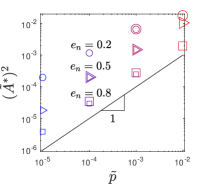
We estimate by fitting a sigmoid-like curve to the data in Fig. 3(a) to extract as the value where . Figure 3(b) shows that . Best fits give near 1 for all three values of : , , and for , 0.5, and 0.2, respectively, where the data point with is disregarded for . We assume , and the fact that may be due to additional contacts leading to more dissipation at higher pressure. This is consistent with the deviation at especially for the highest pressure; future analysis may provide some further insight. Decreasing corresponds to higher at fixed , meaning more vibration amplitude is required at higher dissipation rates for frictional weakening to occur. Figure 3(c), (d), and (e) show as a function of for all three values of . These plots show a reasonable data collapse with decreasing to 0 for of approximately for , for , and for . This significant variation with highlights the crucial role of grain-grain dissipation.
Our results can be summarized in the phase diagram shown in Fig. 4. As in prior work, when contacts can be broken, but the current simulations show that large corresponds to frictional weakening only when is large. The magnitude of required depends on , since more amplitude at the boundary is required to give individual grains sufficient vibrational energy to disrupt the contact network and reduce . This dependence on can be seen in Fig. 4 at, e.g., , . The controlling parameter might be interpreted as the ratio of a force scale related to the amplitude of the vibration coupled to the particle stiffness, , to a characteristic force on a particle due to the confining pressure, . Future work may shed further light on the interpretation of this criterion.
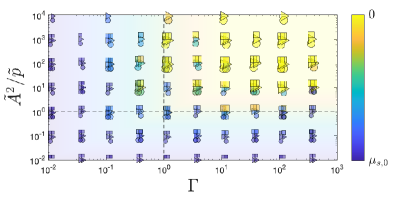
Importantly, the phase diagram shows that prior work based on a single criterion could overpredict fluidization in geologically relevant situations. For instance, in the nearfield of an impact or shallow fault zone, a wave with a frequency of 10 Hz and amplitude 1 mm can interact with sand-sized particles with with mm and GPa at pressure 0.25 MPa, corresponding to 10 m depth. These reasonable values correspond to and . This is far in the upper left quadrant of Fig. 4, where no fluidization would occur. However, the fluidization condition of Melosh (1979) would predict fluidization, since , which is greater than the threshold of 1. Practical applications of acoustic fluidization theory to observations have adjusted the acoustic wavelength (and hence frequency) to match observations where independent constraints are not possible (Riller et al., 2018). Our results may be useful in reconsidering such inferences, as well as in other situations where weakening is experimentally observed due to acoustic excitation van der Elst et al. (2012); Lu et al. (2007).
In summary, we find that frictional weakening requires both sufficiently high acceleration and amplitude, appropriately normalized. The acceleration criterion () can be attributed to a need to break individual contacts as noted by many prior works (Melosh, 1979; Dijksman et al., 2011). The amplitude criterion () shows the need for an additional process that is sensitive to the degree of dissipation, which provides an important clue. Dissipation is required to maintain the mesoscale network structures or “force chains” during shear (Jaeger et al., 1996; Radjai et al., 1997; Wolf et al., 1998). These structures are known to control the macroscopic frictional properties of granular media Peyneau and Roux (2008); Azéma and Radjaï (2014). Thus we speculate that the amplitude criterion relates to the disruption of these structures. Simple contact breaking is not sufficient if the latent mesoscale structure is preserved; sufficiently large amplitude is required to break them up. The lack of inclusion of this amplitude criterion results in an overprediction of frictional weakening. More importantly, the recognition of an additional process positions the field to investigate the correct criteria to determine the efficacy of frictional weakening in some of nature’s most important granular flows.
Acknowledgements.
We gratefully acknowledge funding from Army Research Office under grants W911NF1510012 and W911NF2220044 and the Office of Naval Research under grant N0001419WX01519. We also thank Jeffrey Haferman and Bruce Chiarelli for help with high-performance computing at NPS and the Ship Engineering and Analysis Technology Center for help with high-performance computing at NSWC Carderock.References
- da Cruz et al. (2005) F. da Cruz, S. Emam, M. Prochnow, and F. Roux, J.-N.and Chevoir, “Rheophysics of dense granular materials: Discrete simulation of plane shear flows,” Phys. Rev. E 72, 021309 (2005).
- MiDi (2004) GDR MiDi, “On dense granular flows,” Eur. Phys. J. E 14, 341–365 (2004).
- Jop et al. (2006) P. Jop, Y. Forterre, and O. Pouliquen, “A constitutive law for dense granular flows,” Nature 441, 727–730 (2006).
- Bingham (1917) Eugene Cook Bingham, An investigation of the laws of plastic flow, 278 (US Government Printing Office, 1917).
- Drucker and Prager (1952) Daniel Charles Drucker and William Prager, “Soil mechanics and plastic analysis or limit design,” Quarterly of applied mathematics 10, 157–165 (1952).
- Peyneau and Roux (2008) P.-E. Peyneau and J.-N. Roux, “Frictionless bead packs have macroscopic friction, but no dilatancy,” Phys. Rev. E 78, 011307 (2008).
- Radjai et al. (2012) F. Radjai, J.-Y. Delenne, E. Azéma, and S. Roux, “Fabric evolution and accessible geometrical states in granular materials,” Granular Matter 14, 259–264 (2012).
- Thompson and Clark (2019) J. D. Thompson and A. H. Clark, “Critical scaling for yield is independent of distance to isostaticity,” Phys. Rev. Research 1, 012002 (2019).
- Bocquet et al. (2009) L. Bocquet, A. Colin, and A. Ajdari, “Kinetic theory of plastic flow in soft glassy materials,” Phys. Rev. Lett. 103, 036001 (2009).
- Kamrin and Koval (2012) K. Kamrin and G. Koval, “Nonlocal constitutive relation for steady granular flow,” Phys. Rev. Lett. 108, 178301 (2012).
- Henann and Kamrin (2013) D. L Henann and K. Kamrin, “A predictive, size-dependent continuum model for dense granular flows,” Proc. Natl. Acad. Sci. 110, 6730–6735 (2013).
- Dahmen et al. (2011) K. A Dahmen, Y. Ben-Zion, and J. T. Uhl, “A simple analytic theory for the statistics of avalanches in sheared granular materials,” Nature Physics 7, 554–557 (2011).
- Jaeger et al. (1996) H. M. Jaeger, S. R. Nagel, and R. P. Behringer, “Granular solids, liquids, and gases,” Reviews of Modern Physics 68, 1259 (1996).
- Radjai et al. (1997) F. Radjai, D. E. Wolf, S. Roux, M. Jean, and J. J. Moreau, “Force networks in dense granular media,” in Powders & grains 97 (1997) pp. 211–214.
- Melosh (1979) H. J. Melosh, “Acoustic fluidization: A new geologic process?” J. Geophysical Research 84, 7513–7520 (1979).
- Melosh (1996) H. J. Melosh, “Dynamical weakening of faults by acoustic fluidization,” Nature 379, 601–606 (1996).
- Dijksman et al. (2011) Joshua A. Dijksman, Geert H. Wortel, Louwrens T. H. van Dellen, Olivier Dauchot, and Martin van Hecke, “Jamming, yielding, and rheology of weakly vibrated granular media,” Phys. Rev. Lett. 107, 108303 (2011).
- Taslagyan et al. (2015) K. A. Taslagyan, D. H. Chan, and N. R. Morgenstern, “Effect of vibration on the critical state of dry granular soils,” Granular Matter 17, 687–702 (2015).
- van der Elst et al. (2012) N. J. van der Elst, E. E. Brodsky, P.-Y. Le Bas, and P. A. Johnson, “Auto-acoustic compaction in steady shear flows: Experimental evidence for suppression of shear dilatancy by internal acoustic vibration,” J. Geophys. Res. 117 (2012).
- Taylor and Brodsky (2017) S. Taylor and E. E. Brodsky, “Granular temperature measured experimentally in a shear flow by acoustic energy,” Phys. Rev. E 96, 032913 (2017).
- DeGiuli and Wyart (2017) E. DeGiuli and M. Wyart, “Friction law and hysteresis in granular materials,” Proceedings of the National Academy of Sciences 114, 9284–9289 (2017).
- Taylor and Brodsky (2020) SE Taylor and EE Brodsky, “Reversible compaction in sheared granular flows and its significance for nonlocal rheology,” Geophys. Res. Lett. 47, e2020GL087137 (2020).
- Melo et al. (1994) Francisco Melo, Paul Umbanhowar, and Harry L Swinney, “Transition to parametric wave patterns in a vertically oscillated granular layer,” Physical review letters 72, 172 (1994).
- Umbanhowar et al. (1996) P. B. Umbanhowar, F. Melo, and H. L. Swinney, “Localized excitations in a vertically vibrated granular layer,” Nature 382, 793–796 (1996).
- Nowak et al. (1998) E. R. Nowak, J. B. Knight, E. Ben-Naim, H. M. Jaeger, and S. R. Nagel, “Density fluctuations in vibrated granular materials,” Physical Review E 57, 1971–1982 (1998).
- Pica Ciamarra et al. (2007a) M Pica Ciamarra, A Coniglio, D De Martino, and M Nicodemi, “Shear-and vibration-induced order-disorder transitions in granular media,” The European Physical Journal E 24, 411–415 (2007a).
- Pica Ciamarra et al. (2007b) Massimo Pica Ciamarra, Mario Nicodemi, and Antonio Coniglio, “Granular packs under vertical tapping: Structure evolution, grain motion, and dynamical heterogeneities,” Phys. Rev. E 75, 021303 (2007b).
- Caitano et al. (2021) R. Caitano, B. V. Guerrero, R. E. R. González, I. Zuriguel, and A. Garcimartín, “Characterization of the clogging transition in vibrated granular media,” Phys. Rev. Lett. 127, 148002 (2021).
- Garat et al. (2022) C. Garat, S. Kiesgen de Richter, P. Lidon, A. Colin, and G. Ovarlez, “Using good vibrations: Melting and controlled shear jamming of dense granular suspensions,” Journal of Rheology 66, 237–256 (2022).
- Favier de Coulomb et al. (2017) A. Favier de Coulomb, M. Bouzid, P. Claudin, E. Clément, and B. Andreotti, “Rheology of granular flows across the transition from soft to rigid particles,” Phys. Rev. Fluids 2, 102301 (2017).
- Srivastava et al. (2021) I. Srivastava, L. E Silbert, G. S. Grest, and J. B. Lechman, “Viscometric flow of dense granular materials under controlled pressure and shear stress,” J. Fluid Mech. 907 (2021).
- Collins and Melosh (2003) Gareth S Collins and H Jay Melosh, “Acoustic fluidization and the extraordinary mobility of sturzstroms,” Journal of Geophysical Research: Solid Earth 108 (2003).
- Johnson et al. (2016) Brandon C Johnson, Charles S Campbell, and H Jay Melosh, “The reduction of friction in long runout landslides as an emergent phenomenon,” Journal of Geophysical Research: Earth Surface 121, 881–889 (2016).
- Halliday et al. (1992) D. Halliday, R. Resnick, and K.S. Krane, Physics, Volume 1 (Wiley, New York, 1992).
- Thompson et al. (2022) A. P. Thompson, H. M. Aktulga, R. Berger, D. S. Bolintineanu, W. M. Brown, P. S. Crozier, P. J. in ’t Veld, A. Kohlmeyer, S. G. Moore, T. D. Nguyen, R. Shan, M. J. Stevens, J. Tranchida, C. Trott, and S. J. Plimpton, “LAMMPS - a flexible simulation tool for particle-based materials modeling at the atomic, meso, and continuum scales,” Comp. Phys. Comm. 271, 108171 (2022).
- (36) Placeholder for Supplemental Material, .
- Shäfer et al. (1996) J. Shäfer, S. Dippel, and D. E. Wolf, “Force schemes in simulations of granular materials,” J. phys., I 6, 5–20 (1996).
- Cundall and Strack (1979) P. A. Cundall and O. D. L. Strack, “A discrete numerical model for granular assemblies,” Géotechnique 29, 47–65 (1979).
- Papanikolaou et al. (2013) S. Papanikolaou, C. S. O’Hern, and M. D. Shattuck, “Isostaticity at frictional jamming,” Physical review letters 110, 198002 (2013).
- Clark et al. (2017) A. H. Clark, M. D. Shattuck, N. T. Ouellette, and C. S. O’Hern, “Role of grain dynamics in determining the onset of sediment transport,” Phys. Rev. Fluids 2, 034305 (2017).
- Efron (1982) Bradley Efron, The jackknife, the bootstrap and other resampling plans (SIAM, 1982).
- Riller et al. (2018) Ulrich Riller, Michael H Poelchau, Auriol SP Rae, Felix M Schulte, Gareth S Collins, H Jay Melosh, Richard AF Grieve, Joanna V Morgan, Sean PS Gulick, Johanna Lofi, et al., “Rock fluidization during peak-ring formation of large impact structures,” Nature 562, 511–518 (2018).
- Lu et al. (2007) K Lu, E E Brodsky, and HP Kavehpour, “Shear-weakening of the transitional regime for granular flow,” Journal of Fluid Mechanics 587, 347–372 (2007).
- Wolf et al. (1998) D. E. Wolf, F. Radjai, and S. Dippel, “Dissipation in granular materials,” Philos. mag., B 77, 1413–1425 (1998).
- Azéma and Radjaï (2014) Emilien Azéma and Farhang Radjaï, “Internal structure of inertial granular flows,” Phys. Rev. Lett. 112, 078001 (2014).