Lyman alpha and Lyman continuum emission of Mg ii-selected star-forming galaxies
Abstract
We present observations with the Cosmic Origins Spectrograph onboard the Hubble Space Telescope of seven compact low-mass star-forming galaxies at redshifts, , in the range 0.3161 – 0.4276, with various O3Mg2 = [O iii] 5007/Mg ii 2796+2803 and Mg2 = Mg ii 2796/Mg ii 2803 emission-line ratios. We aim to study the dependence of leaking Lyman continuum (LyC) emission on the characteristics of Mg ii emission together with the dependencies on other indirect indicators of escaping ionizing radiation. LyC emission with escape fractions (LyC) = 3.1 – 4.6 per cent is detected in four galaxies, whereas only 1 upper limits of (LyC) in the remaining three galaxies were derived. A strong narrow Ly emission line with two peaks separated by 298 – 592 km s-1 was observed in four galaxies with detected LyC emission and very weak Ly emission is observed in galaxies with LyC non-detections. Our new data confirm the tight anti-correlation between (LyC) and found for previous low-redshift galaxy samples. remains the best indirect indicator of LyC leakage among all considered indicators. It is found that escaping LyC emission is detected predominantly in galaxies with Mg2 1.3. A tendency of an increase of (LyC) with increasing of both the O3Mg2 and Mg2 is possibly present. However, there is substantial scatter in these relations not allowing their use for reliable prediction of (LyC).
keywords:
(cosmology:) dark ages, reionization, first stars — galaxies: abundances — galaxies: dwarf — galaxies: fundamental parameters — galaxies: ISM — galaxies: starburst1 Introduction
It was established during last decade that Lyman continuum (LyC) emission, which is produced in copious amount in both the high redshift star-forming galaxies (SFGs) at 2 - 4 (Vanzella et al., 2015; de Barros et al., 2016; Shapley et al., 2016; Bian et al., 2017; Vanzella et al., 2018; Rivera-Thorsen et al., 2019; Saha et al., 2020; Meštric et al., 2020; Vielfaure et al., 2020; Fletcher et al., 2019; Marchi et al., 2017, 2018; Steidel et al., 2018) and the low-redshift SFGs at 0.4 (Leitet et al., 2013; Borthakur et al., 2014; Leitherer et al., 2016; Chisholm et al., 2017; Izotov et al., 2016a, b, 2018a, 2018b, 2021a; Flury et al., 2022a, b; Xu et al., 2022), can escape from the galaxies resulting in ionization of the intergalactic medium (IGM). These galaxies are considered as analogues of the galaxies at redshifts 6 - 8, which are presumably the main sources of the reionization of the Universe (Ouchi et al., 2009; Wise & Chen, 2009; Yajima, Choi & Nagamine, 2011; Mitra, Ferrara & Choudhury, 2013; Bouwens et al., 2015; Finkelstein et al., 2019; Lewis et al., 2020; Naidu et al., 2020; Meyer et al., 2020).
It was also found that (LyC) in many discovered galaxies is of the order of 10 - 20 per cent or higher. This could be sufficient for efficient reionization of the IGM at 6 (e.g. Ouchi et al., 2009; Robertson et al., 2013, 2015; Dressler et al., 2015; Khaire et al., 2016).
Direct LyC observations of high-redshift galaxies are difficult because of their faintness, the increasing of IGM opacity, and contamination by lower-redshift interlopers (e.g. Vanzella et al., 2010, 2012; Inoue et al., 2014; Grazian et al., 2016). Furthermore, the knowledge of the galaxy H or H luminosity is needed to derive the production rate of ionizing photons and thus the (LyC). This is not possible yet for most of high- LyC emitters. Low-redshift galaxies are brighter, but observations from space, with the aid of Hubble Space Telescope (HST), are needed for the detection of LyC emission in 0.3 galaxies. This can be done only for limited samples of low- galaxies. On the other hand, the H and H emission lines can easily be observed in low- galaxies from the ground. In fact, many such galaxies were observed in the course of the Sloan Digital Sky Survey (SDSS). This survey was succesfully used to select promising LyC leaking candidates and their subsequent observations with the HST (this paper, Izotov et al., 2016a, b, 2018a, 2018b, 2021a; Wang et al., 2021; Flury et al., 2022a; Xu et al., 2022).
Due to difficulties of direct detection of LyC emission in both the high- and low-redshift SFGs indirect indicators for the determination of the (LyC) can be used. However, at present, it cannot be very reliably determined from most indicators due to the large scatter in their correlations with (LyC).
The shape of the Ly line can be considered as the prime indicator of the (LyC) value, since it depends on the distribution of the neutral hydrogen around the galaxy, which also determines the escape of ionizing radiation (e.g. Verhamme et al., 2015). In most galaxies with the Ly emission line it has a two-peak shape due to scattering in the neutral gas with a relatively high column density of H i, with a weaker blue peak and a stronger red peak. The offset of the peaks from the line centre serves as a measure of the neutral hydrogen optical depth along the line of sight (e.g. Verhamme et al., 2015). In particular, a tight correlation between the Ly blue and red peak separation and the escape fraction of ionizing radiation was found (Izotov et al., 2018b). More complex Ly profiles with three or more peaks are rarely observed (Vanzella et al., 2018; Izotov et al., 2018b; Rivera-Thorsen et al., 2017, 2019). They show significant central line emission, an indication of direct escape through porous channels in addition to escape via scattering. In these cases the separation of the Ly emisson peaks is a poor tracer of (LyC) because of a combination of two distinct modes of Ly escape (Naidu et al., 2022). We also note that at redshifts 6 the detection of Ly is difficult because of declining Ly transmission with redshift (Gronke et al., 2021). This decline with redshift is sharper on the blue side of Ly making it more difficult to detect the blue peak.
| Name | R.A.(2000.0) | Dec.(2000.0) | a | b | 12+logO/Hc | EW(H)d | O32e | O3Mg2f | Mg2g | |
|---|---|---|---|---|---|---|---|---|---|---|
| J01300014 | 01:30:32.37 | 00:14:32.52 | 0.31606 | 1664 | 961 | 7.970.02 | 200 | 7.40.4 | 100 | … |
| J01410304 | 01:41:42.85 | 03:04:51.12 | 0.38161 | 2075 | 1087 | 8.060.02 | 220 | 5.60.2 | 151 | 1.620.31 |
| J08445312 | 08:44:57.90 | 53:12:30.11 | 0.42764 | 2374 | 1165 | 8.020.02 | 196 | 4.90.2 | 101 | 2.380.43 |
| J10145501 | 10:14:23.78 | 55:01:43.82 | 0.37297 | 2019 | 1071 | 7.960.02 | 240 | 6.80.4 | 141 | 1.190.28 |
| J11373605 | 11:37:47.77 | 36:05:04.62 | 0.34387 | 1836 | 1017 | 7.810.01 | 280 | 7.40.3 | 222 | 1.530.44 |
| J11575801 | 11:57:44.80 | 58:01:42.69 | 0.35210 | 1887 | 1032 | 7.810.01 | 263 | 9.00.5 | 357 | 0.970.52 |
| J13525617 | 13:52:35.80 | 56:17:01.41 | 0.38818 | 2117 | 1099 | 8.050.03 | 172 | 3.80.2 | 101 | 1.500.26 |
aLuminosity distance in Mpc (NED, Wright, 2006).
bAngular size distance in Mpc (NED, Wright, 2006).
cOxygen abundance derived by the direct method.
dEquivalent width of the H emission line in Å.
eO32 is the extinction-corrected [O iii]5007/[O ii]3727 flux ratio derived in this paper from the SDSS spectrum.
fO3Mg2 is the extinction-corrected [O iii]5007/Mg ii 2796+2803 flux ratio derived in this paper from the SDSS spectrum.
gMg2 is the Mg ii 2796/Mg ii 2803 flux ratio derived in this paper from the SDSS spectrum.
Therefore, other indirect indicators are needed, for example, those, which use strong emission lines in the rest-frame optical and UV ranges, or UV absorption lines, including hydrogen lines of the Lyman series and heavy element lines, such as Si ii 1260 that can measure the Lyman continuum escape fraction (e.g. Gazagnes et al., 2018, 2020; Chisholm et al., 2018; Flury et al., 2022a, b; Saldana-Lopez et al., 2022).
Jaskot & Oey (2013) and Nakajima & Ouchi (2014) proposed to use the O32 = [O iii]5007/[O ii]3727 flux ratio arguing that its high values of up to 60 in some low- galaxies (Stasińska et al., 2015; Izotov, Thuan & Guseva, 2021b) may indicate that the ISM is predominantly ionized, allowing the escape of Lyman continuum photons. Indeed, Izotov et al. (2016a, b, 2018a, 2018b, 2021a) obtained HST/COS observations of compact SFGs at redshifts 0.3 - 0.4 with O32 = 5 - 28 and an escape fraction in the range of 2 - 72 per cent. Although they did find some trend of increasing (LyC) with increasing O32, the dependence is weak, with a large scatter.
It has also been suggested that (LyC) tends to be higher in low-mass galaxies (Wise et al., 2014; Trebitsch et al., 2017). However, Izotov et al. (2018b, 2021a) added low-mass LyC leakers and found rather a relatively weak anti-correlation between (LyC) and stellar mass in a wide range between 107 - 1010 M⊙. A similar correlation is also found in the Low- Lyman Continuum Survey (LzLCS) in Flury et al. (2022b).
| Name | a | log b | log (H)c | d | SFRe | f | g | ||
|---|---|---|---|---|---|---|---|---|---|
| J01300014 | 18.24 | 8.63 | 41.22 | 0.4 | 3.7 | 0.20 | 0.10 | 27 | 118 |
| J01410304 | 19.47 | 9.99 | 42.23 | 2.0 | 36.0 | 0.63 | 0.21 | 30 | 269 |
| J08445312 | 20.79 | 8.18 | 42.07 | 3.8 | 25.3 | 0.54 | 0.19 | 28 | 228 |
| J10145501 | 19.32 | 7.48 | 41.60 | 3.0 | 8.6 | …j | …j | …j | …j |
| J11373605 | 18.46 | 9.17 | 41.99 | 0.3 | 21.1 | 0.46 | 0.19 | 33 | 191 |
| J11575801 | 18.49 | 9.28 | 41.77 | 3.0 | 13.0 | 0.21 | 0.16 | 95 | 163 |
| J13525617 | 19.48 | 9.40 | 41.76 | 2.7 | 12.6 | …j | …j | …j | …j |
aAbsolute FUV magnitude derived from the intrinsic rest-frame SED in mag.
b = is the total stellar mass in M⊙, where and are masses of the young and old stellar population, respectively.
c(H) is the H luminosity corrected for the Milky Way and internal extinction in erg s-1.
d is the starburst age in Myr.
eStar-formation rate corrected for the Milky Way and internal extinction, and escaping LyC radiation in M⊙ yr-1.
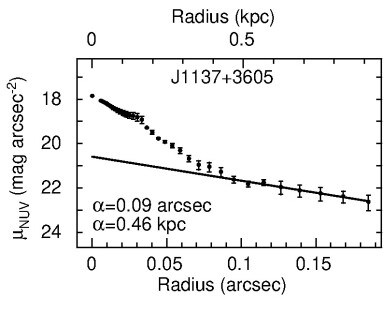
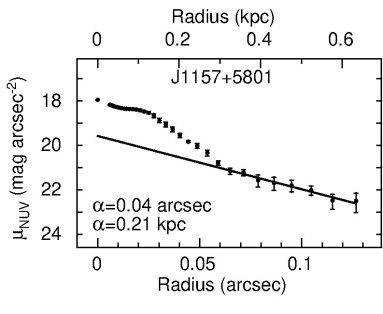
fExponential disc scale length in kpc.
gGalaxy radius, at which NUV intensity is equal to half of maximal intensity, in kpc.
hStar-formation rate surface density assuming galaxy radius is equal to in M⊙ yr-1kpc-2.
iStar-formation rate surface density assuming galaxy radius is equal to in M⊙ yr-1kpc-2.
jAcquisition image not obtained.
Mg ii 2796, 2803 emission may also provide a constraint of the LyC escape and its doublet ratio can be used to infer the neutral gas column density (Henry et al., 2018; Chisholm et al., 2020; Xu et al., 2022; Naidu et al., 2022; Katz et al., 2022). These two lines in emission are commonly seen in the spectra of local compact star-forming galaxies (Guseva et al., 2013, 2019) including LyC leaking galaxies (Chisholm et al., 2020; Guseva et al., 2020) and might be more likely to leak LyC than similar galaxies without strong Mg ii (Xu et al., 2022). They are also detected in 1 - 2 galaxies (Weiner et al., 2009; Erb et al., 2012; Finley et al., 2017; Naidu et al., 2022) and in a 5 star-forming galaxy (Witstok et al., 2021). Henry et al. (2018) found that the Mg ii escape fraction correlates with the Ly escape fraction, and that the Mg ii emission line profiles are broader and more redshifted in galaxies with low escape fractions. They and Chisholm et al. (2020) pointed out that the link between Ly and Mg ii can be used for a LyC diagnostic at high redshifts, where Ly and LyC are difficult to observe. However, Katz et al. (2022) pointed out from the numerical simulations that Mg ii is a useful diagnostic of escaping ionizing radiation only in the optically thin regime.
The goal of this paper is to determine (LyC) for seven low-mass galaxies with various Mg2 = Mg ii 2796/Mg ii 2803 flux ratios and various O3Mg2 = [O iii]5007/Mg ii 2796+2803 flux ratios. The O3Mg2 flux ratios range from 10 to 35 in six galaxies and 100 in one galaxy, where Mg ii emission is almost undetected. We aim to study the dependence of leaking LyC emission on the characteristics of Mg ii emission. We also wish to enlarge the known sample of low-redshift LyC leakers, to search for and to improve reliable diagnostics for the indirect estimation of (LyC). The properties of the selected SFGs derived from observations in the optical range are presented in Section 2. The HST observations and data reduction are described in Section 3. The surface brightness profiles in the UV range are discussed in Section 4. In Section 5, we compare the HST/COS spectra with the extrapolation of the SEDs modelled with the SDSS spectra to the UV range. Ly emission and escaping Lyman continuum emission are discussed in Section 6 together with the corresponding escape fractions. The indirect indicators of escaping LyC emission are considered in Section 7. Mg ii diagnostics are discussed in Section 8. We summarize our findings in Section 9.
| Exposure time (s) | ||||
| Name | Date | (Central wavelength (Å)) | ||
| MIRRORA | G140L | G160M | ||
| J01300014 | 2020-11-20 | 2700 | 5321 | 3550 |
| (800) | (1533) | |||
| J01410304 | 2021-01-18 | 2700 | 5321 | 3560 |
| (800) | (1589) | |||
| J08445312 | 2021-05-18 | 2700 | 5516 | 3932 |
| (800) | (1623) | |||
| J10145501 | 2021-05-14 | 20a | 5711 | 4054 |
| (800) | (1589) | |||
| J11373605 | 2021-02-04 | 2700 | 5437 | 3678 |
| (800) | (1577) | |||
| J11575801 | 2020-10-18 | 2700 | 5705 | 4054 |
| (800) | (1589) | |||
| J13525617 | 2021-02-01 | 20a | 5815 | 4044 |
| (800) | (1623) | |||
aFailed exposure.
2 Integrated properties of selected galaxies
We selected a sample of local compact low-mass SFGs from the SDSS in the redshift range = 0.32 - 0.43 with O3Mg2 in a wide range to observe their Ly and LyC emission with HST/COS. These galaxies are chosen to be sufficiently bright, to have high O32 ratios and high equivalent widths EW(H) of the H emission line. This ensures that a galaxy can be acquired and observed with low- and medium-resolution gratings in one visit, consisting of 4 orbits. Finally we selected a total sample of 7 galaxies with EW(H) 170 Å and O32 4. They are listed in Table 1. All galaxies are nearly unresolved by the SDSS 5-band images and have FWHMs of 1.0 arcsec, so that all the galaxy’s light falls within the 2.5 arcsec diameter COS aperture and within the 2 arcsec diameter SDSS aperture. This ensures that global quantities can be derived from both the UV and optical spectra. We note, however, that Mg ii lines are located in the noisy parts of SDSS spectra and detected with a low signal-to-noise ratio, at least in some galaxies. As such, their fluxes, and especially the Mg ii flux ratio Mg2 = Mg ii 2796/Mg ii 2803 should only be considered tentatively. We note that follow up spectroscopy of these galaxies with high signal-to-noise ratio covering the wavelength range with Mg ii emission will be presented in King et al., in preparation.
The SDSS, GALEX and WISE apparent magnitudes of the selected galaxies are shown in Table 6, indicating that these SFGs are among the faintest low-redshift LyC leaker candidates selected so far for HST observations.
To derive absolute magnitudes and other integrated parameters we adopted luminosity and angular size distances (NASA Extragalactic Database (NED), Wright, 2006) with the cosmological parameters = 67.1 km s-1 Mpc-1, = 0.682, = 0.318 (Ade et al., 2014). These distances are presented in Table 1.
Internal interstellar extinction ()int has been derived from the observed decrement of hydrogen emission lines in the SDSS spectra after correction for the Milky Way extinction with ()MW from the NED, adopting the Cardelli, Clayton & Mathis (1989) reddening law and ()int = 2.7 and ()MW = 3.1. The motivation of the adopted ()int value is following. Izotov et al. (2017) modelled UV FUV and NUV magnitudes of the large sample of SDSS galaxies and found that the FUV magnitudes of galaxies better match the observed magnitudes with ()int = 2.7 if EW(H) 150Å, which is the case for our galaxies, whereas ()int = 3.1 is more appropriate for galaxies with lower EW(H)s. However, we note that in the optical range, which is used for SED fitting, the determination of intrinsic fluxes of the Lyman continuum and of the elemental abundances, extinction does only slightly depend on ()int.
The extinction-corrected emission lines are used to derive ionic and total element abundances following the methods described in Izotov et al. (2006) and Guseva et al. (2013).
The emission-line fluxes () relative to the H flux corrected for both the Milky Way and internal extinctions, the restframe equivalent widths, the Milky Way ((H)MW) and internal ((H)int) extinction coefficients, and extinction-corrected H fluxes are shown in Table 7. It is seen in the Table that the extinction-corrected fluxes of the H, H and H emission lines in all galaxies are consistent within the errors with theoretical recombination values indicating that (H)int is derived correctly.
The fluxes and the direct method are used to derive the physical conditions (electron temperature and electron number density) and the element abundances in the H ii regions. These quantities are shown in Table 8. The derived oxygen abundances are comparable to those in known low-redshift LyC leakers by Izotov et al. (2016a, b, 2018a, 2018b, 2021a). The ratios of the -element (neon and magnesium) abundances to oxygen abundance are similar to those in dwarf emission-line galaxies (e.g. Izotov et al., 2006; Guseva et al., 2013). On the other hand, the nitrogen-to-oxygen abundance ratios in some galaxies are somewhat elevated, similar to those in other LyC leakers at 0.3.
We determine absolute FUV magnitudes from the fluxes of the intrinsic (i.e. extinction-corrected) SEDs at the rest-frame wavelength = 1500 Å, which are reddened adopting extinction derived from the observed decrement of hydrogen Balmer lines. The attenuations are, on average, similar to the ones for other 0.3 - 0.4 LyC leakers and the are similar as observed at high-redshift.
The H luminosities (H) and the corresponding star-formation rates, SFR, were obtained from the extinction-corrected H fluxes, using the relation from Kennicutt (1998) for the SFR and adopting (H)/(H) from Table 7. SFRs are increased by a factor 1/[1 (LyC)] to take into account the escaping ionizing radiation which is discussed later. The SFRs corrected for escaping LyC radiation are shown in Table 2. They are somewhat below the range of 14 - 80 M⊙ yr-1 for the other LyC leakers studied by Izotov et al. (2016a, b, 2018a, 2018b, 2021a).
We use the SDSS spectra of our LyC leakers to fit the SED in the optical range and derive their stellar masses. The fitting method, using a two-component model with a young burst and older continuosly formed stellar population, is described for example in Izotov et al. (2018a, b). Spectral energy distributions of instantaneous bursts in the range between 0 and 10 Gyr with evolutionary tracks of non-rotating stars by Girardi et al. (2000) and a combination of stellar atmosphere models (Lejeune, Buser & Cuisiner, 1997; Schmutz, Leitherer & Gruenwald, 1992) are used to produce the integrated SED for each galaxy. The star formation history is approximated by a young burst with a randomly varying age in the range 10 Myr, and a continuous star formation for older ages between times and , randomly varying in the range 10 Myr - 10 Gyr, and adopting a constant SFR. The contribution of the two components is determined by randomly varying the ratio of their stellar masses, = /, in the range 0.1 - 1000, where and are the masses of the old and young stellar populations.
The nebular continuum emission, including free-free and free-bound hydrogen and helium emission, and two-photon emission, is also taken into account using the observed H flux (i.e. not corrected for escaping LyC emission), the ISM temperature, and density. The fraction of nebular continuum emission in the observed spectrum near H is determined by the ratio of the observed H equivalent width EW(H)obs, shifted to the rest frame, to the equivalent width EW(H)rec for pure nebular emission. EW(H)rec varies from 900 Å to 1100 Å, for electron temperatures in the range = 10000 - 20000 K. We note that non-negligible nebular emission in the continuum is produced only by the young burst with ages of a few Myr.
The Salpeter (1955) initial mass function (IMF) is adopted, with a slope of 2.35, upper and lower mass limits and of 100 M⊙ and 0.1 M⊙, respectively. Izotov et al. (2016a) compared differences in SEDs obtained with two different IMFs, by Salpeter (1955) and Kroupa (2001). They concluded that the effect is minor. A 2 minimization technique was used 1) to fit the continuum in such parts of the restframe wavelength range 3600 - 6500 Å, where the SDSS spectrum is least noisy and free of nebular emission lines, and 2) to reproduce the observed H and H equivalent widths.
3 HST/COS observations and data reduction
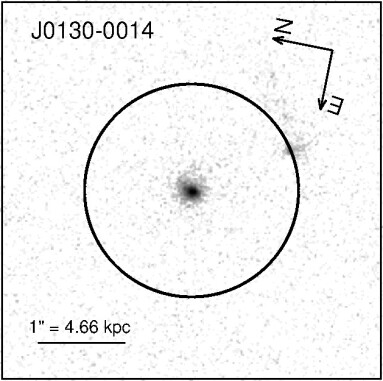
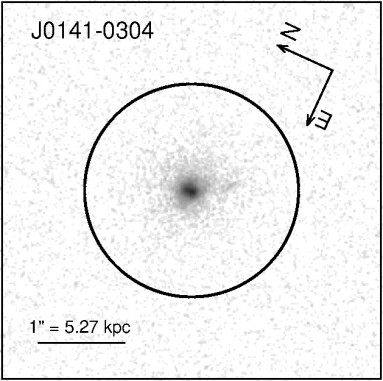
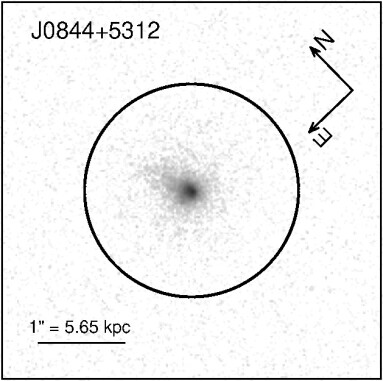
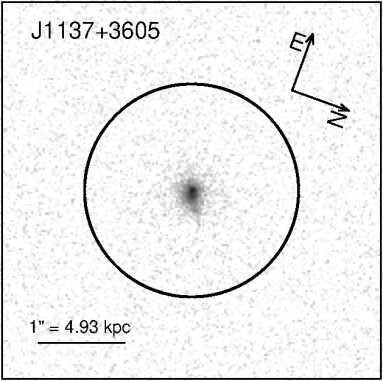
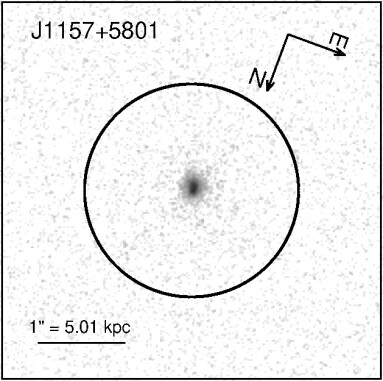
HST/COS spectroscopy of the seven selected galaxies was obtained in program GO 15845 (PI: Y. I. Izotov) during the period October 2020 – May 2021. The observational details are presented in Table 3. As in our previous programs (Izotov et al., 2016a, b, 2018a, 2018b, 2021a), the galaxies were directly acquired by COS near ultraviolet (NUV) imaging. All these galaxies are compact (as compact as all the other targets from our previous programs) and they have accurate SDSS astrometry for direct imaging acquisition. The NUV-brightest region of each target was centered in the 2.5 arcsec diameter spectroscopic aperture (Fig. 1). We note, however, that the acquisition exposure failed for J10145501 and J13525617 due to guide star acquisition failure in both cases because the acquisition of the guide stars was delayed. This is a frequent HST gyro issue. For safety reasons, the shutter remained closed and no acquisition image was obtained. Therefore, both galaxies were blindly acquired. The blind acquisition accuracy is 0.3 arcsec, which will result in very modest vignetting for a compact galaxy, possibly introducing uncertainties in the wavelength and flux calibration in the partially vignetted COS aperture. For J13525617 the vignetting is negligible, because the COS spectrophotometric magnitude (FUV mag) agrees well with the GALEX FUV mag. For J10145501 the spectrophotometry (FUV mag) is still consistent with the GALEX magnitude (FUV mag), considering the significant Eddington bias for the latter. The wavelength calibration was confirmed with Lyman series absorption lines of the galaxies.
The spectra were obtained with the low-resolution grating G140L and medium-resolution grating G160M, applying all four focal-plane offset positions. The 800 Å setup was used for the G140L grating (sensitive wavelength range 1100–1950 Å, resolving power at 1150 Å) to include the redshifted LyC emission for all targets. We obtained resolved spectra of the galaxies’ Ly emission lines with the G160M grating ( at 1600 Å), varying the G160M central wavelength with galaxy redshift to cover the emission line and the nearby continuum on a single detector segment.
The individual exposures were reduced with the calcos pipeline v3.3.10, followed by accurate background subtraction and co-addition as required for our Poisson-limited data with FaintCOS v1.09 (Makan et al., 2021). We used the same methods and extraction aperture sizes as in Izotov et al. (2018a, b, 2021a) to achieve a homogeneous reduction of the galaxy sample observed in multiple programmes.We corrected for scattered geocoronal Ly according to Worseck et al. (2016). The accuracy of our custom correction for scattered light in COS G140L data was checked by comparing the LyC fluxes obtained in the total exposure and in orbital night, respectively. We find that the differences in LyC fluxes for five galaxies are less or similar to the 1 errors. Due to insufficient time spent in orbital night, this check was not possible for J11575801 and J13525617. However, we verified that the detected LyC flux of J13525617 (Section 6) is insignificantly affected by residual uncertainties in the G140L scattered light model.
4 Acquisition images and surface brightness profiles in the NUV range
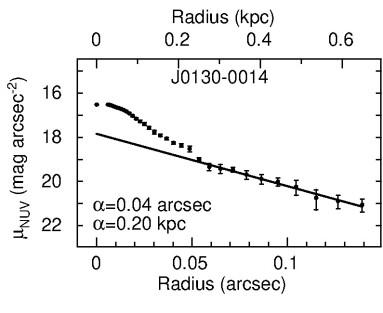
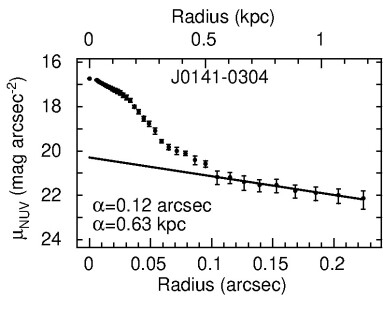
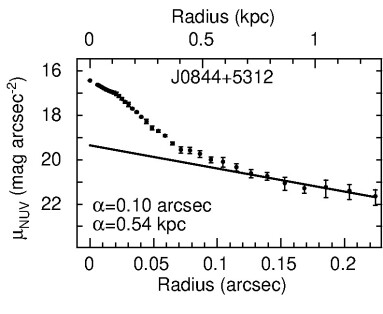
The acquisition images of five galaxies in the NUV range are shown in Fig. 1. All galaxies are very compact with angular diameters considerably smaller than the COS spectroscopic aperture (the circles in Fig. 1) and linear diameters of 1 – 4 kpc. However, two of the most compact galaxies, J01300014 and J11575801, appear to be non-leaking LyC galaxies, whereas LyC emission is detected in the remaining three galaxies with more extended envelopes (see Section 6). We use these images to derive the surface brightess (SB) profiles of our galaxies, in accordance with previous studies by Izotov et al. (2016b, 2018a, 2018b, 2021a). No SB profiles have been derived for galaxies J10145501 and J13525617 because their acquisition exposures failed, as noted before. In accordance with Izotov et al. (2016b, 2018a, 2018b, 2021a) we have found that the outer parts of our galaxies are characterised by a linear decrease in SB (in mag per square arcsec scale), characteristic of a disc structure, and by a sharp increase in the central part due to the bright star-forming region (Fig. 2). The scale lengths of our galaxies, defined in Eq. 1 of Izotov et al. (2016b), are in the range 0.2 – 0.6 kpc (Fig. 2), lower than = 0.6 – 1.8 kpc in other LyC leakers (Izotov et al., 2016b, 2018a, 2018b), but similar to scale lengths of low-mass LyC leakers with masses 108 M⊙ (Izotov et al., 2021a). The corresponding surface densities of star-formation rate in the studied galaxies, = SFR/(), are similar to those of other LyC leakers. The half-light radii of our galaxies in the NUV are considerably smaller than because of the bright compact star-forming regions in the galaxy centres (see Table 2).
5 Modelled spectral energy distributions in the UV range
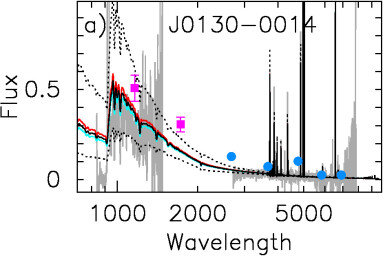
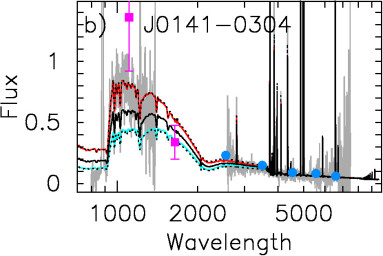
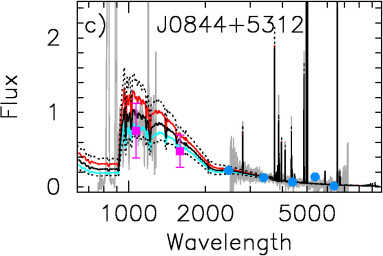
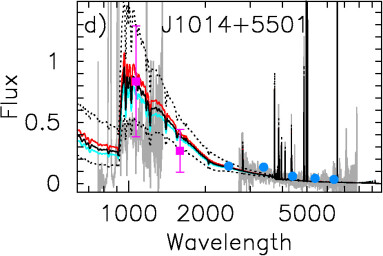
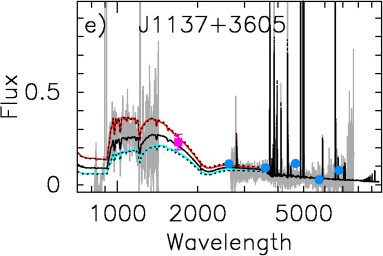
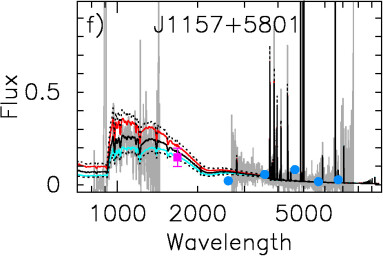
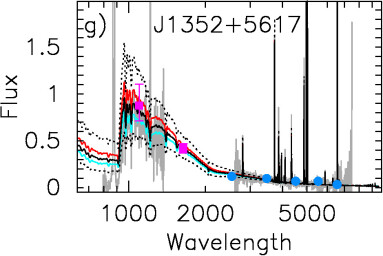
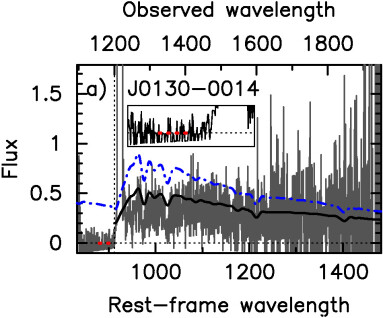
To derive the fraction of the escaping ionizing radiation we use the two methods (e.g. Izotov et al., 2018a) based on the comparison between the observed flux in the Lyman continuum and its intrinsic flux in the same wavelength range. The intrinsic LyC flux is obtained 1) from SED fitting of the SDSS spectra simultaneously with reproducing the observed H and H equivalent widths (and thus corresponding observed H and H fluxes) or 2) from the flux of the H emission line. The attenuated extrapolations of SEDs to the UV range along with the observed COS spectra are shown in Fig. 3. For comparison, we also show the GALEX FUV and NUV fluxes with magenta filled squares and the fluxes in the SDSS filters with blue filled circles. We find that the spectroscopic and photometric data in the optical range are consistent, indicating that almost all the emission of our galaxies is inside the SDSS spectroscopic aperture. Therefore, aperture corrections are not needed.
The attenuated modelled intrinsic SEDs in the optical range and their extrapolations to the UV range (Fig. 3) are obtained by assuming that extinctions for stellar and nebular emission are equal and adopting the extinction coefficients (H)MW from the NED and (H)int derived from the hydrogen Balmer decrement (Table 7), and the reddening law by Cardelli et al. (1989) at 1250Å and its extension to shorter wavelengths by Mathis (1990) with = 3.1 (red solid lines), = 2.7 (black solid lines) and = 2.4 (cyan solid lines). Mathis (1990) presents the data only for = 3.1. For practical use, we fit them with polynomials and adjusted in such a way to have the same values at =1250Å and for a variety of s as the values from the Cardelli et al. (1989) reddening law at the same wavelength and same . The dotted lines indicate the range of attenuated SEDs adopting = 2.7 and varying (H) within 1 errors of its nominal value.
| Name | (Ly)MWa | b | log c | EWd | e | blue/redf | (Ly)g |
|---|---|---|---|---|---|---|---|
| J01300014 | 0.211 | 1.10.5 | 40.56 | 4.22.4 | … | … | 1.00.6 |
| J01410304 | 0.138 | 131.93.9 | 42.83 | 153.24.9 | 308.751.8 | 28.8 | 16.65.3 |
| J08445312 | 0.164 | 83.47.8 | 42.75 | 61.86.1 | 298.541.0 | 23.8 | 20.25.9 |
| J10145501 | 0.084 | 15.82.8 | 41.89 | 35.66.6 | 591.861.2 | 247.2 | 8.23.3 |
| J11373605 | 0.107 | 63.08.6 | 42.40 | 224.531. | 328.279.5 | 49.0 | 11.25.2 |
| J11575801 | 0.150 | 3.91.0 | 41.22 | 15.74.5 | … | … | 1.10.3 |
| J13525617 | 0.054 | 104.89.7 | 42.75 | 111.012. | 394.427.6 | 12.7 | 41.55.9 |
aMilky Way extinction at the observed wavelength of the Ly emission line in mags adopting Cardelli et al. (1989) reddening law
with =3.1.
bFlux in 10-16 erg s-1 cm-2 measured in the COS spectrum and corrected for the Milky Way extinction.
c is Ly luminosity in erg s-1 corrected for the Milky Way extinction.
dRest-frame equivalent width in Å.
eLy peak separation in km s-1.
fFlux ratio of blue-to-red peaks in per cent.
gLy escape fraction in per cent.

| Name | a | (LyC)MWb | c,d | (total)c,e | (total)c,f | g | h |
|---|---|---|---|---|---|---|---|
| (Å) | (mag) | (per cent) | (per cent) | ||||
| J01300014 | 880-900 | 0.287 | 37.851.92 | 0.88i | 1.16 | 3.1 | 2.1 |
| J01410304 | 890-910 | 0.185 | 306.193.70 | 11.96 | 14.18 | 4.6 | 4.3 |
| J08445312 | 880-900 | 0.208 | 221.404.87 | 5.68 | 6.87 | 3.1 | 3.6 |
| J10145501 | 840-860 | 0.142 | 85.685.30 | 1.09i | 1.25 | 1.4 | 1.4 |
| J11373605 | 870-890 | 0.150 | 191.585.85 | 5.11 | 5.86 | 3.1 | 2.2 |
| J11575801 | 850-870 | 0.190 | 80.296.51 | 1.10i | 1.30 | 1.7 | 0.8 |
| J13525617 | 895-910 | 0.072 | 100.241.87 | 4.17 | 4.45 | 4.5 | 3.8 |
aRestframe wavelength range in Å used to determine the LyC flux.
bMilky Way extinction at the mean observed wavelengths of the range used to determine the LyC flux.
The Cardelli et al. (1989) reddening law with = 3.1 is adopted.
cin units of 10-18 erg s-1cm-2Å-1.
dLyC flux derived from extrapolation of the modelled SED in the optical range to the UV range.
eObserved LyC flux.
fLyC flux which is corrected for the Milky Way extinction.
g(LyC) = (total)/, where is derived from SED (first method).
h(LyC) = (total)/, where is derived from H flux (second method).
i1 confidence upper limit.
It is seen in Fig. 3 that the SDSS spectra are reproduced by the models quite well. On average, extrapolations of the attenuated SEDs to the UV range with = 2.7 reproduce the observed COS spectra somewhat better with flux deviations not exceeding 10 per cent for most galaxies. An exception is J10145501, for which the difference in fluxes is as high as 50 per cent. This difference can possibly be caused in part by the uncertain location of the galaxy within the COS spectroscopic aperture as the acquisition exposure was failed. It could also be caused by the underestimation of interstellar extinction, which is derived from the hydrogen Balmer decrement in the SDSS spectrum. The observed FUV shape could be fit by increasing (H) by 0.065 from the value in Table 7. This would increase the H fluxes by % and decrease the Ly and LyC escape fractions by a similar amount. However, in this case the extinction-corrected fluxes of H, H and H emission lines are considerably off from their theoretical recombination values. Furthermore, the difference between the models and observations can be caused by the non-perfect absolute flux calibration of the SDSS spectrum.
However, we note that Fig. 3 is used only for the sake of illustration to check whether extrapolation of the SED in the optical range reproduces the observed COS spectrum. But it is not used for the determination of the escaping LyC fraction. Instead the observed LyC flux is measured in COS spectra and the intrinsic LyC flux is determined by two methods mentioned above: from the extinction-corrected flux of the H emission line (H) and from simultaneous fitting of the SED in the optical range and of observed equivalent widths of the H and H emission lines. The fluxes of latter lines are also iteratively corrected for the escaping ionizing radiation (e.g. Izotov et al., 2018b) and they determine the level of the intrinsic LyC emission. It is seen in Fig. 3 that the SED in the optical range is almost independent on . Consequently, the LyC escape fraction (LyC) is also almost independent of . This is because (LyC) is derived from the ratio of the observed to modelled intrinsic LyC fluxes with the latter fluxes being derived from data in the optical range.
The relation between (H) and the intrinsic LyC flux at 900 Å (900 Å), assuming the instantaneous burst model, takes a form (Izotov et al., 2016b)
| (1) |
where EW(H) is in Å, (H) and (900 Å) are in erg s-1 and erg s-1 Å-1, respectively. The term with EW(H) in Eq. 1 takes into account the weak dependence on the starburst age. According to this equation, uncertainties on (900 Å) are due to small uncertainties of (H) (Table 7) and, thus, on (H) are unlikely to be greater than 15 - 20 per cent.
6 Ly and LyC emission
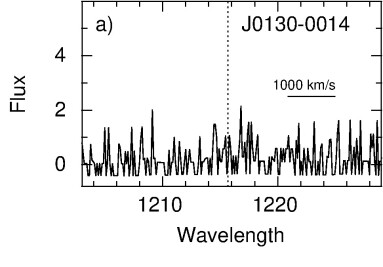
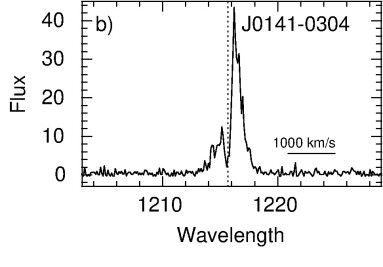
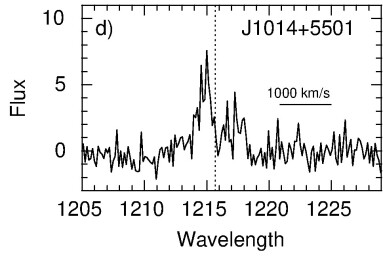
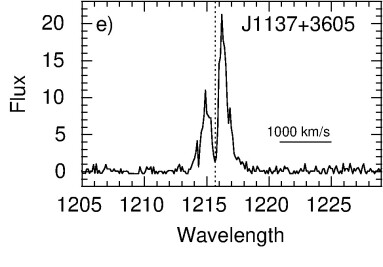
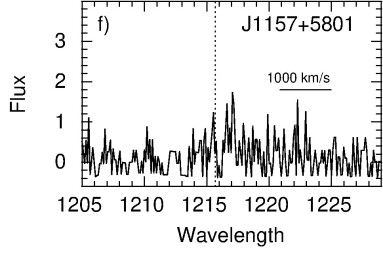
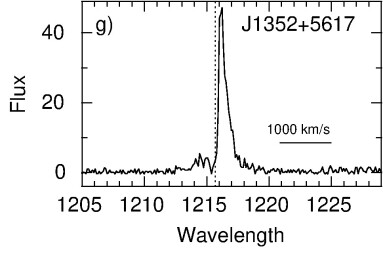
A resolved Ly 1216 Å emission line is detected in the G160M medium-resolution spectra of five out of seven galaxies (Fig. 4). Its shape is similar to that observed in most known LyC leakers (Izotov et al., 2016a, b, 2018a, 2018b, 2021a) and in some other galaxies at lower redshift (Jaskot & Oey, 2014; Henry et al., 2015; Yang et al., 2017a; Izotov et al., 2020). Profiles with two peaks are detected in the spectra of four galaxies from the present sample with detected LyC emission, J01410304, J08445312, J11373605, J13525617, and in one galaxy with non-detected LyC emission, J10145501. The blue Ly component in the latter galaxy is 2.5 times brighter than the red component (Fig. 4d). This fact is at variance with that for other galaxies, where the blue component is considerably weaker than the red component, and may be indicative of a gas inflow. The Ly emission line is very weak in the spectra of two galaxies, J01300014 and J11575801. The parameters of Ly emission are shown in Table 4.
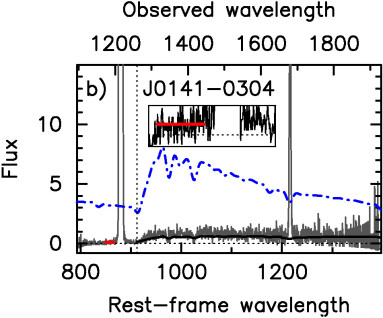
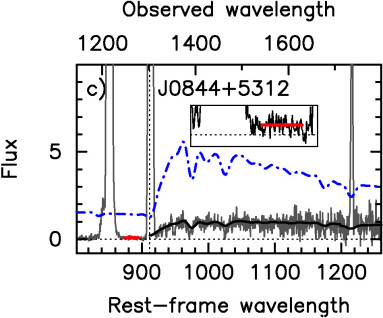
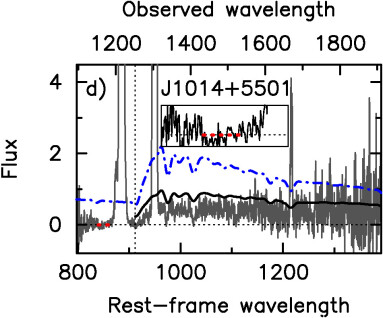
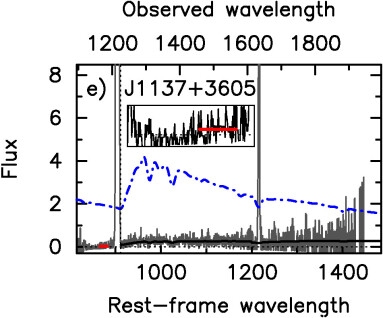
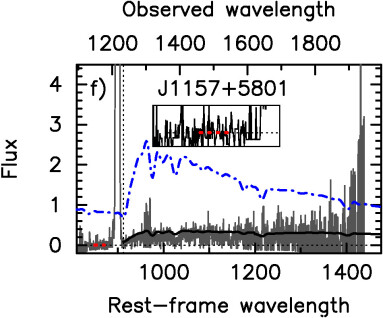
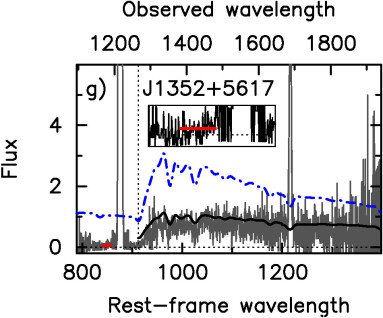
The observed G140L total-exposure spectra with the LyC spectral region (grey lines) and extrapolations to the UV range of predicted intrinsic SEDs in the optical range (blue dash-dotted lines) are shown in Fig. 5. Additionally, we include the attenuated extrapolations of the intrinsic SEDs (black solid lines), the same as those with = 2.7 that are shown in Fig. 3 but with different flux and wavelength scales.
The level of the observed LyC continuum is indicated by horizontal red lines. The vertical dotted lines show the Lyman limit. The Lyman continuum emission is detected in the spectra of four galaxies, J01410304, J08445312, J11373605 and J13525617 (solid red lines), and only 1 upper limits are derived in the spectra of the remaining three galaxies (dotted red lines). The measurements are summarised in Table 5.
Izotov et al. (2016a, b, 2018a, 2018b) used the ratio of the escaping fluxes to the intrinsic fluxes of the Lyman continuum to derive (LyC):
| (2) |
where is the mean wavelength of the range near 900 Å used for averaging the LyC flux density (see Table 5). Izotov et al. (2016b) proposed two methods to iteratively derive the intrinsic fluxes and, correspondingly, the LyC escape fractions (LyC): 1) from simultaneous fitting of the SED in the optical range together with observed equivalent widths of the H and H emission lines and 2) from the equivalent width of the H emission line, its extinction-corrected flux and adopting relations between (H)/ and EW(H) from the models of photoionized H ii regions (Eq. 1, Izotov et al., 2016b). The extinction-corrected flux of the H emission line in both methods determines the intrinsic LyC flux at 900 Å by taking into account the starburst age which mainly depends on the H and/or H equivalent widths. We use both methods in this paper.
The escape fraction (LyC) ranges between 3.1 and 4.6 per cent in four out of the seven galaxies and the 1 upper limits of (LyC) for the remaining galaxies are shown in Table 5. We find that (LyC) obtained by the two methods are similar.
7 Indirect determination of the LyC escape fraction
The direct measurement of LyC emission is the best way to derive the LyC escape fraction. However, LyC emission in most cases is weak and it difficult to detect in both the high- and low- galaxies. Furthermore, only HST can be used for the observation of the LyC wavelength range in galaxies with 0.3 – 1.0. Therefore, reasonable indirect indicators of LyC leakage at low and high redshift are needed, namely those which can more easily be derived from observations, to build a larger sample for statistical studies. Several possible indicators have been proposed, which are based mainly on observations of strong emission lines in the UV and optical ranges. For the analysis of possible indirect indicators we use a sample of 30 – 50 galaxies with Mg ii emission in their SDSS spectra from Izotov et al. (2016a, b, 2018a, 2018b, 2021a), Borthakur et al. (2014), Chisholm et al. (2017), Flury et al. (2022a), Xu et al. (2022) and this paper. The number of galaxies varies for different indicators because not all indicators are determined for all galaxies in the sample.
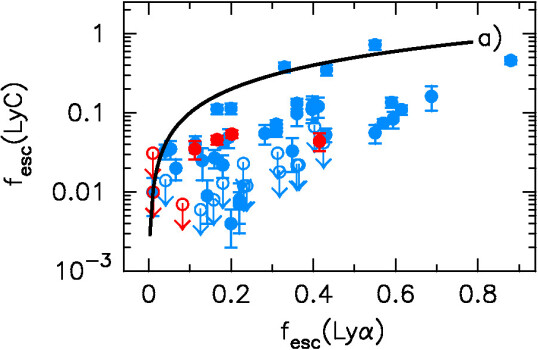
The Ly escape fraction (Ly), which is derived from the observed Ly/H emission line ratio, can potentially be linked with the LyC escape fraction. However, there are differences between mechanisms controlling the escape of LyC and Ly. The LyC photons can efficiently be absorbed by neutral hydrogen and/or dust. On the other hand, Ly photons can be ceased only via absorption by dust and via inefficient two-photon transitions. Thus, the fraction of escaping Ly photons is expected to be higher than that of escaping LyC photons, in agreement with theoretical predictions (Dressler et al., 2015; Jaskot & Oey, 2013; Nakajima & Ouchi, 2014). This is seen in Fig. 6a, where almost all LyC leaking galaxies are located below the line of equal escape fractions (black solid line). There is a tendency for (LyC) to increase with increasing (Ly) but with a large spread (see also e.g. Izotov et al., 2018b, 2021a; Flury et al., 2022b). New data do not contradict with this conclusion.
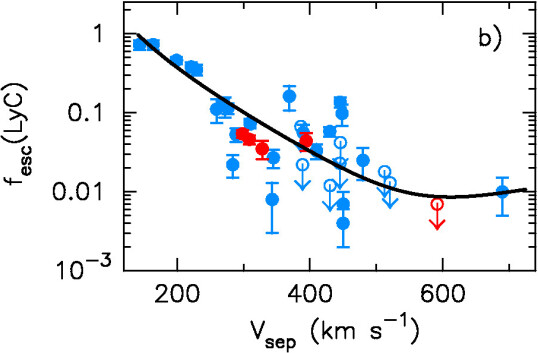
The shape of the Ly profile provides the best indirect indicator of the LyC leakage due to the fact that it depends on the column density of the neutral hydrogen along the line of sight, which determines the optical depth in both the Ly emission line and the LyC continuum. In particular, a non-zero intensity at the center of Ly or a small offset of its brighter red component from the center of the line indicate low optical depth in the H i cloud. However, these indicators may be influenced by insufficient spectral resolution and uncertainties in the wavelength calibration. On the other hand, the separation between its blue and red components in medium-resolution COS spectra is less subject to these limitations. Previously Verhamme et al. (2017) and Izotov et al. (2018b) found a tight dependence of (LyC) on the separation between the peaks of the Ly emission line in LyC leakers. This dependence has been updated in the later paper by Izotov et al. (2021a) and in this paper. The new data also follow the relation discussed by Izotov et al. (2018b) (see the solid line in Fig. 6b). There is no new galaxy in our present sample having a peak separation less than 300 km s-1, which is considerably higher compared to the lowest peak separation of 150 km s-1 in the sample of low- leakers shown in Fig. 6b. The relation by Izotov et al. (2018b) is likely not applicable for complex Ly profiles with three or more peaks, indicating considerable direct Ly escape, in addition to escape through scattering in the neutral gas (Naidu et al., 2022). The Ly profile in only one galaxy, J12434646, from the Izotov et al. (2018b) sample consists of three peaks with the peak separations of 143 and 164 km s-1. This galaxy does not change significantly the shape of the relation shown in Fig. 6b by the solid line because most of the galaxies in the sample have two Ly peaks.
The new observations of Mg ii-selected galaxies (red symbols) support previous findings on the existence of the tight relation between (LyC) and . However, the application of this relation for galaxies observed during epoch of reionization is limited because of incomplete ionization of the intergalactic medium and thus high optical depth for Ly emission.
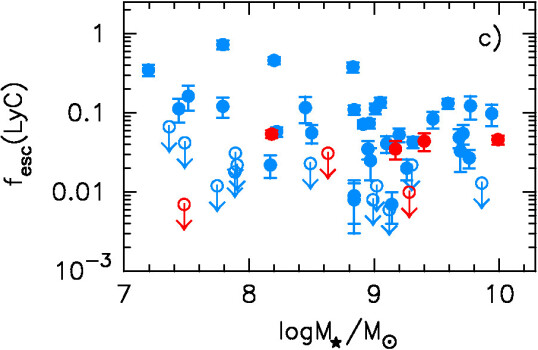
Low galaxy stellar masses are also considered as a possible indicator of high (LyC) (Wise et al., 2014; Trebitsch et al., 2017). Indeed, there is a trend of decreasing (LyC) with increasing stellar mass in galaxies with the detected LyC continuum (filled circles in Fig. 6c). However, Izotov et al. (2021a) found several strongly star-forming galaxies with 108M⊙ and non-detected LyC (blue open circles in Fig. 6c), considerably weaking the anti-correlation between (LyC) and . New data in the present paper are in agreement with the conclusion of no or only a weak correlation between (LyC) and .
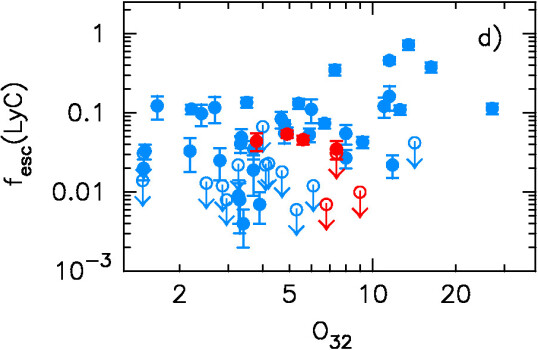
Jaskot & Oey (2013) and Nakajima & Ouchi (2014) proposed a high O32 ratio as an indication of escaping ionizing radiation. However, the increase of this ratio is caused not only by decreasing optical depth of the neutral hydrogen around the H ii region, but also by increasing ionization parameter and/or decreasing metallicity. These effects are difficult to separate. O32 in low-redshift galaxies can easily be derived from their spectra in the optical range. This quantity is known for all low- LyC leakers.
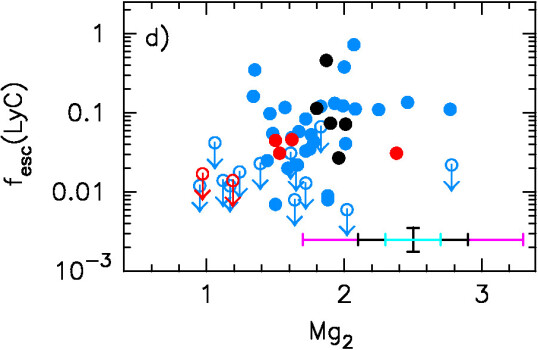
The relation between (LyC) and O32 has been discussed by Faisst (2016), Izotov et al. (2018b, 2021a) and Flury et al. (2022b). Its updated version from Izotov et al. (2021a) is presented in Fig. 6d, which shows a trend of increasing (LyC) with increasing of O32, but with a substantial scatter. This scatter, in part, can be caused by a variety of scenarios with leakage through channels with low optical depth and their orientation relative to the observer. Similar conclusion can be drawn from the Flury et al. (2022b) data. Therefore, a high O32 can be used for selection of the LyC leaking candidates, but it is not a very certain indicator of high (LyC) (Izotov et al., 2018b; Nakajima et al., 2020).
8 Mg ii diagnostics
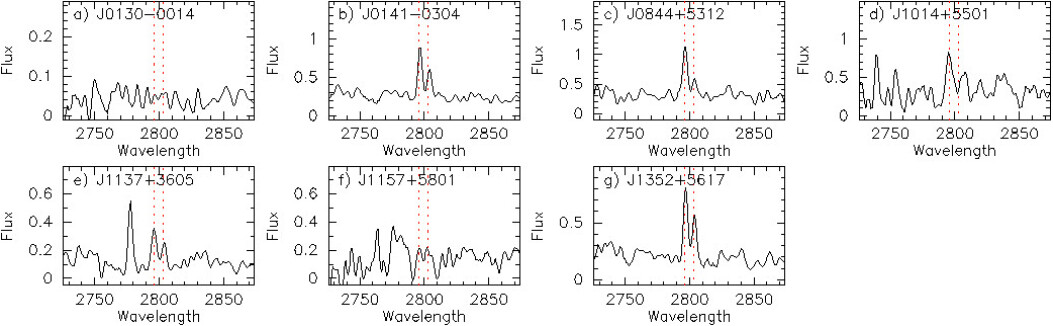
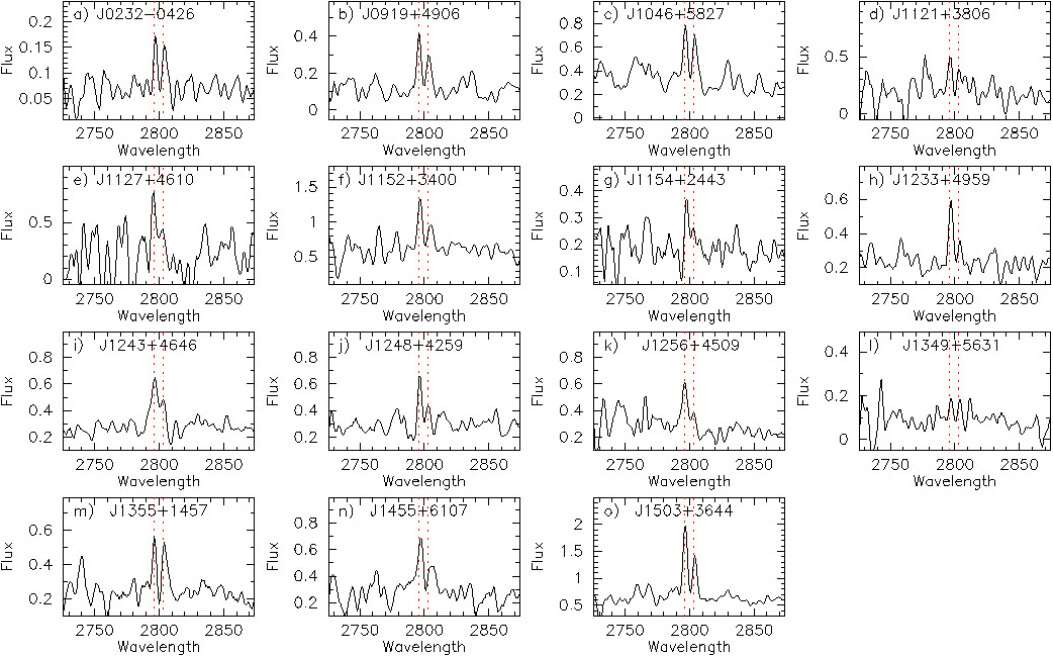
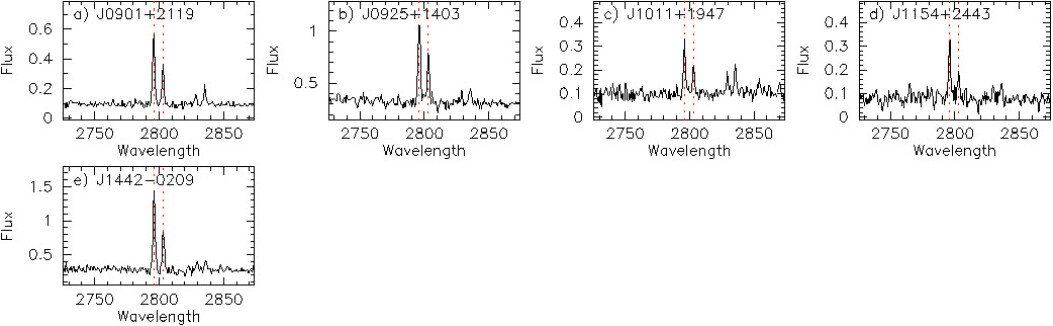
Henry et al. (2018) and Chisholm et al. (2020) have proposed to use the double resonance line of Mg ii 2796, 2803 in emission as an indicator of escaping LyC emission based on the fact that its escape fraction correlates with the Ly escape fraction. Later, Xu et al. (2022) also proposed Mg ii as low- tracer of Ly and LyC, Naidu et al. (2022) pointed out that Mg ii2796/2803 line ratio is higher in 2 galaxies with higher (LyC). Following these papers we consider the properties of Mg ii emission and their relations with the Ly and LyC escape fractions. For many low-redshift LyC leaking galaxies (Izotov et al., 2016a, b, 2018a, 2018b, 2021a; Flury et al., 2022a; Xu et al., 2022, this paper) the wavelength range with the redshifted Mg ii 2796, 2803 emission lines is covered by the SDSS spectra (Fig. 9 – 9). However, these redshifted lines are outside the wavelength range of SDSS spectra from the releases earlier than DR10 of some LyC leakers with lowest redshifts of 0.3 (for example, J09251403, J10111947, J14420209). XShooter spectra covering the Mg ii emission (Fig. 9) are also available for some LyC galaxies (Guseva et al., 2020), including those with 0.3.
We note that Mg ii emission is located in the noisy parts of the SDSS spectra. Because of weakness of these lines they cannot be measured with high accuracy. The spectral resolution of SDSS spectra is insufficient to determine the Mg ii emission line profiles. On the other hand, the accuracy of measurements and spectral resolution are better for XShooter spectra. Because of the limitations for the SDSS sample, we consider only two characteristics for the entire SDSS+XShooter sample, the extinction-corrected O3Mg2 = [O iii]5007/Mg ii 2796+2803 and Mg2 = Mg ii 2796/Mg ii 2803 flux ratios, which are less subject to the uncertainties compared to those in fitting of the Mg ii emission line profiles.
Mg ii emission is detected in most LyC leaking galaxies if it falls in the wavelength range of SDSS spectra, as expected in the case of low neutral gas column densities. The two galaxies with very little (or no) Mg ii detections in Fig. 9 (J01300014 and J11575801) also do not have LyC detections, illustrating how a non-detection of Mg ii can also lead to a non-detection of LyC. However, there is one possible exception. The galaxy J11213806 has (LyC) 35 per cent and strong and narrow Ly emission line (Izotov et al., 2021a). On the other hand, Mg ii emission in this galaxy is barely seen (Fig. 9d). Thus, the high LyC leakage is possibly not always associated with the presence of strong Mg ii emission. However, the SNR of SDSS spectrum is low and this galaxy merits deeper observations (King et al. in preparation).
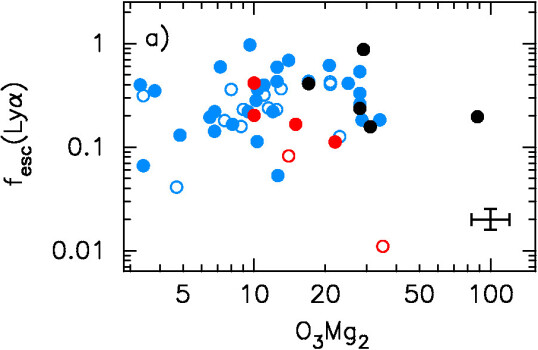
Fig. 10a and 10b show the dependencies of the Ly escape fraction (Ly) on the O3Mg2 and Mg2, respectively. It is seen that (Ly) is almost independent of both the O3Mg2 and Mg2 ratios.
Mg2 in two galaxies, J11274610 and J14556107 (Fig. 9e, 9n, Izotov et al., 2021a), in Fig. 10b is considerably above the value of 2 in the case of zero optical depth in Mg ii lines, which is unlikely. However, we note that Mg2s in these two galaxies are measured with the largest errors, 2 times higher than typical errors for objects shown in Fig. 10b. Furthermore, these lines in all galaxies were not corrected for interstellar or stellar photospheric Mg ii absorption. Equivalent widths of these absorption lines are somewhat uncertain. Guseva et al. (2019) adopted equal equivalent widths of 0.5Å for each of Mg ii absorption lines, whereas Pérez-Ràfols et al. (2015) derived 2.33 Å for both lines, which are consistent with the value of 1Å for Mg ii 2796 absorption line in star-forming galaxies with stellar masses 109.5M⊙ (Martin et al., 2012) and the values adopted by Prochaska, Kasen & Rubin (2011). All these values are lower than equivalent widths of Mg ii emission lines (Table 7). Assuming that equivalent widths of Mg ii 2796 and 2803 absorption lines are equal and correcting emission lines by multiplying with (EWem+EWabs)/EWem results in a reduction of Mg2 ratio if this ratio is above 1. This is because the equivalent width of the Mg ii 2796 emission line is greater than that of the Mg ii 2803 emission line. The effect is larger for higher values of Mg2 reducing the number of galaxies with Mg2 above 2.
Using the analytic work of Chisholm et al. (2020), a Mg2 of 1.3 would correspond to an Mg ii 2803Å optical depth of 0.43 (or a 2796 optical depth near 1). For the typical abundances of the sample, that would lead to H i column densities near 9.41016 cm-2, which is very close to being optically thin for the LyC emission. It is notable that Mg2 in all five galaxies with high (LyC) observed with the high SNR at the XShooter by Guseva et al. (2020) is very close to 2 (black symbols in Fig. 10b), in agreement with expectations for the low optical depth (e.g. Chisholm et al., 2020).
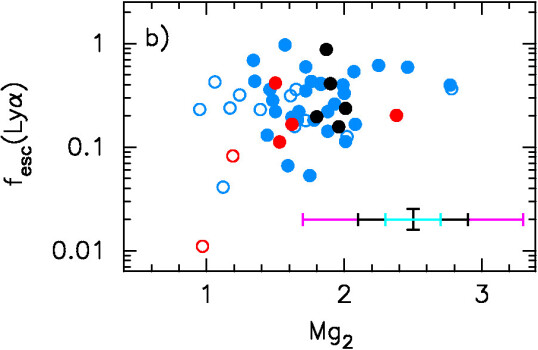
In Fig. 10c and 10d we show the relations of (LyC) with the O3Mg2 and Mg2 flux ratios, respectively. We note an interesting feature in Figs. 10b and 10d that the LyC leakers have preferentially Mg2 1.3, as expected because high values of Mg2 indicate low optical depth (Chisholm et al., 2020). Similarly, Naidu et al. (2022) found that galaxies with low (LyC) have preferentially low Mg2 0.9. Possibly, a tendency of increasing (LyC) with increasing of the O3Mg2 and Mg2 is present albeit scatter of the data is large.
The statistics in Fig. 10 are small and subject to large errors of individual mesurements. Therefore, for a comparison we selected 6000 galaxies with 0.3 from the sample of compact star-forming galaxies by Izotov et al. (2021c) in which both the Mg ii 2796 and 2803 emission lines were observed. The errors of Mg line fluxes in this sample are also large. However, large statistics in each bin of the O3Mg2 and Mg2 flux ratios considerably reduces the impact of uncertain individual values. These galaxies constitute 60 per cent of the total number of galaxies in the catalogue of Izotov et al. (2021c) with 0.3. Mg ii in the remaining galaxies is either in absorption or only one of the two lines is detected.
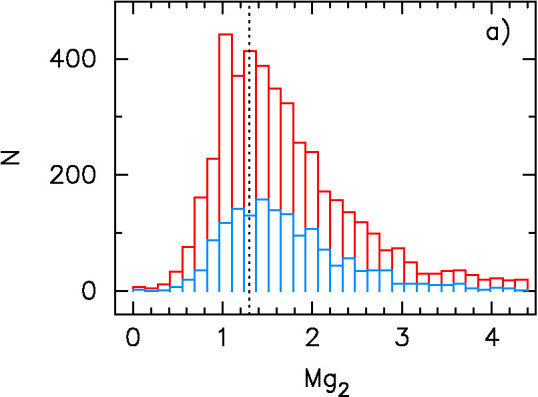
The distribution of Mg2 for selected galaxies is shown in Fig. 11a. This distribution is broad and approximately 1/3 galaxies have Mg2 2. The scatter is likely caused not only by errors of measurements. It remains even if only brightest galaxies with well measured Mg ii fluxes are considered (compare Fig. 11c and Fig. 11d). On the other hand, correction for underlying absorption can make the distribution narrower together with the decreasing number of galaxies with Mg2 2. We find that nearly 2/3 of the sample is characterised by a Mg2 1.3 implying that most of selected compact star-forming galaxies could possibly be LyC leakers.
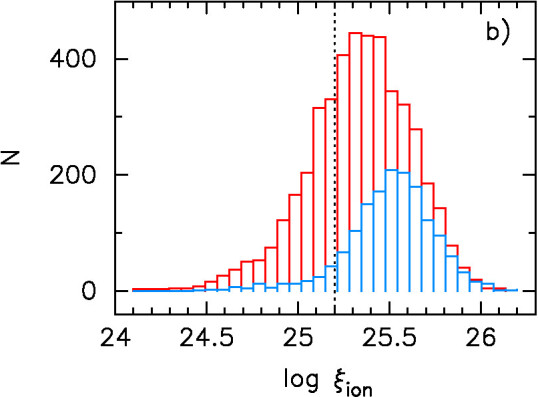
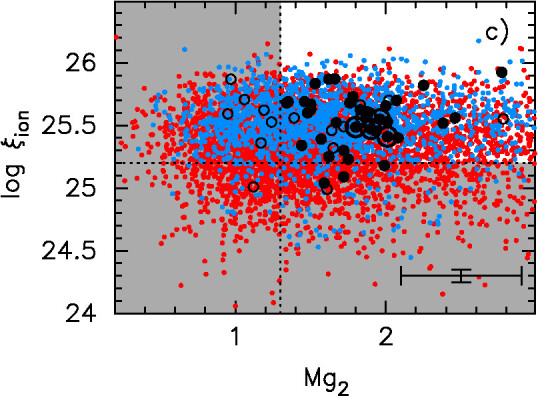
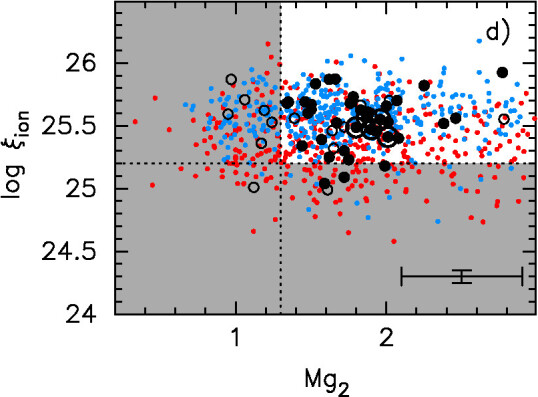
The distribution of ionizing photon production efficiency for the same galaxies is shown in Fig. 11b. Here = (LyC)/, where (LyC) and are the production rate of the LyC radiation in photons s-1 and the intrinsic monochromatic luminosity at the rest-frame wavelength of 1500Å in erg s-1 Hz-1. It is seen that log in the sample galaxies is high. In most of galaxies it is above the threshold of 25.2, adopted in models of reionization (e.g. Robertson et al., 2013). Finally, we show the relations between log and Mg2 for all selected SDSS galaxies (Fig. 11c) and brightest SDSS galaxies in the sense that the H fluxes in these galaxies are above 510-16 erg s-1cm-2 and equivalent widths of the Mg ii 2796 emission line are above 10 Å (Fig. 11d). The unshaded region in Fig. 11c and 11d is populated by the galaxies with Mg2 1.3 and log 25.2, which constitute nearly half of the total sample and somewhat more for the brightest galaxies. Most of low- LyC leakers (black filled circles) are located in this region. The few galaxies with log below 25.2 are only from the LzLCS sample by Flury et al. (2022a, b), which contains, in general, lower-excitation H ii regions compared e.g. with the galaxies from the Izotov et al. (2016a, b, 2018a, 2018b, 2021a) sample. Thus, the criterion Mg2 1.3 can be a useful cut to selected LyC leaker candidates at low- and high-redshifts due to the fact that strong Mg ii emission is present in most LyC leaking galaxies.
9 Conclusions
We present new HST COS low- and medium-resolution spectra of seven compact SFG in the redshift range = 0.3161 – 0.4276, with various O3Mg2 = [O iii]5007/Mg ii 2796+2803 and Mg2 = Mg ii 2796/Mg ii 2803 emission-line ratios. We aim to obtain properties of leaking LyC and resolved Ly emission and to study the dependence of leaking LyC emission on the characteristics of Mg ii emission along with other indirect indicators of escaping ionizing radiation. This study is an extension of the work reported earlier in Izotov et al. (2016a, b, 2018a, 2018b, 2021a). Our main results are summarised as follows:
1. Emission of Lyman continuum is detected in four out of the seven galaxies with the escape fraction (LyC) in the range between 3.1 per cent (J1137+3605) and 4.6 per cent (J0844+5312). Only upper limits (LyC) 1 – 3 per cent are obtained for the remaining three galaxies.
2. A Ly emission line with two peaks is observed in the spectra of five galaxies. The Ly emission line in two galaxies, J01300014 and J1157+5801, is very weak. Our new observations support a strong anti-correlation between (LyC) and the peak velocity separation of the Ly profile, confirming the finding of Izotov et al. (2018b, 2021a) and making the most robust indirect indicator of Lyman continuum radiation leakage.
3. Other characteristics such as O32 ratio, escape fraction of the Ly emission line (Ly) and the stellar mass show weak or no correlations with (LyC), with a high spread of values, in agreement with earlier studies by e.g. Izotov et al. (2016b, 2018a, 2021a), Flury et al. (2022b).
4. We study the characteristics of Mg ii 2796+2803 emission, such as O3Mg2 and Mg2 ratios, as possible indirect indicators of escaping LyC emission. We find that galaxies with detected LyC emission have preferentially Mg2 1.3, the latter indicating low optical depths. A high Mg2 ratio of 1.3 can be used to select LyC leaker candidates. A tendency of an increase of (LyC) with increasing of both the O3Mg2 and Mg2 is possibly present. However, there is substantial scatter in these relations due to the low signal-to-noise ratio in the blue part of the SDSS spectra near the observed Mg ii emission not allowing their use for reliable prediction of (LyC).
5. We find that galaxies with Mg2 1.3 and ionizing photon production efficiency greater than the value of 1025.2 erg-1 Hz used in modelling of the process of reionization of the Universe (e.g. Robertson et al., 2013) constitute 40 per cent of all compact star-forming galaxies at redshift 0.3, which were selected by Izotov et al. (2021c) from the Data Release 16 of the Sloan Digital Sky Survey.
6. A bright compact star-forming region superimposed on a low-surface-brightness component is seen in the COS near ultraviolet (NUV) acquisition images of five galaxies (two images are missing due to technical problems). The surface brightness at the outskirts of our galaxies can be approximated by an exponential disc, with a scale length of 0.20 – 0.63 kpc. This is 4 times lower than the scale lengths of the LyC leakers observed by Izotov et al. (2016b, 2018a, 2018b), but is similar to that in low-mass galaxies with 108 M⊙ by Izotov et al. (2021a). Part of this difference may be explained by acquisition exposure times that are 2 shorter compared to those used by Izotov et al. (2016b, 2018a, 2018b), resulting in less deep images.
Acknowledgements
Based on observations made with the NASA/ESA Hubble Space Telescope, obtained from the data archive at the Space Telescope Science Institute. Support for this work was provided by NASA through grant number HST-GO-15845 from the Space Telescope Science Institute. STScI is operated by the Association of Universities for Research in Astronomy, Inc. under NASA contract NAS 5-26555. Y.I. and N.G. acknowledge support from the National Academy of Sciences of Ukraine by its priority project No. 0122U002259 “Fundamental properties of the matter and its manifistation in micro world, astrophysics and cosmology”. Funding for SDSS-III has been provided by the Alfred P. Sloan Foundation, the Participating Institutions, the National Science Foundation, and the U.S. Department of Energy Office of Science. The SDSS-III web site is http://www.sdss3.org/. SDSS-III is managed by the Astrophysical Research Consortium for the Participating Institutions of the SDSS-III Collaboration. GALEX is a NASA mission managed by the Jet Propulsion Laboratory. This research has made use of the NASA/IPAC Extragalactic Database (NED) which is operated by the Jet Propulsion Laboratory, California Institute of Technology, under contract with the National Aeronautics and Space Administration.
Data availability
The data underlying this article will be shared on reasonable request to the corresponding author.
References
- Ade et al. (2014) Ade P. A. R. et al., 2014, A&A, 571, A16
- Aller (1984) Aller L. H., 1984, Physics of Thermal Gaseous Nebulae. Dordrecht: Reidel
- Bian et al. (2017) Bian F., Fan X., McGreer I., Cai Z., Jiang L., 2017, ApJ, 837, 12
- Borthakur et al. (2014) Borthakur S., Heckman T. M., Leitherer C., Overzier R. A., 2014, Science, 346, 216
- Bouwens et al. (2015) Bouwens R. J., Illingworth G. D., Oesch P. A., Caruana J., Holwerda B., Smit R., Wilkins S., 2015, ApJ, 811, 140
- Bouwens et al. (2017) Bouwens R. J., Illingworth G. D., Oesch P. A., Atek H, Lam D, Stefanon M., 2017, ApJ, 843, 41
- Calzetti et al. (2000) Calzetti D., Armus L., Bohlin R. C., Kinney A. L., Koornneef J., Storchi-Bergmann T., 2000, ApJ, 533, 682
- Cardamone et al. (2009) Cardamone C. et al., 2009, MNRAS, 399, 1191
- Cardelli et al. (1989) Cardelli J. A., Clayton G. C., Mathis J. S., 1989, ApJ, 345, 245
- Caruana et al. (2018) Caruana J. et al., 2018, MNRAS, 473, 30
- Chisholm et al. (2017) Chisholm J., Orlitová I., Schaerer D., Verhamme A., Worseck G., Izotov Y. I., Thuan T. X., Guseva N. G., 2017, A&A, 605, A67
- Chisholm et al. (2018) Chisholm J. et al., 2018, A&A, 616, 30
- Chisholm et al. (2020) Chisholm J., Prochaska J. X., Schaerer D., Gazagnes S., Henry A., 2020, MNRAS, 498, 2554
- Cowie et al. (2009) Cowie L. L., Barger A. J., Trouille L., 2009, ApJ, 692, 1476
- Curtis-Lake et al. (2016) Curtis-Lake E. et al., 2016, MNRAS, 457, 440
- de Barros et al. (2016) de Barros S. et al., 2016, A&A, 585, A51
- de Barros et al. (2019) de Barros S., Oesch P. A., Labbé I., Stefanon M., González V., Smit R., Bouwens R. J., Illingworth G. D., 2019, MNRAS, 489, 2355
- Dijkstra et al. (2016) Dijkstra M., Gronke M., Venkatesan A., 2016, ApJ, 828, 71
- Dressler et al. (2015) Dressler A., Henry A., Martin C. L., Sawicki M., McCarthy P., Villaneuva E., 2015, ApJ, 806, 19
- Endsley et al. (2021) Endsley R., Stark D. P., Chevallard J., Charlot S., 2021, MNRAS, 500, 5229
- Erb et al. (2012) Erb D. K., Quider A. M., Henry A. L., Martin C. L., 2012, ApJ, 759, 26
- Faisst (2016) Faisst A. L., 2016, ApJ, 829, 99
- Finkelstein et al. (2019) Finkelstein S. L. et al., 2019, ApJ, 879, 36
- Finley et al. (2017) Finley H. et al. 2017, A&A, 608, A7
- Fletcher et al. (2019) Fletcher T. J., Tang M., Robertson B. E., Nakajima K., Ellis R. S., Stark D. P., Inoue A., 2019, ApJ, 878, 87
- Flury et al. (2022a) Flury S. R. et al. 2022a, ApJS, 260, 1
- Flury et al. (2022b) Flury S. R. et al. 2022b, ApJ, 930, 126
- Gazagnes et al. (2018) Gazagnes S., Chisholm J., Schaerer D., Verhamme A., Rigby J. R., Bayliss M., 2018, A&A, 616, 29
- Gazagnes et al. (2020) Gazagnes S., Chisholm J., Schaerer D., Verhamme A., Izotov Y., 2020, A&A, 639, 85
- Girardi et al. (2000) Girardi L., Bressan A., Bertelli G., Chiosi C., 2000, A&AS, 141, 371
- Grazian et al. (2016) Grazian A. et al., 2016, A&A, 585, A48
- Gronke et al. (2021) Gronke M. et al., 2021, MNRAS, 508, 3697
- Guseva et al. (2013) Guseva N. G., Izotov Y. I., Fricke K. J., Henkel C., 2013, A&A, 555, A90
- Guseva et al. (2019) Guseva N. G., Izotov Y. I., Fricke K. J., Henkel C., 2019, A&A, 624, A21
- Guseva et al. (2020) Guseva N. G. et al., 2020, MNRAS, 497, 4293
- Henry et al. (2015) Henry A., Scarlata C., Martin C. S., Erb D., 2015, ApJ, 809, 19
- Henry et al. (2018) Henry A., Berg D. A., Scarlata C., Verhamme A., Erb D., 2018, ApJ, 855, 96
- Inoue et al. (2014) Inoue A. K., Shimizu I., Iwata I., Tanaka M., 2014, MNRAS, 442, 1805
- Izotov et al. (1994) Izotov Y. I., Thuan T. X., Lipovetsky V. A., 1994, ApJ, 435, 647
- Izotov et al. (2006) Izotov Y. I., Stasińska G., Meynet G., Guseva N. G., Thuan T. X., 2006, A&A, 448, 955
- Izotov et al. (2011) Izotov Y. I., Guseva N. G., Thuan T. X., 2011, ApJ, 728, 161
- Izotov et al. (2015) Izotov Y. I., Guseva N. G., Fricke K. J., Henkel C., 2015, MNRAS, 451, 2251
- Izotov et al. (2016a) Izotov Y. I., Orlitová I., Schaerer D., Thuan T. X., Verhamme A., Guseva N. G., Worseck G., 2016a, Nature, 529, 178
- Izotov et al. (2016b) Izotov Y. I., Schaerer D., Thuan, T. X., Worseck G., Guseva N. G., Orlitová I., Verhamme A., 2016b, MNRAS, 461, 3683
- Izotov et al. (2017) Izotov Y. I., Guseva N. G., Fricke K. J., Henkel C., Schaerer D., 2017, MNRAS, 467, 4718
- Izotov et al. (2018a) Izotov Y. I., Schaerer D., Worseck G., Guseva N. G., Thuan, T. X., Verhamme A., Orlitová I., Fricke K. J, 2018a, MNRAS, 474, 4514
- Izotov et al. (2018b) Izotov Y. I., Worseck G., Schaerer D., Guseva N. G., Thuan, T. X., Fricke K. J, Verhamme A., Orlitová I., 2018b, MNRAS, 478, 4851
- Izotov et al. (2018c) Izotov Y. I., Thuan T. X., Guseva N. G., Liss S. E., 2018c, MNRAS, 473, 1956
- Izotov et al. (2020) Izotov Y. I., Schaerer D., Worseck G., Verhamme A., Guseva N. G., Thuan T. X., Orlitová I., Fricke K. J., 2020, MNRAS, 491, 468
- Izotov et al. (2021a) Izotov Y. I., Worseck, G., Schaerer D., Guseva N. G., Chisholm J., Thuan T. X., Fricke K. J., Verhamme A., 2021a, MNRAS, 503, 1734
- Izotov et al. (2021b) Izotov Y. I., Thuan T. X., Guseva N. G., 2021b, MNRAS, 504, 3996
- Izotov et al. (2021c) Izotov Y. I., Guseva N. G., Fricke K. J., Henkel C., Schaerer D., Thuan T. X., 2021c, A&A, 646, A138
- Jaskot & Oey (2013) Jaskot A. E., Oey M. S., 2013, ApJ, 766, 91
- Jaskot & Oey (2014) Jaskot A. E., Oey M. S., 2014, ApJ, 791, L19
- Katz et al. (2022) Katz H. et al., 2022, MNRAS, https://doi.org/10.1093/mnras/stac1437
- Kennicutt (1998) Kennicutt R. C., Jr., 1998, ARA&A, 36, 189
- Khaire et al. (2016) Khaire V., Srianand R., Choudhury T. R., Gaikwad P., 2016, MNRAS, 457, 4051
- Kim et al. (2020) Kim K., Malhotra S., Rhoads J. E., Butler N. R., Yang H., 2020, ApJ, 893, 134
- Kornei et al. (2013) Kornei K. A., Shapley A. E., Martin C. L., Coil A. L., Lotz J. M., Weiner B. J., 2013, ApJ, 774, 50
- Kroupa (2001) Kroupa P., 2001, MNRAS, 322, 231
- Labbé et al. (2013) Labbé I. et al., 2013, ApJ, 777, L19
- Leitet et al. (2013) Leitet E., Bergvall N., Hayes M., Linné S., Zackrisson E., 2013, A&A, 553, A106
- Leitherer et al. (2016) Leitherer C., Hernandez S., Lee J. C., Oey M. S., 2016, ApJ, 823, L64
- Lejeune et al. (1997) Lejeune T., Buser R., Cuisinier F., 1997, A&AS, 125, 229
- Lewis et al. (2020) Lewis J. S. W. et al., 2020, MNRAS, 496, 4342
- Makan et al. (2021) Makan K., Worseck G., Davies F. B., Hennawi J. F., Prochaska J. X., Richter P., 2021, ApJ, 912, 38
- Marchi et al. (2017) Marchi F. et al., 2017, A&A, 601, 73
- Marchi et al. (2018) Marchi F. et al., 2018, A&A, 614, 11
- Martin et al. (2012) Martin C. L., Shapley A. E., Coil A. L., Kornei K. A., Bundi K., Weiner B. J., Noeske K. G., Schiminovich D., 2012, ApJ, 760, 127
- Mathis (1990) Mathis J. S., 1990, ARA&A, 28, 10
- Matsuoka et al. (2018) Matsuoka Y. et al., 2018, ApJ, 869, 150
- Meštric et al. (2020) Meštric U. et al., 2020, MNRAS, 494, 4986
- Meyer et al. (2020) Meyer R. A. et al., 2020, 494, 1560
- Mitra et al. (2013) Mitra S., Ferrara A., Choudhury T. R., 2013, MNRAS, 428, L1
- Naidu et al. (2020) Naidu R. P., Tacchella S., Mason C. A., Bose S., Oesch P. A., Conroy C., 2020, ApJ, 892, 109
- Naidu et al. (2022) Naidu R. P. et al., 2022, MNRAS, 510, 4582
- Nakajima & Ouchi (2014) Nakajima K., Ouchi M., 2014, MNRAS, 442, 900
- Nakajima et al. (2018) Nakajima K., Fletcher T., Ellis R. S., Robertson B. E., Iwata I., 2018, MNRAS, 477, 2098
- Nakajima et al. (2020) Nakajima K., Ellis R. S., Robertson B. E., Tang M., Stark D. P., 2020, ApJ, 889, 161
- Ouchi et al. (2009) Ouchi M. et al., 2009, ApJ, 706, 1136
- Paulino-Afonso et al. (2018) Paulino-Afonso A. et al., 2018, MNRAS, 476, 5479
- Pérez-Ràfols et al. (2015) Pérez-Ràfols I., Miralda-Escudé J., Lundgren B., Ge J., Petitjean P., Schneider D. P., York D. G., Weaver B. A., 2015, MNRAS, 447, 2784
- Prochaska et al. (2011) Prochaska J. X., Kasen D., Rubin K., 2011, ApJ, 734, 24
- Rivera-Thorsen et al. (2017) Rivera-Thorsen T. E. et al., 2017, A&A, 608, L4
- Rivera-Thorsen et al. (2019) Rivera-Thorsen T. E. et al., 2019, Science, 366, 738
- Robertson et al. (2013) Robertson B. E. et al., 2013, ApJ, 768, 71
- Robertson et al. (2015) Robertson B. E., Ellis R. S., Furlanetto S. R., Dunlop J. S., 2015, ApJ, 802, L19
- Saha et al. (2020) Saha K. et al., 2020, Nature Astronomy, 4, 1185
- Saldana-Lopez et al. (2022) Saldana-Lopez A. et al., 2022, A&A, in press; preprint arXiv:2201.11800
- Salpeter (1955) Salpeter E. E., 1955, ApJ, 121, 161
- Schmutz et al. (1992) Schmutz W., Leitherer C., Gruenwald R., 1992, PASP, 104, 1164
- Shapley et al. (2016) Shapley A. E., Steidel C. C., Strom A. L., Bogosavljević M., Reddy N. A., Siana B. Mostardi R. E., Rudie G. C., 2016, ApJ, 826, L24
- Smit et al. (2014) Smit R. et al., 2014, ApJ, 784, 58
- Stasińska et al. (2015) Stasińska G., Izotov Y., Morisset C., Guseva N., 2015, A&A, 576, A83
- Steidel et al. (2018) Steidel C. C., Bogosavljević M., Shapley A.E., Reddy N. A., Rudie G. C., Pettini M., Trainor R. F., Strom A. L., 2018, ApJ, 869, 123
- Thuan & Martin (1981) Thuan T. X., Martin G. E., 1981, ApJ, 247, 823
- Trebitsch et al. (2017) Trebitsch M., Blaizot J., Rosdahl J., Devriendt J., Slyz A., 2017, MNRAS, 470, 224
- Vanzella et al. (2010) Vanzella E. et al., 2010, ApJ, 725, 1011
- Vanzella et al. (2012) Vanzella E. et al., 2012, ApJ, 751, 70
- Vanzella et al. (2015) Vanzella E. et al., 2015, A&A, 576, A116
- Vanzella et al. (2018) Vanzella E. et al., 2018, MNRAS, 476, L15
- Vanzella et al. (2020) Vanzella E. et al., 2020, MNRAS, 491, 1093
- Verhamme et al. (2015) Verhamme A., Orlitová I., Schaerer D., Hayes M., 2015, A&A, 578, A7
- Verhamme et al. (2017) Verhamme A., Orlitová I., Schaerer D., Izotov Y., Worseck G., Thuan T. X., Guseva N., 2017, A&A, 597, A13
- Vielfaure et al. (2020) Vielfaure J.-B., et al. 2020, A&A, 640, 30
- Wang et al. (2021) Wang B. et al., 2021, ApJ, 916, 3
- Weiner et al. (2009) Weiner B. J. et al., 2009, ApJ, 692, 187
- Witstok et al. (2021) Witstok J., Smit R., Maiolino R., Curti M., Laporte N., Massey R., Richard J., Swinbank M., 2021, MNRAS, 508, 1686
- Wise & Chen (2009) Wise J. H., Cen R., 2009, ApJ, 693, 984
- Wise et al. (2014) Wise J. H., Demchenko V. G., Halicek M. T., Norman M. L., Turk M. J., Abel T., Smith B. D., 2014, MNRAS, 442, 2560
- Worseck et al. (2016) Worseck G., Prochaska J. X., Hennawi J. F., McQuinn M., 2016, ApJ, 825, 144
- Wright (2006) Wright E. L., 2006, PASP, 118, 1711
- Xu et al. (2022) Xu X. et al., 2022, ApJ, in press; preprint arXiv:2205.11317
- Yajima et al. (2011) Yajima H., Choi J.-H., Nagamine K., 2011, MNRAS, 412, 411
- Yang et al. (2017a) Yang H. et al., 2017a, ApJ, 844, 171
- Yang et al. (2017b) Yang H., Malhotra S., Rhoads J. E., Leitherer C., Wofford A., Jiang T., Wang J., 2017b, ApJ, 847, 38
Appendix A Apparent magnitudes
| Name | SDSS | GALEX | WISE | ||||||||||
|---|---|---|---|---|---|---|---|---|---|---|---|---|---|
| FUV | NUV | ||||||||||||
| (err) | (err) | (err) | (err) | (err) | (err) | (err) | (err) | (err) | (err) | (err) | |||
| J01300014 | 22.09 | 21.95 | 21.09 | 22.18 | 21.80 | 22.42 | 22.15 | 16.81 | 16.10 | … | … | ||
| (0.18) | (0.08) | (0.05) | (0.17) | (0.42) | (0.16) | (0.14) | (0.09) | (0.17) | (…) | (…) | |||
| J01410304 | 21.45 | 21.25 | 21.22 | 20.88 | 20.83 | 21.35 | 22.04 | … | … | … | … | ||
| (0.12) | (0.04) | (0.05) | (0.05) | (0.19) | (0.35) | (0.44) | (…) | (…) | (…) | (…) | |||
| J08445312 | 21.50 | 21.44 | 21.57 | 20.35 | 22.59 | 21.99 | 21.61 | … | … | … | … | ||
| (0.15) | (0.06) | (0.09) | (0.04) | (0.73) | (0.53) | (0.49) | (…) | (…) | (…) | (…) | |||
| J10145501 | 21.94 | 21.73 | 21.66 | 21.58 | 21.45 | 21.88 | 22.29 | 17.54 | 15.70 | 12.51 | … | ||
| (0.16) | (0.06) | (0.09) | (0.11) | (0.30) | (0.59) | (0.70) | (0.16) | (0.11) | (0.43) | (…) | |||
| J11373605 | 22.23 | 21.79 | 20.96 | 22.09 | 20.56 | … | 22.46 | 17.50 | 15.89 | 12.37 | … | ||
| (0.23) | (0.07) | (0.05) | (0.18) | (0.17) | (…) | (0.20) | (0.17) | (0.15) | (0.42) | (…) | |||
| J11575801 | 24.03 | 22.32 | 21.33 | 22.59 | 21.73 | … | 22.94 | … | … | … | … | ||
| (0.82) | (0.10) | (0.07) | (0.34) | (0.48) | (…) | (0.37) | (…) | (…) | (…) | (…) | |||
| J13525617 | 22.17 | 21.73 | 21.54 | 21.10 | 21.55 | 21.83 | 21.81 | … | … | … | … | ||
| (0.23) | (0.06) | (0.07) | (0.08) | (0.41) | (0.17) | (0.13) | (…) | (…) | (…) | (…) | |||
Appendix B Emission line fluxes and chemical composition
| Galaxy | |||||||||
| Line | J01300014 | J01410304 | J08445312 | J10145501 | |||||
| a | EWb | a | EWb | a | EWb | a | EWb | ||
| Mg ii | 2796 | … | … | 26.33.2 | 11 | 43.44.5 | 15 | 24.04.5 | 8 |
| Mg ii | 2803 | … | … | 16.22.8 | 7 | 18.23.5 | 5 | 20.14.3 | 7 |
| O ii | 3727 | 92.37.7 | 109 | 118.05.5 | 142 | 137.77.0 | 98 | 91.86.9 | 107 |
| H12 | 3750 | … | … | 3.32.0 | 3 | … | … | … | … |
| H11 | 3771 | … | … | 5.21.9 | 6 | … | … | … | … |
| H10 | 3798 | 6.02.8 | 9 | 7.72.0 | 9 | 7.12.3 | 6 | … | … |
| H9 | 3836 | 10.23.0 | 21 | 9.11.9 | 11 | 14.02.6 | 14 | 9.72.9 | 12 |
| Ne iii | 3869 | 47.15.4 | 78 | 54.13.5 | 65 | 58.54.4 | 47 | 51.85.2 | 64 |
| H8+He i | 3889 | 18.63.6 | 36 | 21.42.4 | 28 | 22.83.0 | 21 | 20.63.6 | 25 |
| H7+Ne iii | 3969 | 29.34.4 | 47 | 35.62.9 | 49 | 39.23.7 | 37 | 37.94.4 | 59 |
| H | 4101 | 24.84.0 | 52 | 30.02.6 | 47 | 30.63.3 | 30 | 28.14.0 | 33 |
| H | 4340 | 47.05.3 | 96 | 47.93.1 | 85 | 48.63.8 | 55 | 48.14.9 | 66 |
| O iii | 4363 | 12.33.0 | 30 | 9.71.6 | 18 | 11.32.2 | 16 | 10.92.7 | 16 |
| He i | 4471 | … | … | 4.81.3 | 10 | 6.41.9 | 8 | 4.22.3 | 5 |
| H | 4861 | 100.07.8 | 200 | 100.04.4 | 220 | 100.05.2 | 196 | 100.06.7 | 240 |
| O iii | 4959 | 228.212. | 507 | 222.97.2 | 501 | 223.78.4 | 485 | 217.810. | 619 |
| O iii | 5007 | 685.925. | 1697 | 656.017. | 1419 | 671.418. | 1495 | 625.920. | 1654 |
| He i | 5876 | 8.72.6 | 24 | 12.61.5 | 32 | 10.71.8 | 27 | … | … |
| H | 6563 | 280.015. | 2306 | 289.38.9 | 712 | 285.510. | 723 | 282.713. | 901 |
| N ii | 6583 | 4.21.8 | 27 | 15.31.6 | 39 | 10.21.7 | 35 | 4.91.6 | 32 |
| S ii | 6717 | 5.51.9 | 20 | 9.01.2 | 28 | 10.71.7 | 35 | … | … |
| S ii | 6731 | 6.32.1 | 25 | 8.01.2 | 23 | 6.21.4 | 18 | … | … |
| (H)intc | 0.0000.065 | 0.2680.038 | 0.1720.043 | 0.0840.054 | |||||
| (H)MWd | 0.046 | 0.030 | 0.036 | 0.019 | |||||
| (H)e | 5.00.5 | 32.61.2 | 17.30.9 | 8.10.6 | |||||
| Galaxy | |||||||||
| Line | J11373605 | J11575801 | J13525617 | ||||||
| a | EWb | a | EWb | a | EWb | ||||
| Mg ii | 2796 | 16.73.1 | 20 | 9.24.1 | 8 | 37.24.7 | 16 | ||
| Mg ii | 2803 | 10.92.8 | 13 | 9.54.1 | 8 | 24.84.0 | 11 | ||
| O ii | 3727 | 81.55.2 | 132 | 72.05.8 | 111 | 159.98.6 | 153 | ||
| H12 | 3750 | … | … | 6.72.8 | 21 | … | … | ||
| H11 | 3771 | … | … | 6.42.7 | 22 | … | … | ||
| H10 | 3798 | 5.72.0 | 11 | 9.52.9 | 28 | 4.82.3 | 5 | ||
| H9 | 3836 | 11.12.3 | 23 | 10.62.9 | 31 | 8.02.4 | 9 | ||
| Ne iii | 3869 | 51.54.0 | 103 | 59.65.3 | 70 | 50.34.7 | 47 | ||
| H8+He i | 3889 | 19.42.7 | 43 | 22.63.9 | 39 | 18.23.2 | 17 | ||
| H7+Ne iii | 3969 | 35.53.4 | 81 | 44.54.7 | 50 | 28.73.7 | 27 | ||
| H | 4101 | 26.62.9 | 61 | 31.23.9 | 40 | 25.33.5 | 23 | ||
| H | 4340 | 47.63.6 | 104 | 48.84.5 | 101 | 51.24.4 | 74 | ||
| O iii | 4363 | 13.92.1 | 42 | 15.42.8 | 33 | 9.32.4 | 11 | ||
| He i | 4471 | 3.71.5 | 8 | 5.02.0 | 14 | 5.32.0 | 8 | ||
| H | 4861 | 100.05.1 | 280 | 100.06.0 | 263 | 100.06.0 | 172 | ||
| O iii | 4959 | 210.87.9 | 546 | 226.29.5 | 582 | 212.69.2 | 464 | ||
| O iii | 5007 | 602.215. | 1524 | 647.816. | 1796 | 610.519. | 1136 | ||
| He i | 5876 | 11.81.6 | 33 | 11.62.1 | 50 | 12.62.2 | 36 | ||
| H | 6563 | 286.010. | 2127 | 283.211. | 1109 | 284.612. | 884 | ||
| N ii | 6583 | 16.31.8 | 80 | 5.01.5 | 26 | 19.82.6 | 63 | ||
| S ii | 6717 | 5.91.1 | 42 | 5.51.5 | 30 | … | … | ||
| S ii | 6731 | 5.41.1 | 40 | 4.41.4 | 24 | … | … | ||
| (H)intc | 0.2920.041 | 0.2040.0.047 | 0.1080.049 | ||||||
| (H)MWd | 0.023 | 0.030 | 0.011 | ||||||
| (H)e | 24.20.7 | 13.91.0 | 10.80.8 | ||||||
a=100()/(H), where () and (H) are fluxes of emission lines, corrected for both the Milky Way and internal extinction.
bRest-frame equivalent width in Å.
cInternal galaxy extinction coefficient.
dMilky Way extinction coefficient from the NED.
eExtinction-corrected flux but not corrected for (LyC), in 10-16 erg s-1 cm-2.
| Galaxy | J01300014 | J01420304 | J08445312 | J10145501 |
|---|---|---|---|---|
| (O iii), K | 145301570 | 13370920 | 141201170 | 142601560 |
| (O ii), K | 137201380 | 12940830 | 134601040 | 135501390 |
| (S ii), cm-3 | 10701070 | 353353 | 1010 | 1010 |
| O+/H+105 | 1.250.17 | 1.810.18 | 1.770.20 | 1.160.18 |
| O2+/H+105 | 8.160.42 | 9.800.43 | 8.620.37 | 7.930.43 |
| O/H105 | 9.410.46 | 11.610.46 | 10.390.42 | 9.080.46 |
| 12+log O/H | 7.970.02 | 8.060.02 | 8.020.02 | 7.960.02 |
| N+/H+106 | 0.380.16 | 1.540.17 | 0.930.16 | 0.440.15 |
| ICF(N)a | 6.89 | 5.98 | 5.55 | 7.17 |
| N/H106 | 2.591.23 | 9.191.07 | 5.190.96 | 3.151.17 |
| log N/O | 1.560.21 | 1.100.05 | 1.300.08 | 1.460.16 |
| Ne2+/H+105 | 1.380.23 | 2.060.23 | 1.870.23 | 1.610.26 |
| ICF(Ne)a | 1.05 | 1.07 | 1.08 | 1.05 |
| Ne/H105 | 1.450.24 | 2.200.25 | 2.030.25 | 1.690.27 |
| log Ne/O | 0.810.07 | 0.720.05 | 0.710.06 | 0.730.07 |
| Mg+/H+106 | … | 0.550.09 | 0.680.12 | 0.470.11 |
| ICF(Mg)a | … | 12.14 | 12.26 | 14.31 |
| Mg/H106 | … | 6.551.08 | 8.381.52 | 6.671.58 |
| log Mg/O | … | 1.240.07 | 1.090.08 | 1.130.11 |
| Galaxy | J11373605 | J11575801 | J13525617 | |
| (O iii), K | 161901240 | 164201530 | 134901440 | |
| (O ii), K | 146101040 | 147101280 | 130301300 | |
| (S ii), cm-3 | 450450 | 172172 | 1010 | |
| O+/H+105 | 0.840.08 | 0.710.08 | 2.300.35 | |
| O2+/H+105 | 5.560.10 | 5.781.49 | 8.960.57 | |
| O/H105 | 6.400.13 | 6.490.17 | 11.260.67 | |
| 12+log O/H | 7.810.01 | 7.810.01 | 8.050.03 | |
| N+/H+106 | 1.270.15 | 0.380.12 | 1.960.27 | |
| ICF(N)a | 7.03 | 8.34 | 4.78 | |
| N/H106 | 8.911.10 | 3.161.10 | 9.351.33 | |
| log N/O | 0.860.05 | 1.310.15 | 1.080.07 | |
| Ne2+/H+105 | 1.110.11 | 1.240.14 | 1.860.30 | |
| ICF(Ne)a | 1.05 | 1.04 | 1.12 | |
| Ne/H105 | 1.170.12 | 1.280.15 | 2.080.35 | |
| log Ne/O | 0.740.04 | 0.700.05 | 0.730.08 | |
| Mg+/H+106 | 0.210.04 | 0.120.04 | 0.780.18 | |
| ICF(Mg)a | 13.94 | 15.33 | 9.50 | |
| Mg/H106 | 2.910.54 | 1.800.58 | 7.391.68 | |
| log Mg/O | 1.340.08 | 1.480.14 | 1.180.10 |
aIonization correction factor.