Soham Basu, Sayantan Mukherjee, Ankit Bhattacharya, Anindya Sen
11institutetext: Department of Electronics and Communication Engineering, Heritage Institute of Technology, Kolkata, West Bengal, India,
11email: soham.basu07@gmail.com, anindya.sen@heritageit.edu.in,
22institutetext: Tata Consultancy Services, Kolkata, West Bengal, India
22email: mukherjee.sayantan96@gmail.com, ankub10@gmail.com,
Segmentation of Blood Vessels, Optic Disc Localization, Detection of Exudates and Diabetic Retinopathy Diagnosis from Digital Fundus Images
Abstract
Diabetic Retinopathy (DR) is a complication of long-standing, unchecked diabetes and one of the leading causes of blindness in the world. This paper focuses on improved and robust methods to extract some of the features of DR, viz. Blood Vessels and Exudates. Blood vessels are segmented using multiple morphological and thresholding operations. For the segmentation of exudates, k-means clustering and contour detection on the original images are used. Extensive noise reduction is performed to remove false positives from the vessel segmentation algorithm’s results. The localization of Optic Disc using k-means clustering and template matching is also performed. Lastly, this paper presents a Deep Convolutional Neural Network (DCNN) model with 14 Convolutional Layers and 2 Fully Connected Layers, for the automatic, binary diagnosis of DR. The vessel segmentation, optic disc localization and DCNN achieve accuracies of 95.93%, 98.77% and 75.73% respectively. The source code and pre-trained model are available here.
keywords:
image processing, artificial intelligence, image segmentation, deep learning, convolutional neural network, image classification, template matching, diabetic retinopathy, blood vessels, exudates, optic disc, fundus images.1 Introduction
1.1 Diabetic Retinopathy
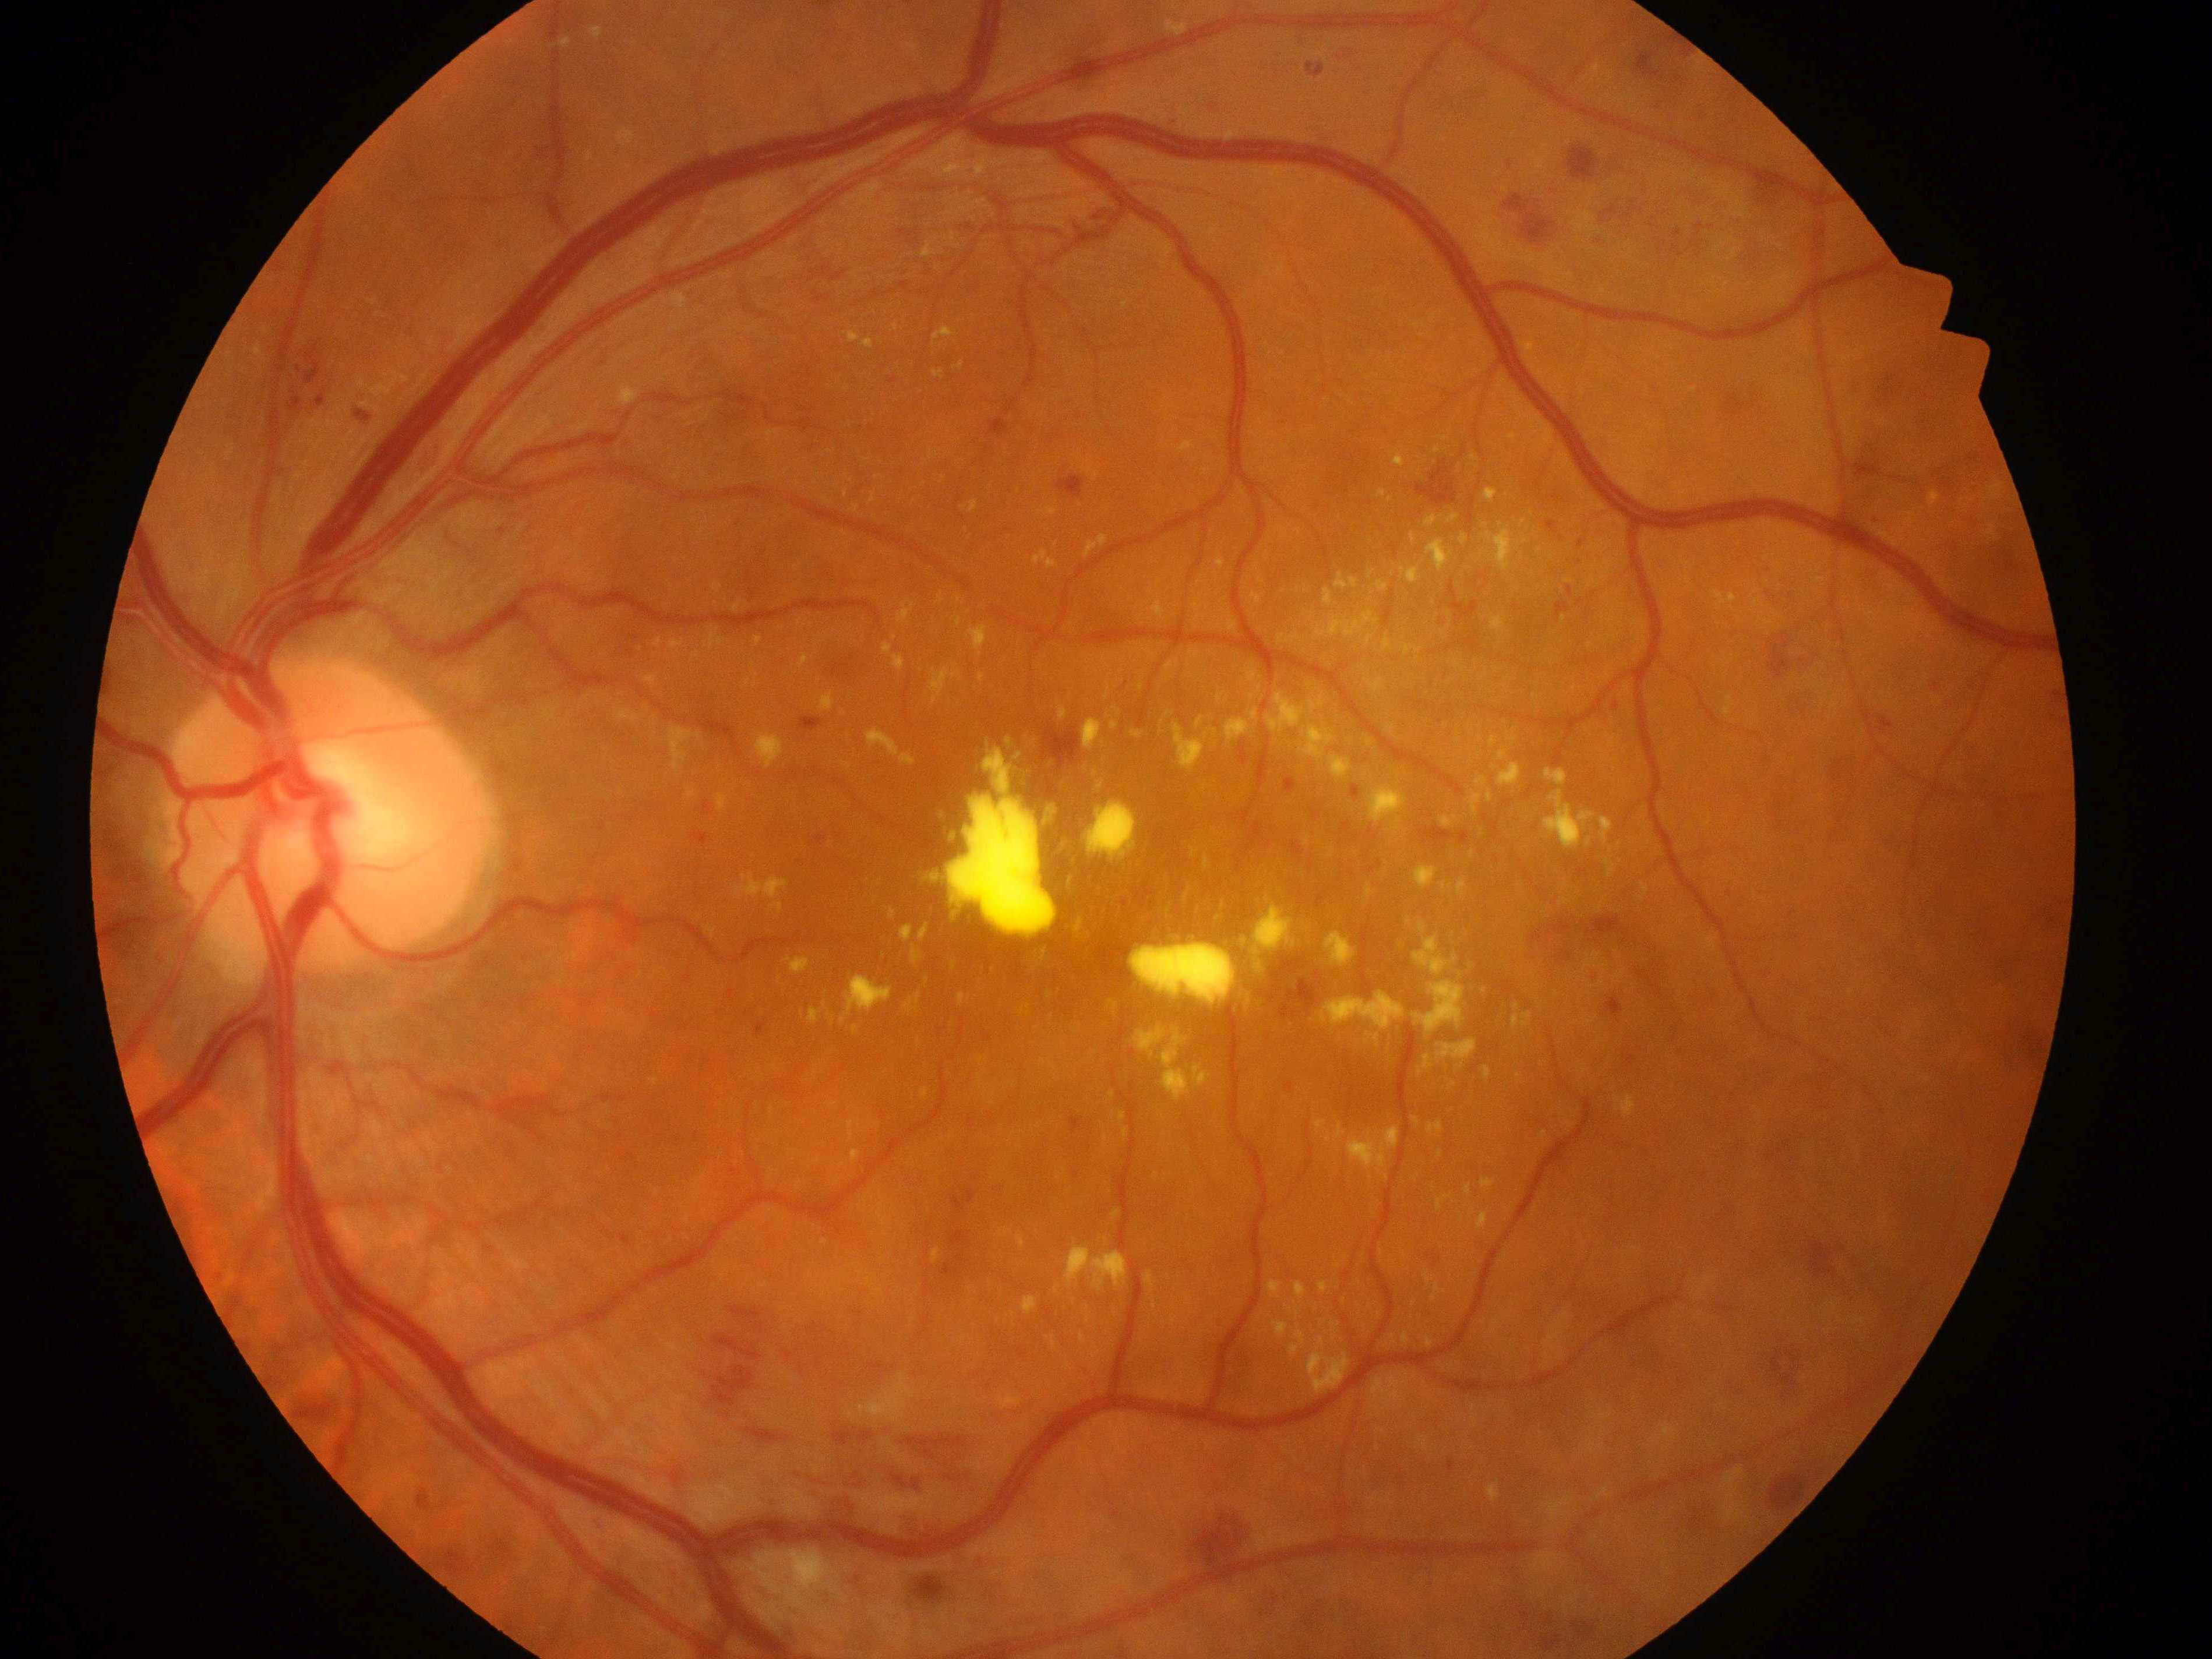
Diabetic Retinopathy is a direct consequence of prolonged, unchecked diabetes, wherein the retinal blood vessels get damaged and leak fluid into the retina. If left untreated, DR can eventually lead to total blindness. DR can be classified as: Mild, Moderate, Severe and Proliferative Diabetic Retinopathy (PDR). These stages can be identified by the presence and extent of certain features (Fig. 1).
5pt
0.57(0.22,0.86) This is an Author Accepted Manuscript of the following chapter: Soham Basu, Sayantan Mukherjee, Ankit Bhattacharya, Anindya Sen, Segmentation of Blood Vessels, Optic Disc Localization, Detection of Exudates and Diabetic Retinopathy Diagnosis from Digital Fundus Images, published in Proceedings of Research and Applications in Artificial Intelligence, edited by Indrajit Pan, Anirban Mukherjee, Vincenzo Piuri, 2021, Springer reproduced with permission of Springer Nature Singapore Pte Ltd. 2021. The final authenticated version is available online at: https: //dx.doi.org/10.1007/978-981-16-1543-6_16 Users may only view, print, copy, download and text- and data-mine the content, for the purposes of academic research. The content may not be (re-)published verbatim in whole or in part or used for commercial purposes. Users must ensure that the author’s moral rights as well as any third parties’ rights to the content or parts of the content are not compromised.

1.2 Motivation
Ophthalmologists identify Diabetic Retinopathy based on certain features viz. blood vessel area, soft and hard exudates, hemorrhages, cotton wool spots and microaneurysms. Automatic extraction of these features from fundus images help in the quick and early diagnosis of DR. Proliferative Diabetic Retinopathy is easily identified by studying the abnormal pattern of retinal blood vessels.
1.3 Proposed Method
The proposed algorithm utilizes the structure and contrast of the darker blood vessels with respect to the brighter background, and aims to efficiently and accurately segment the vessels from retinal fundus images. Next, the structural profile of the Optic Disc is used to generate a template and the images are matched with this template to calculate the similarity between the two. The exudates detection method performs k-means clustering to cluster the different intensities in the original image, and extract the pixels with the highest intensities. Finally, the proposed DCNN employs 14 convolutional layers to generate feature maps from images and predict the correct labels for the diagnosis of DR.
2 Background
Wang et al.[1] demonstrated the use of two classifiers – Convolutional Neural Network (CNN) and Random Forest (RF), which can automatically learn features from raw images and predict patterns, by combining feature learning and traditional learning. Zhang et al. [2] proposed an algorithm which classifies vessel pixels using a texton dictionary. It focused more on the thin vessel regions which increased its sensitivity. However, non-vessel pixels may be recognized as vessel pixels, thereby decreasing accuracy and specificity. Singh and Srivastava [3] used entropy-based optimal thresholding and length filtering, while Al-Diri et al. [4] used active contours.
Abbadi et al. [5] used the grey levels of the Optic Disc (OD) to approximate its boundary. Abdullah and Fraz [6] used grow-cut, Mary et al. [7] used active contours and Marin et al. [8] used thresholding on morphologically transformed images. Some use the green channel, the red channel or a combination of both. These algorithms fail due to the poor contrast of the OD or saturation due to overexposure in the red channel. Besides, the shapes and sizes of exudates may often be comparable to that of the OD.
Liu et al. [9] used thresholding and region growing to detect exudates. Long et al. [10] used Dynamic Thresholding and SVM Classification, while Ege et al. [11] used Bayesian, Mahalanobis and nearest neighbor classifiers for the same.
Lam et al. [12] proposed the concept of transfer learning using pre-trained neural networks like GoogLeNet and AlexNet from ImageNet. Pratt et al. [13] proposed another CNN model which was trained using Kaggle’s DR database. However, it could only be trained on a high-end GPU to achieve acceptable results.
3 Materials and Methods
3.1 Hardware and Libraries
All the algorithms proposed in this paper were written in Python (version 3.6.9) using OpenCV and Scikit-learn libraries in Jupyter notebooks [14], [15]. TensorFlow Keras was used to build the DCNN for DR diagnosis. The Jupyter notebooks were executed on virtual machines provided by Google Colaboratory (standard runtime) which consist of Intel® Xeon single core, 2.3 GHz CPUs and around 12.5 GB of available RAM. The DCNN was trained on the GPU runtime, with a single Tesla K80 GPU.
3.2 Datasets
For the Blood Vessel Segmentation, we have used the DRIVE dataset [16] . It is an openly available dataset consisting of 40 images of size 565 × 584 pixels, split equally among training and test sets. Thirty three out of forty images are without signs of DR and seven images are with the signs of DR. The proposed method has been evaluated on the test set and reported in this paper. The IDRiD [17] Segmentation dataset was used for the Localization of the Optic Disc and detection of hard exudates. It is a publicly available dataset consisting of 81 images of 4288 × 2848 pixels each, split into training and tests sets of 54 and 27 images respectively. The IDRiD Disease Grading dataset was used for training and testing the DCNN for the diagnosis of Diabetic Retinopathy. It is also a publicly available dataset consisting of 516 images, split into training and test sets of 413 and 103 images respectively.
3.3 Proposed Methods
3.3.1 Blood Vessel Segmentation
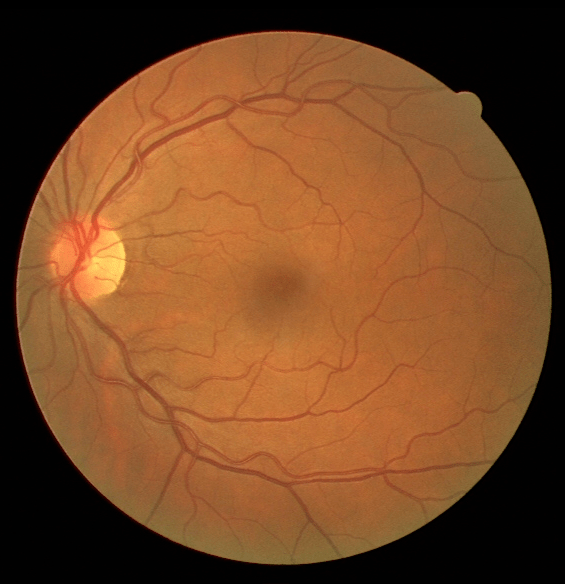
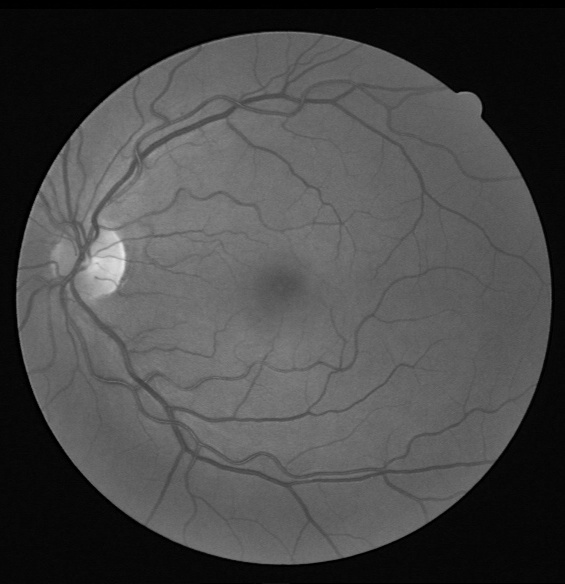
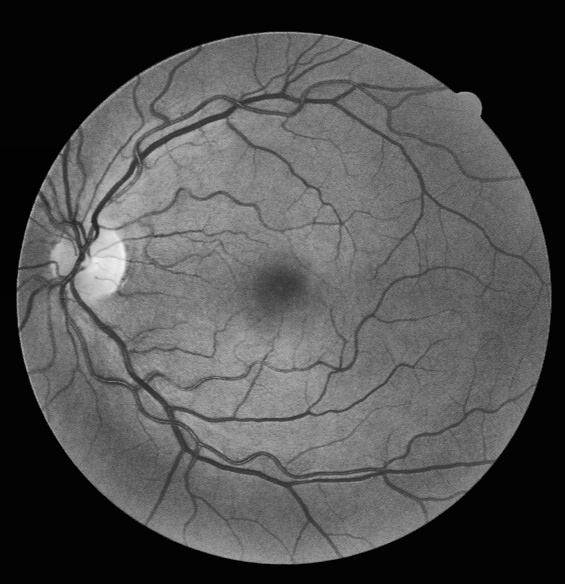
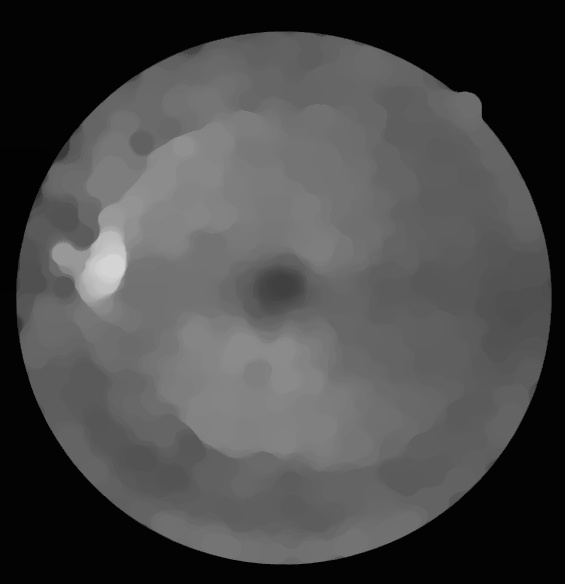
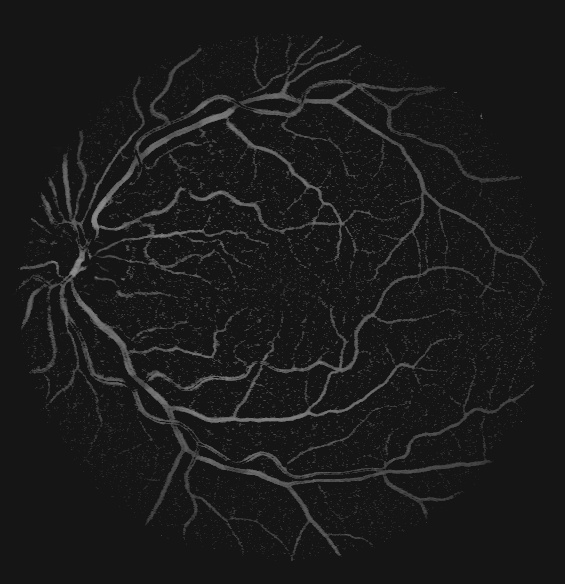
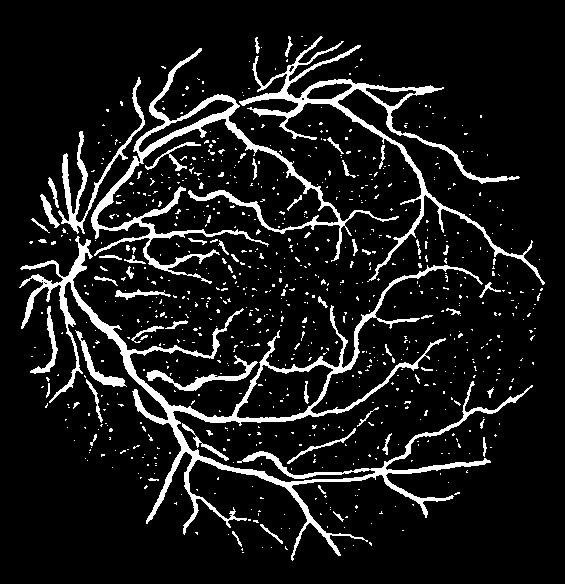
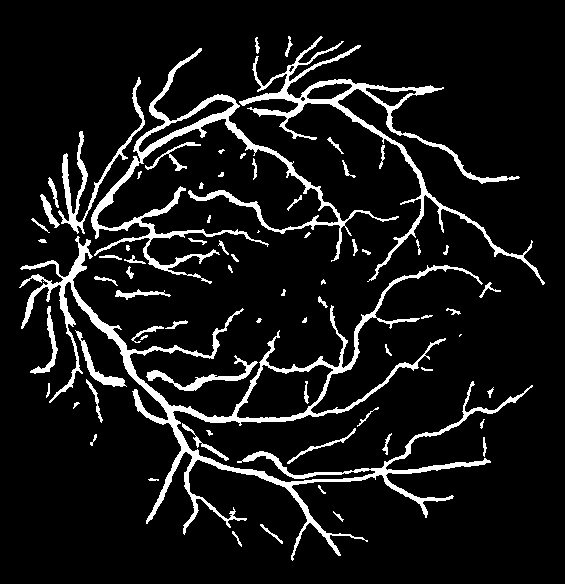
The green channel of the original RGB image (Fig. 2(b)) was selected because the retina is most sensitive to the green wavelength of light and the vessels have the best contrast in the green channel. Contrast Limited Adaptive Histogram Equalization (CLAHE) was applied to the green channel image to create better local contrast of the vessel pixels (Fig. 2(c)). The image was passed through four iterations of Alternate Sequential Filtering, where elliptical kernels of sizes (5, 5), (7, 7), (15, 15), (11, 11) were applied to the respective iterations (Fig. 2(d)). The result was subtracted from the image in Fig. 2(c) to generate a rough outline of the vessels, removing the background features. CLAHE was applied a second time to create an even better contrast against most other background features (Fig. 2(e)). The image was then passed through a Median Filter with a kernel size of (3, 3) to filter out salt and pepper noise. Thresholding was done based on the average intensity value (Fig. 2(f)). Contour detection was then performed to remove larger, isolated blobs. This yields the final segmented vessels in Fig. 2(g). The algorithm’s steps are shown in Fig. 3.
Contour Detection
Contour detection employs Green’s theorem. If is a simple, closed curve, is the plane enclosed by , and are functions of defined on an open region containing (given that their partial derivatives exist in that region), then Green’s theorem can be stated as:
| (1) |
where the path of integration along the curve is counterclockwise.

3.3.2 Localization of Optic Disc
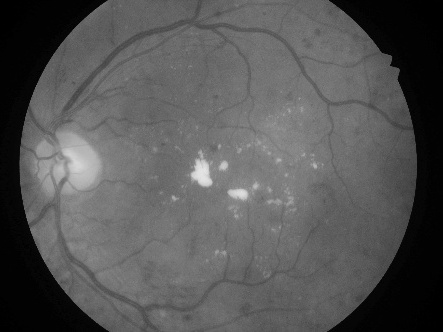
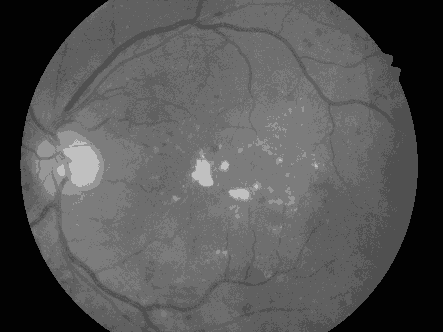
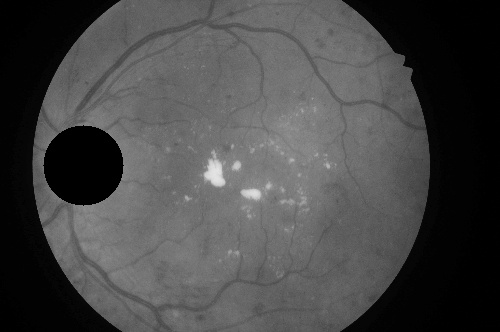
The proper localization of the OD is an essential step in the segmentation of exudates from fundus images, because of the comparable grey intensity levels of the OD and the exudates. The only difference is the irregular structure and (usually) smaller sizes of the exudates. The proposed method resized a coloured fundus image to 300 × 300 pixels and performed k-means clustering on its grayscale counterpart (Fig. 4(c)). The k-means algorithm minimizes the squared difference between ‘k’ colour centres (or means) and the respective pixel values (colour values) in the image. If is the colour center and is the colour value of the pixel in the image, then the squared error function to be minimized by k-means is given by:
| (2) |
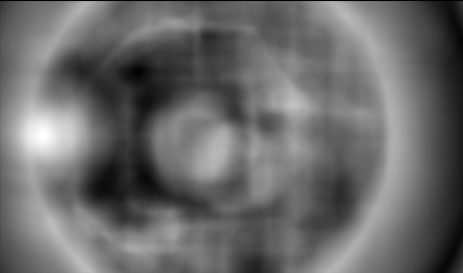
A template of size comparable to the average size of the OD in all the images was generated (Fig. 4(d)) and matched with the image, using the Normalized Correlation Coefficient (NCCOEFF) method (Fig. 4(e)). NCCOEFF is computed as:
| (3) |
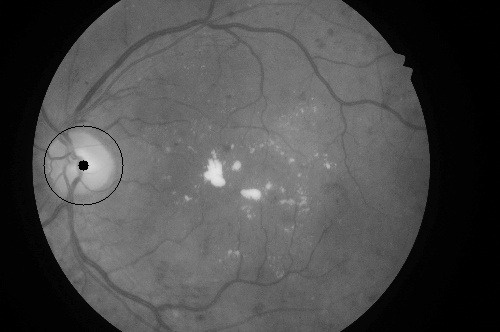
The location of maximum values from the template-matched result was extracted. This indicates the approximate center of the Optic Disc in the image (Fig. 4(f)). The algorithm’s steps are shown in Fig. 5.


3.3.3 Detection of Exudates
Exudates are small, yellowish deposits located on the outer layers of the retina, formed as a result of protein leakage from the retinal vessels.
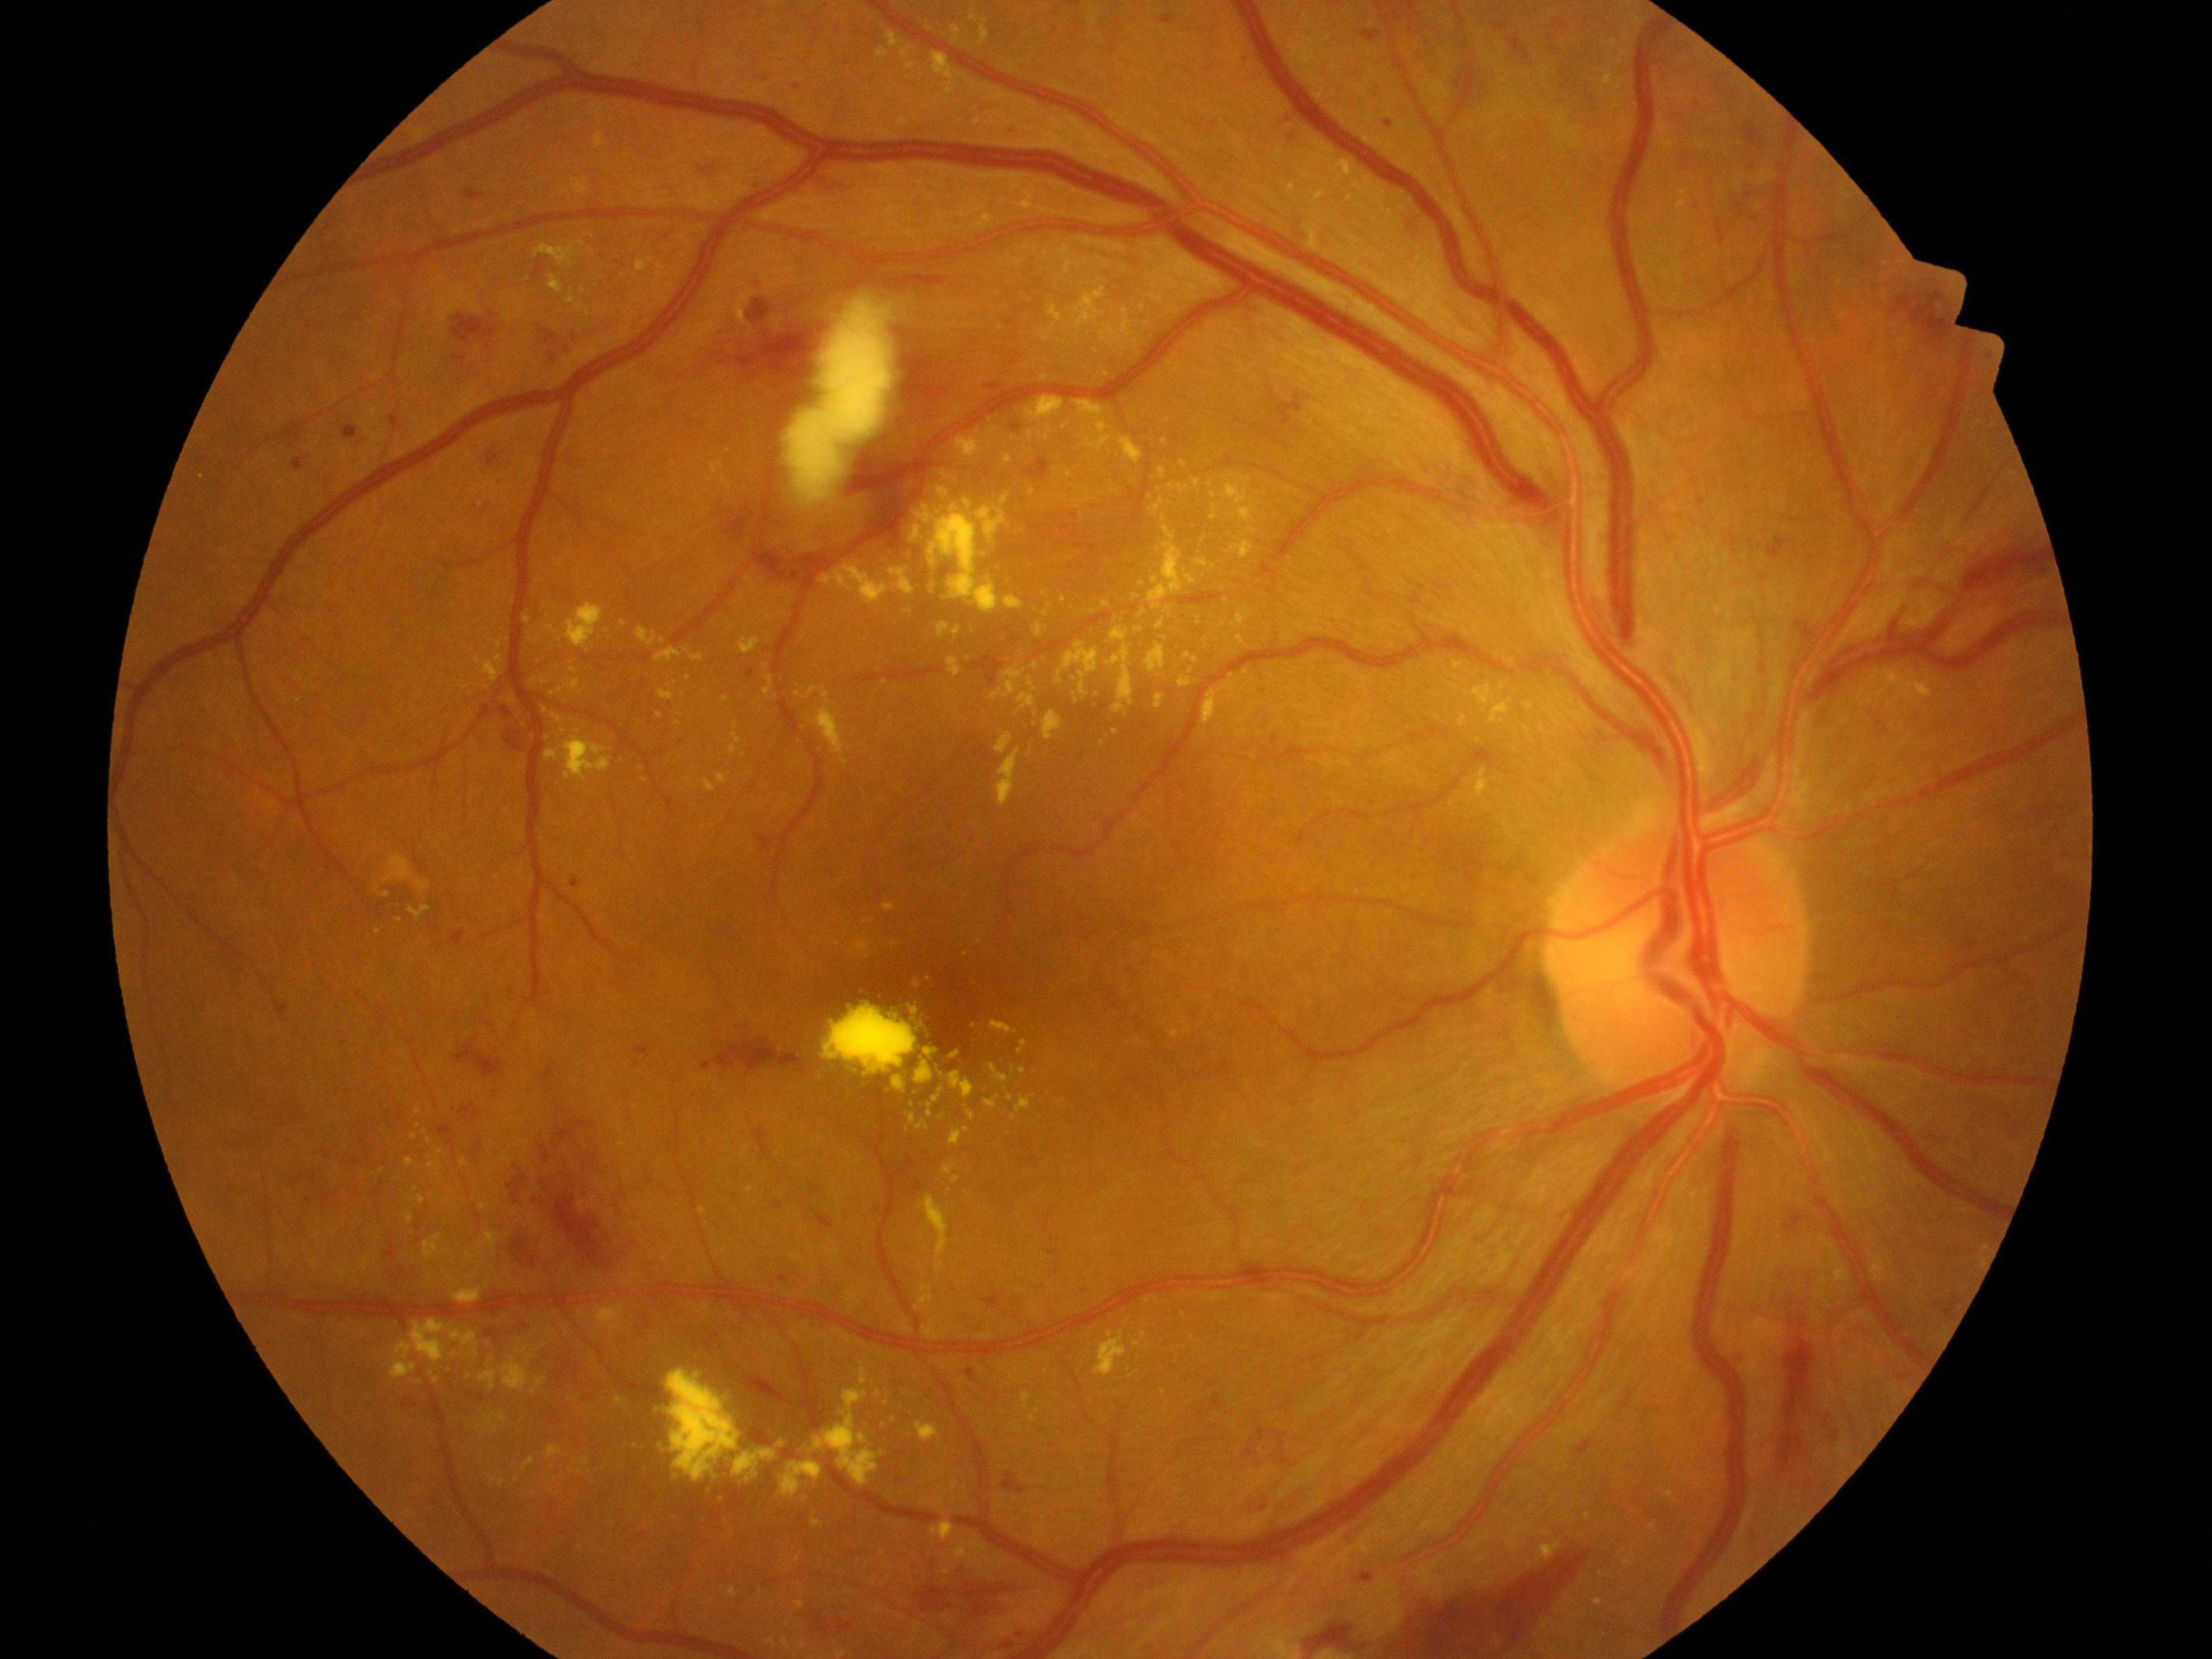
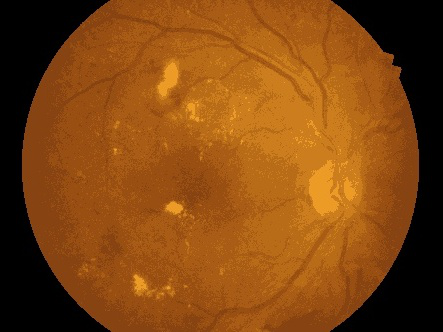
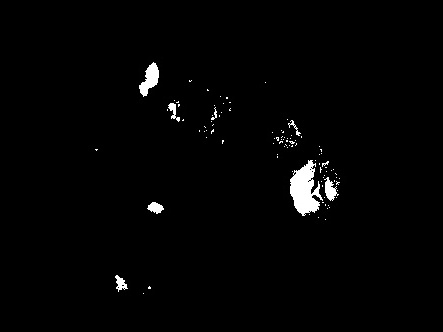
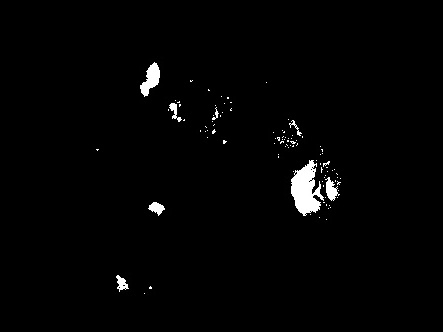
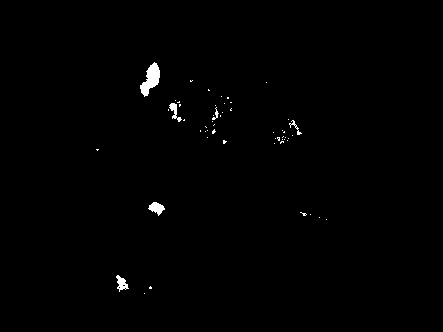
Initially, k-means clustering was performed on the original image (Fig. 6(b)), and the cluster with the highest intensities was extracted and binarized. This extracts the exudates (including the largest ones) along with the OD (Fig. 6(c)). Canny Edge [18] and Contour detection were then sequentially performed on the green channel image to filter out large structures. Thresholding was applied to create a binary image, where the pixels with maximum grey level intensities were considered. This extracts the small exudates with the OD. The images containing the small and large exudates were then logically added (Fig. 6(d)). The OD was detected in the grayscale image using the aforementioned method, and a circular, black mask was placed over it, in the image in Fig. 6(d). This yields the final segmentation result (Fig. 6(e)). The algorithm’s steps are shown in Fig. 7.

3.3.4 Binary Diagnosis of Diabetic Retinopathy using Deep Convolutional Neural Network.
The following DCNN was developed for the binary classification of DR.

The proposed DCNN architecture was adapted from the VGG-16 [19] architecture and improvised to perform DR diagnosis. It is composed of 4 stages of convolutional layers (Fig. 8) with a 2x2 2D Max Pooling layer between each stage, which downsamples the input image by a factor of 2. In each convolutional layer, small 3×3 sized kernels were used with Rectified Linear Unit (ReLU) as the activation function.
| (4) |
The original, coloured images are resized to 300×300 pixels, and trained with a batch size of 8. The output of the final convolutional stage is fed to a fully connected layer with 1024 neurons and the ReLU activation function. The final layer is a single neuron with the Sigmoid activation function for binary classification, which is given by:
| (5) |
To optimize the network, the Adam [20] optimizer was chosen having a learning rate of 0.0001 along with a Binary Cross-Entropy loss , which can be computed as:
| (6) |
where is the actual label, p() is the predicted probability of and is the number of training/test examples.
4 Experimental Results
4.1 Segmentation of Blood Vessels

| Accuracy(%) | Specificity(%) | Sensitivity(%) | Dice Coefficient |
| 95.93 | 98.32 | 71.19 | 0.75 |
4.2 Localization of Optic Disc
The proposed Optic Disc Localization algorithm could accurately locate the OD in 80 of the 81 images in the whole dataset, achieving an accuracy of 98.77%.

4.3 Detection of Exudates
The proposed algorithm was able to identify exudates in all the 81 images in the IDRiD Segmentation dataset quite appreciably.


4.4 Binary Diabetic Retinopathy Diagnosis
The proposed model achieved a maximum training accuracy of 99.27% over 100 epochs. The optimal accuracy on the test set was found to be 75.73%.

5 Conclusions
The proposed blood vessel segmentation method performs better than most of the available segmentation techniques. It utilizes simple yet highly efficient morphological operations that perform background estimation and segmentation with more precision over existing methods. However, DCNNs are not as prone to noise and usually have higher sensitivity than image processing methods.
| Method | Year | Accuracy (%) | Specificity(%) | Sensitivity(%) |
|---|---|---|---|---|
| Azzopardi et al. [21] | 2015 | 94.42 | 97.05 | 76.55 |
| Roychowdhury et al. [22] | 2015 | 95.20 | 98.30 | 72.50 |
| GeethaRamani et al. [23] | 2016 | 95.36 | 97.78 | 70.79 |
| Christodoulidis et al. [24] | 2016 | 94.79 | 95.82 | 85.06 |
| U-net [25] | 2018 | 95.31 | 98.20 | 75.37 |
| R2U-net [25] | 2018 | 95.56 | 98.16 | 77.51 |
| LadderNet [26] | 2018 | 95.61 | 98.10 | 78.56 |
| BCDU-Net [27] | 2019 | 95.60 | 97.86 | 80.07 |
| Sun et al. [28] | 2020 | 95.45 | 97.41 | 82.09 |
| Proposed method | 2020 | 95.93 | 98.32 | 71.19 |
Methods that relied on the intensity levels of the OD, often fail to correctly locate it when the exudates have comparable grey level intensities. The proposed method is very efficient in locating the OD accurately, as it relies on the size and structure of the OD, instead of its grey level intensity. However, it may fail to distinguish between the OD and a large exudate, when the size of the latter is comparable to that of the OD.
Our exudates detection algorithm extracts not only the largest exudates but also the smaller ones because of the contour detection stage at the end. But the algorithm may generate false positives if the images are very unevenly illuminated.
The proposed DCNN architecture takes about an hour to train on Google Colab and has a test accuracy of 75.73%, which is better than most of the previous architectures. However, the biggest advantage of the proposed architecture over existing networks is the significantly lower training time taken to produce acceptable results.
References
- [1] Wang, S. et al.: “Hierarchical retinal blood vessel segmentation based on feature and ensemble learning.” Neurocomputing 149: 708-717 (2015).
- [2] Zhang, L., Fisher, M., Wang, W.: Retinal vessel segmentation using multi-scale textons derived from keypoints. Comput Med Imaging Graph. 45:47–56 (2015).
- [3] Singh, N.P., Srivastava R.: Retinal blood vessels segmentation by using Gumbel probability distribution function based matched filter. Comput Methods Programs Biomed (2016).
- [4] Al-Diri, B., Hunter, A., Steel, D.: An active contour model for segmenting and measuring retinal vessels. IEEE Trans Med Imaging. 28(9):1488–97 (2009).
- [5] Abbadi, N.K., Al-Saadi, E.H.: Automatic Detection of Exudates in Retinal Images (2013).
- [6] Abdullah, M. et al.: Localization and segmentation of optic disc in retinal images using circular Hough transform and grow-cut algorithm. PeerJ; 4: e2003 (2016).
- [7] Mary, M.C.V.S. et al. An empirical study on optic disc segmentation using an active contour model. Biomedical Signal Processing and Control. 18:19–29 (2015).
- [8] Marin, D., Gegundez-Arias, M.E., Suero, A., Bravo, J.M.: Obtaining optic disc center and pixel region by automatic thresholding methods on morphologically processed fundus images. Comput Methods Programs Biomed. 118(2):173-185 (2015).
- [9] Liu, Z., Chutatape, O., Krishna, S.M.: Automatic image analysis of fundus photograph. IEEE Conference on Engineering in Medicine and Biology, vol. 2, pp. 524–525, 1997.
- [10] Long, S., Huang, X., Chen, Z., Pardhan, S., Zheng D.: Automatic Detection of Hard Exudates in Color Retinal Images Using Dynamic Threshold and SVM Classification: Algorithm Development and Evaluation (2019).
- [11] Ege, B. M. et al.: Screening for diabetic retinopathy using computer-based image analysis and statistical classification. Comput. Meth. Programs Biomed. 62(3):165–175 (2000).
- [12] Lam, C.K. et al.: Automated Detection of Diabetic Retinopathy using Deep Learning. AMIA Summits on Translational Science Proceedings, 2018, 147 - 155 (2018).
- [13] Pratt, H. et al: Convolutional Neural Networks for Diabetic Retinopathy. In Procedia Computer Science, vol. 90, pp. 200–205. Elsevier B.V. (2016).
- [14] Bradski, G.: The OpenCV Library. Dr. Dobb’s Journal of Software Tools (2000).
- [15] Pedregosa, et al.: Scikit-learn: Machine Learning in Python. JMLR 12 (2011).
- [16] Digital Retinal Images for Vessel Extraction (DRIVE). Available at: http:// www.isi.uu.nl/Research/Databases/DRIVE, last accessed 2020/09/12.
- [17] Porwal, P. et al.: Indian Diabetic Retinopathy Image Dataset (IDRiD). Available at: http://dx.doi.org/10.21227/H25W98, last accessed 2020/09/12.
- [18] Canny, J.: A computational approach to edge detection. Pattern Analysis and Machine Intelligence, IEEE Transactions on, (6):679–698 (1986).
- [19] Simonyan, K., Zisserman, A.: Very Deep Convolutional Networks for Large-Scale Image Recognition. CoRR. ArXiv: 1409.1556 [cs] (2015).
- [20] Kingma, D.P., Ba, J.: Adam: A Method for Stochastic Optimization. CoRR. ArXiv: 1412.6980 (2015).
- [21] Azzopardi, G. et al.: Trainable cosfire filters for vessel delineation with application to retinal images. Medical image analysis, 19(1):46–57 (2015).
- [22] Roychowdhury, S. et al.: Blood vessel segmentation of fundus images by major vessel extraction and subimage classification. IEEE J Biomed Health Inform. 19:1118–28 (2015).
- [23] GeethaRamani, R., Balasubramanian, L.: Retinal blood vessel segmentation employing image processing and data mining techniques for computerized retinal image analysis.Biocybern Biomed Eng. 36:102–18 (2016).
- [24] Christodoulidis, A. et al.: A multi-scale tensor voting approach for small retinal vessel segmentation in high resolution fundus images. Comput Med Imaging Graph (2016).
- [25] Md Zahangir Alom et al.: Recurrent residual convolutional neural network based on u-net (r2u-net) for medical image segmentation (2018).
- [26] Zhuang, J.: LadderNet: Multi-path networks based on U-Net for medical image segmentation. ArXiv: 1810.07810 [cs] (2018).
- [27] Azad, R. et al.: Bi-Directional ConvLSTM U-Net with Densely Connected Convolutions. International Conference on Computer Vision (2019).
- [28] Sun, X. et al.: Robust Retinal Vessel Segmentation from a Data Augmentation Perspective. ArXiv: 2007.15883 [eess] (2020).