Chemical Abundances of the Typhon Stellar Stream††thanks: This paper includes data gathered with the 6.5 meter Magellan Telescopes located at Las Campanas Observatory, Chile.
Abstract
We present the first high-resolution chemical abundances of seven stars in the recently discovered high-energy stream Typhon. Typhon stars have apocenters kpc, making this the first detailed chemical picture of the Milky Way’s very distant stellar halo. Though the sample size is limited, we find that Typhon’s chemical abundances are more like a dwarf galaxy than a globular cluster, showing a metallicity dispersion and no presence of multiple stellar populations. Typhon stars display enhanced -element abundances and increasing -process abundances with increasing metallicity. The high- abundances suggest a short star formation duration for Typhon, but this is at odds with expectations for the distant Milky Way halo and the presence of delayed -process enrichment. If the progenitor of Typhon is indeed a new dwarf galaxy, possible scenarios explaining this apparent contradiction include a dynamical interaction that increases Typhon’s orbital energy, a burst of enhanced late-time star formation that raises [/Fe], and/or group preprocessing by another dwarf galaxy before infall into the Milky Way. Alternatively, Typhon could be the high-energy tail of a more massive disrupted dwarf galaxy that lost energy through dynamical friction. We cannot clearly identify a known low-energy progenitor of Typhon in the Milky Way, but 70% of high-apocenter stars in cosmological simulations are from high-energy tails of large dwarf galaxies. Typhon’s surprising combination of kinematics and chemistry thus underscores the need to fully characterize the dynamical history and detailed abundances of known substructures before identifying the origin of new substructures.
keywords:
stars: abundances – Galaxy: halo – Galaxy: kinematics and dynamics – Local Group – nuclear reactions, nucleosynthesis, abundances1 Introduction
The Milky Way galaxy’s stellar halo is expected to be full of stellar streams from accreted dwarf galaxies (e.g. Bullock & Johnston, 2005; Helmi, 2020). A few dwarf galaxy streams were discovered in early surveys of the Milky Way’s stellar halo (Helmi et al., 1999; Majewski et al., 2003), and the number of stellar streams grew rapidly (Belokurov et al., 2006; Grillmair, 2009; Bernard et al., 2016; Shipp et al., 2018) with the advent of deep photometric surveys like the Sloan Digital Sky Survey (York et al., 2000), Pan-STARRS (Chambers et al., 2016), and the Dark Energy Survey, (Dark Energy Survey Collaboration et al., 2016) though many of these are from tidally disrupting globular clusters. The number of streams and their full 6D dynamical characterization has recently exploded (Price-Whelan & Bonaca, 2018; Shipp et al., 2019; Ibata et al., 2019, 2021; Li et al., 2019, 2022; Mateu, 2022) due to precise and all-sky astrometry from the Gaia satellite (Gaia Collaboration et al., 2016; Lindegren et al., 2021; Katz et al., 2022; Gaia Collaboration et al., 2022). Due to Gaia’s relatively bright magnitude limit, most of the stellar streams are very close to the Sun, though streams initially identified just with deep photometry tend to be found at larger distances (Bonaca et al., 2021; Li et al., 2022; Martin et al., 2022; Malhan et al., 2022).
Recently, a new candidate dwarf galaxy stream on a high-energy polar orbit named Typhon was discovered in the Gaia DR3 radial velocity sample (Tenachi et al., 2022; Dodd et al., 2022). Typhon stars have apocenters above 100 kpc, some of the most distant apocenters known in the Galaxy. Tenachi et al. (2022) used metallicities of seven Typhon stars in LAMOST (Wang et al., 2022) to show it is likely a dwarf galaxy, though the result depended primarily on a single metal-poor star in the system. Other than the Sgr stream, most known dwarf galaxy streams have apocenters kpc, so Typhon may be providing one of the first glimpses of the disrupted dwarf galaxy population of the outer halo, filling in a current dearth of dwarf galaxy streams with large apocenters that are expected in an unbiased stream population (Li et al., 2022). Despite its large apocenter, Typhon is also one of the closest dwarf galaxy stream candidates discovered to date with a galactocentric pericenter of about 6 kpc and all known member stars within 5 kpc of the sun (Tenachi et al., 2022; Dodd et al., 2022). Thus, its stars are easily amenable to high-resolution spectroscopic followup, in contrast to direct chemical studies of the outer halo that require a very large investment of observing time (e.g. Battaglia et al., 2017; Hill et al., 2019). In general, theoretical expectations for outer halo dwarf galaxies is that they should have accreted at relatively late times to retain large apocenters (e.g. Rocha et al., 2012) and thus have low -element abundances because their star formation was not quenched until recently (e.g. Johnston et al., 2008).
Here we present the first chemical abundances derived from high-resolution spectroscopy of the Typhon stream. Our goals are to confirm that Typhon’s progenitor is a dwarf galaxy and not a globular cluster, to study the chemical evolution of Typhon, and to understand its physical origin. Section 2 describes the observations and abundance analysis. Section 3 shows the chemical abundances of Typhon compared to globular clusters and dwarf galaxies, where we find Typhon is relatively -rich. We discuss formation scenarios for Typhon and conclude in Section 4.
| source_id | RA | Dec | SNR | SNR | [M/H] | ||||||||
|---|---|---|---|---|---|---|---|---|---|---|---|---|---|
| h:m:s | d:m:s | 4500Å | 6500Å | K | K | cgs | cgs | ||||||
| 3913243629368310912 | 11:53:15.8 | 10:37:44.5 | 79 | 140 | 4710 | 112 | 1.50 | 0.22 | 1.88 | 0.26 | 0.22 | ||
| 3891712266823336192 | 12:07:27.4 | 01:40:48.0 | 71 | 121 | 4725 | 114 | 1.25 | 0.21 | 1.77 | 0.25 | 0.22 | ||
| 1765600930139450752 | 21:49:48.6 | 10:48:42.9 | 105 | 184 | 4755 | 102 | 1.55 | 0.20 | 1.45 | 0.21 | 0.20 | ||
| 3736372993468775424 | 13:11:51.4 | 11:17:22.0 | 70 | 110 | 4835 | 110 | 1.85 | 0.21 | 1.50 | 0.24 | 0.22 | ||
| 3793377208170393984 | 11:33:56.8 | 02:28:21.0 | 58 | 86 | 5355 | 115 | 1.80 | 0.21 | 2.34 | 0.24 | 0.21 | ||
| 3573787693673899520 | 12:04:03.9 | 13:22:10.4 | 45 | 62 | 5810 | 121 | 3.45 | 0.22 | 1.47 | 0.24 | 0.22 | ||
| 3939346894405032576 | 13:20:03.0 | 19:41:41.9 | 34 | 46 | 6050 | 167 | 3.70 | 0.22 | 1.55 | 0.28 | 0.24 |
2 Observations and Abundance Analysis
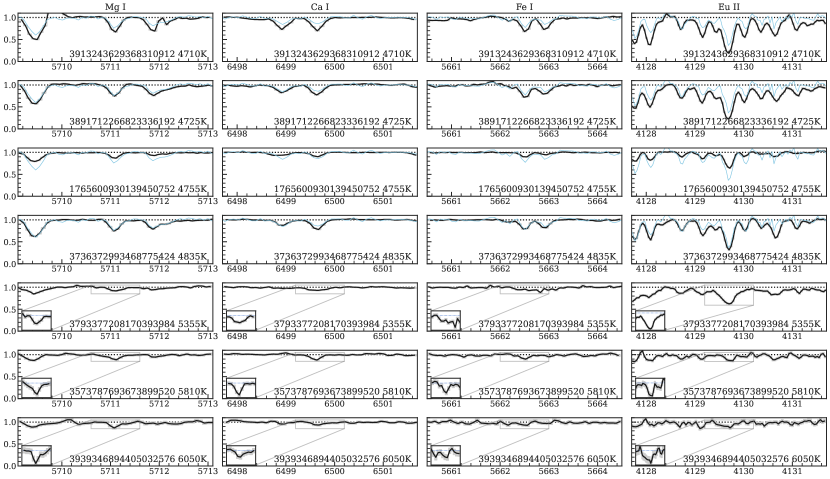
We selected all seven Typhon member stars from Tenachi et al. (2022) that could be observed from Las Campanas Observatory during a recent observing run. We will refer to these stars by their full Gaia DR3 source IDs, but the reader can track the stars through the paper with the first four digits of the source ID, which are unique across the seven target stars. High-resolution spectra were obtained on 28 Jun 2022 with the 07 slit on Magellan/MIKE (Bernstein et al., 2003). The exposure time was 20 minutes per star. Data were reduced using MIKE reduction pipeline111https://code.obs.carnegiescience.edu/mike in the CarPy software package (Kelson, 2003). Radial velocities and heliocentric corrections were found using smhr 222https://github.com/andycasey/smhr (Casey et al., 2014). The stars and radial velocities are given in Table 1. The formal cross correlation radial velocity uncertainties are 0.1-0.2 , but past experience has shown that slit centering and wavelength calibration sets a uncertainty floor that we have not attempted to address here (Ji et al., 2020b). Examples of the spectra are shown in Figure 1.
Comparing the observed velocities to the Gaia DR3 radial velocity of , we found star 1765600930139450752 to clearly have velocity variability, differing by 24.4 compared to the MIKE velocity of . This is rather suspicious, as star 1765600930139450752 is the most metal-poor star in Typhon by a wide margin, and we will rely heavily on the membership of this star in Typhon for our interpretation. However, the velocity difference is not large enough to affect this star’s membership in Typhon. The Gaia DR3 nss_two_body_orbit table gives a binary solution using 24 observations for a period of days, center of mass velocity of , and semi-amplitude . Recomputing the orbits with this center of mass (CM) velocity in gala (Price-Whelan, 2017; Price-Whelan et al., 2020) did not result in a substantially different orbit compared to the Gaia DR3 radial velocity (as expected, since the total CM velocity of changes by 5%). The CM apocenter and pericenter are 163 kpc and 4.9 kpc, compared to 173 kpc and 4.9 kpc when using the DR3 velocity. Thus, we concur with Tenachi et al. (2022) that there is no reason to doubt that this star is part of Typhon.
We normalized and stitched the spectral orders and measured equivalent widths with smhr. To speed up the normalization and equivalent width measurement, we used Payne4MIKE (Ting et al. 2019, Ji et al., in prep), which does a full spectrum fit to the MIKE data. Payne4MIKE eventually aims to infer , , [M/H], [/Fe], and rotational velocity; but we did not use the fitted stellar parameters as they are not yet calibrated. However, the best-fitting Payne4MIKE spectrum is still very useful for identifying where absorption lines should occur. We thus used the best-fit synthetic spectrum to initialize smhr files masking significant absorption lines. For equivalent widths, we adopted the line list from Ji et al. (2020a), which was used to analyze seven other stellar streams. Except for a few specific elements, we removed all lines with Å, as the Typhon stars are all relatively metal-rich compared to the stars in Ji et al. (2020a), so for most species there was no need to use lines below 4500Å where increased blending, more difficult continuum placement, and lower S/N made accurate analysis more difficult. Equivalent widths of lines were fit with Gaussian profiles and carefully inspected in smhr. Lines requiring Voigt profile fits were rejected.
Spectroscopic stellar parameters were determined using the -enhanced Castelli & Kurucz (2003) model atmospheres and the radiative transfer code MOOG including scattering opacity (Sneden, 1973; Sobeck et al., 2011)333https://github.com/alexji/moog17scat that assumes Local Thermodynamic Equilibrium (LTE). Effective temperature () was found by balancing Fe I abundance against excitation potential, surface gravity () was found by balancing Fe I and II abundances, and microturbulence () was found by balancing Fe II abundance vs reduced equivalent width. We used Fe II abundances to determine microturbulence, both because they are safe from non-LTE effects, and because our good Fe II lines spanned a larger range of reduced equivalent widths compared to the Fe I lines in the observed red giants (Ji et al., 2020a). Stellar parameter uncertainties were found by varying the stellar parameters to match the uncertainty on the standard error of the relevant slopes or abundance differences, adding a systematic uncertainty of 100 K for , 0.2 dex for , 0.2 for , and 0.2 dex for [M/H] in quadrature. Stellar parameters for the stars are found in Table 1.
We derived stellar parameters assuming a spectroscopic effective temperature scale, but in general photometric temperatures tend to be a bit hotter (e.g. Frebel et al., 2013). To estimate the difference, we applied the temperature correction in Frebel et al. (2013) and redetermined the stellar parameters following that paper, except for using Fe II abundances to determine microturbulence. The Frebel et al. (2013) recalibrated temperatures were similar to the temperatures determined by a Gaia color-temperature relation from a PARSEC isochrone (Bressan et al., 2012) and StarHorse colors (Anders et al., 2022), except when the reddening correction was large. Overall we found that the [Fe/H] of our Typhon stars increased by 0.1 dex when using photometric temperatures, but the [X/Fe] ratios stayed about the same. We thus decided to keep the spectroscopic stellar parameters, both to avoid uncertainties due to reddening and because it results in more accurate synthetic spectra models.
With these stellar parameters, we used synthetic spectra fits to determine the chemical abundances of features that were heavily blended, required hyperfine or isotope splitting, and/or were molecular features. The best-fit abundances were found with minimization, marginalizing over a local continuum, resolution, and radial velocity shift as free parameters in addition to the element abundance (see Ji et al. 2020a for details). For C-H and C-N, we adopted a ratio of 90% 12C and 10% 13C. For Ba and Eu, we adopted solar -process isotopic ratios (Sneden et al., 2008). In total, 31 species of 26 elements were measured, where C-H, C-N, Al I, Sc II, V I and II, Mn I, Co I, Sr II, Y II, Zr II, Ba II, La II, Eu II, and Dy II were synthesized, as was the Si 3905Å line; and abundances of all other features were determined with equivalent widths. Individual line measurements and associated uncertainties are provided as supplemental material online.
Abundance averages and uncertainties were derived following Ji et al. (2020a), which propagates the stellar parameter uncertainty as a weight to each individual line and properly accounts for correlations between line abundances due to stellar parameters. We set the correlations between stellar parameters to zero in this analysis, which is closer to the uncertainty analysis in most literature sources we compare against. There were no significant differences in our conclusions adopting the stellar parameter correlations from Ji et al. (2020a), though the detailed uncertainties and correlations are affected. The final abundances are given in Table 2.
We briefly comment on a few specific stars and elements. Star 3793377208170393984 had only Na D lines to measure sodium, and these were clearly blended with ISM features so we rejected them. Since Na is strongly affected by non-local thermodynamic equilibrium (NLTE) effects, we have calculated NLTE corrections from Lind et al. (2011) and included both the LTE and NLTE [Na/Fe] abundances in Table 2. The uncertainty analysis is the same, so only the mean abundances change. We use the NLTE Na abundances in the rest of the text and figures.
We could detect the 3944Å and 3961Å Al lines in all stars, but due to heavy blends with Ca HK and other features we only included their abundance if the two lines gave a consistent result. The 6696Å and 6698Å Al lines were nonexistent in our spectra. The Al abundances should thus be considered with caution. The C abundances are determined from the C-H bands around 4300Å, assuming [O/Fe] = . The O abundances are determined from the forbidden 6300Å line, which is often blended with telluric lines and should be considered with caution. We have not provided O abundances if we suspected telluric contamination. The Co abundances do not agree between different lines and should be considered unreliable unless investigating the individual line abundances provided. Finally, we examined [X/Fe] as a function of , finding significant trends for C-H, Na I, Al I, Si I, and V I. The trend in C-H is expected as red giant branch stars convert C to N as they ascend the giant branch, but the others may suggest systematic effects (e.g. non-LTE effects) are affecting the results for those elements.
Star 3793377208170393984 has a higher and than expected for its if it were to be a red giant branch star. This suggests it could be a red horizontal branch (RHB) star, which is corroborated by the rotational velocity from Payne4MIKE (5 instead of unresolved for the other stars) and visually by its slightly wider lines (see Roederer et al. 2014). The color-magnitude diagram in Tenachi et al. (2022) also suggests this is a RHB star. The LAMOST metallicities for this star (Tenachi et al., 2022; Wang et al., 2022) have a higher , which could be due in part to its somewhat unusual evolutionary stage.
Star 3736372993468775424 has enhanced [Ba/Fe] compared to the other stars. Closer investigation suggests this star has likely experienced mass transfer from an AGB companion, as it also has relatively high [C/Fe] compared to other Typhon stars at its temperature. We found no indication of velocity variations between Gaia DR3 and our MIKE velocity.
3 Results
Table 2 at the end of the paper gives the chemical abundances of the seven Typhon stars. The abundances are the weighted average of different lines, where the weights account for the correlated effect of stellar parameters on all lines used to derive the abundance, by propagating the per-line abundance gradient with respect to each stellar parameter into a covariance matrix and taking the optimal estimator. The [X/H] abundances are relative to Asplund et al. (2009) solar abundances. is the total standard error on [X/H] including consistently propagating spectrum noise uncertainties, stellar parameter uncertainties from Table 1, and an empirical systematic uncertainty to each line based on the line-to-line scatter. [X/Fe] is calculated relative to [Fe I/H] if X is a neutral species and [Fe II/H] if X is an ionized species, while is the standard error also propagating stellar parameter uncertainties to both X and Fe I or II, which explains why its uncertainty differs from [X/H]. For more details see appendix B of Ji et al. (2020a).
3.1 Typhon is likely a tidally disrupted dwarf galaxy
We first consider the metallicity dispersion of Typhon. Fitting a Gaussian metallicity distribution to all 7 stars with a log-uniform prior for , we infer with a metallicity dispersion of . Including the three LAMOST [Fe/H] measurements in Tenachi et al. (2022) gives essentially identical results, and . As found in Tenachi et al. (2022), this dispersion depends entirely on the most metal-poor star in Typhon: removing that star results in an unresolved metallicity dispersion at 95% confidence, i.e. the six metal-rich stars in Typhon have no apparent [Fe/H] dispersion. However, we agree with Tenachi et al. (2022) that there is no obvious reason to reject the metal-poor star as being a Typhon member, even though it is a spectroscopic binary. While it may appear odd to have several stars in a metal-rich peak with one metal-poor star, we note that this is quite consistent with a leaky box metallicity distribution function, which is skewed-left in this way (Kirby et al., 2013). More quantitatively, we considered the metallicity distribution for Leo I from Kirby et al. (2013), which has the closest mean metallicity to Typhon. Leo I is best-fit by an Extra Gas model (, , ), where only 4.1% of stars have , easily consistent with 1 out of 7 Typhon stars being metal-poor. Thus we conclude that Typhon likely has a metallicity distribution consistent with a dwarf galaxy.
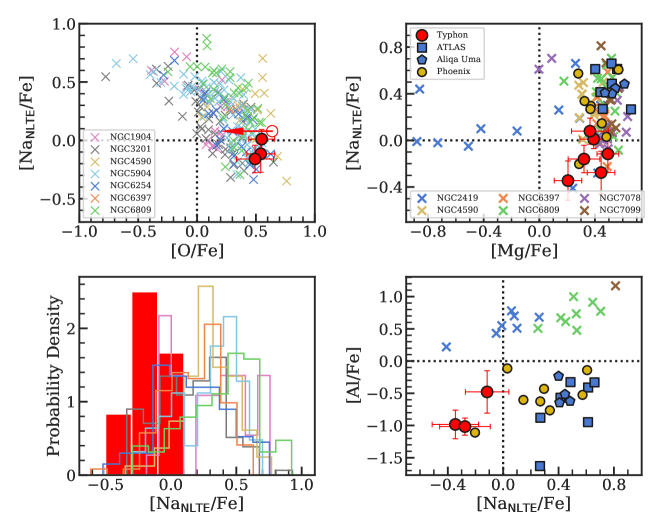
If the metal-poor star is an interloper and Typhon is a globular cluster, we might expect that Typhon displays anomalous chemical abundances indicative of multiple stellar populations (Bastian & Lardo, 2018; Gratton et al., 2019). Figure 2 shows the Na-O, Mg-Na, and Na-Al (anti-)correlations found in Galactic globular clusters (e.g. Yong et al., 2005; Carretta et al., 2009a; Carretta et al., 2009b). The Typhon stars do not display any light element scattering expected for multiple stellar populations. This conclusion is based primarily on the lack of an observed Na dispersion in six Typhon stars (five excluding the metal-poor star), because only three stars have reasonable N or Al measurements and the abundance uncertainties on the even- elements are relatively large compared to the size of the decrease. Using the same Gaussian metallicity dispersion model as Fe, we find ([NaNLTE/Fe] at 95% confidence, compared to typical dispersions of dex in other globular clusters (Carretta et al., 2009b). Furthermore, the top panels of Figure 2 show that the mean Na abundances are all similar to the primordial population in globular clusters. Over 50% of the stars in all of the Milky Way’s nearby globular clusters have unusual chemical abundances that probably should be detected in these stars (Milone et al., 2017), so the naive probability of 0 out of 5 stars displaying a Na enhancement is . Typhon also shows no Mg-K dispersion as found in NGC2419 (Cohen & Kirby, 2012). However, the fraction of stars displaying unusual chemistry in accreted globular clusters may be substantially lower, possibly due to their lower initial stellar mass (Milone et al. 2020, Usman et al. in prep), so this is only a weak constraint.
Between the metallicity dispersion and lack of multiple populations, we conclude the evidence is in favor of Typhon not being a globular cluster, though future observations could disprove this. Assuming Typhon is a new dwarf galaxy, using , the mass-metallicity from Kirby et al. (2013) for intact dwarf galaxies gives . The mass-metallicity relation from Naidu et al. (2022a) for tidally disrupted dwarf galaxies suggests Typhon should have had a stellar mass of . It is not clear which of these two relations should be used, since Typhon has a high apocenter and energy indicating it could have accreted onto the Milky Way relatively recently, but its high- naively suggests it should have accreted relatively early. Either way, the stellar mass is very high, comparable to some of the most massive intact dwarf galaxies around the Milky Way like Sculptor or Fornax, which suggests that there should be many more nearby Typhon members that have not yet been identified.
3.2 Chemical evolution in Typhon
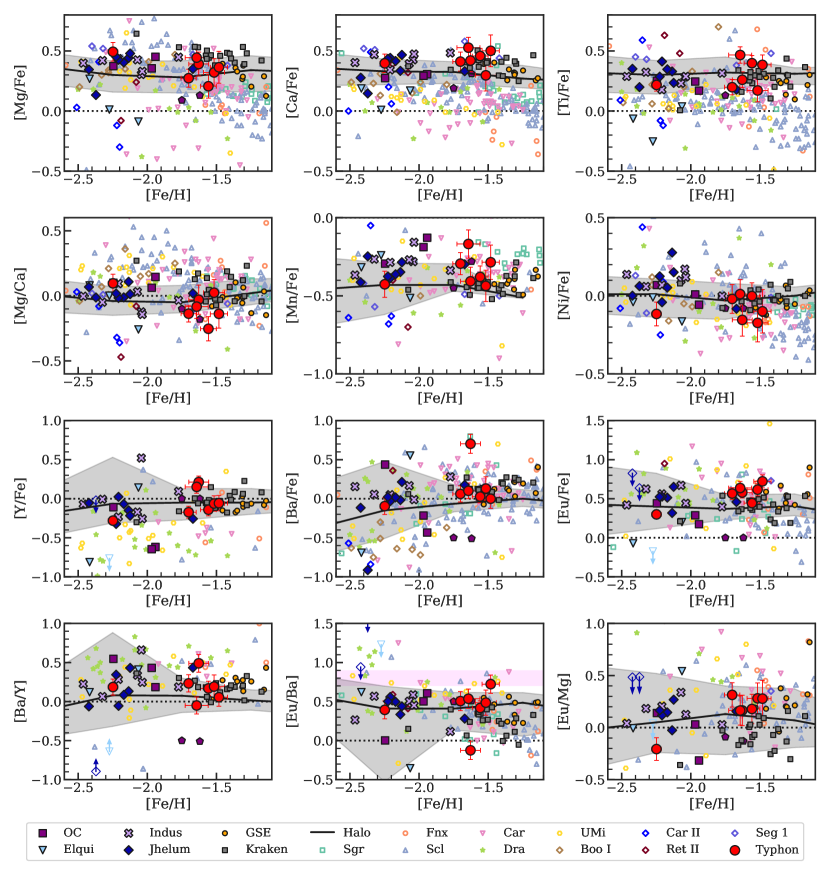
Figure 3 shows chemical abundances of Typhon stars compared to different dwarf galaxies, both intact dSph galaxies (Jönsson et al., 2018; Hansen et al., 2018; Letarte et al., 2010; Shetrone et al., 2003; Hill et al., 2019; Jablonka et al., 2015; Kirby & Cohen, 2012; Norris et al., 2017; Cohen & Huang, 2009, 2010; Tsujimoto et al., 2017) and dwarf galaxy streams observed by the Southern Stellar Stream Spectroscopic Survey (, Ji et al., 2020a; Hansen et al., 2021; Li et al., 2022), as well as abundances derived from MIKE observations of the Orphan Stream (Casey et al., 2014), and the disrupted dwarf galaxies Gaia-Sausage-Enceladus (GSE) and Kraken/Heracles (Naidu et al., 2022b). We also plot halo stars from selected references in JINAbase for comparison as a shaded grey region (Abohalima & Frebel, 2018; Fulbright, 2000; Barklem et al., 2005; Cohen et al., 2013; Roederer et al., 2014; Jacobson et al., 2015). The top row shows [/Fe] abundances for Mg, Ca, and Ti; the second row shows [Mg/Ca] and Fe-peak abundances; and the bottom two rows show various combinations of neutron-capture elements Y, Ba, and Eu that trace the first, second, and rare-earth neutron-capture element peaks. The Fe-peak abundances are overall similar to other dwarf galaxies and the stellar halo, with possibly the exception of [Mn/Fe] which is slightly enhanced and could be a useful chemical tag (de los Reyes et al., 2020). We did not consider possible non-LTE effects for Mn (Bergemann et al., 2019) so we refrain from interpreting it further.
The top row of Figure 3 shows the most important result of this study, which is that Typhon has elevated [/Fe] ratios in Mg and Ca. We have tested a large number of permutations of stellar parameters and weighted averages to determine the mean abundance for each star, and this enhancement is very robust. In particular, we have used the same line list and overall analysis method to derive the chemical abundances of stars in streams (Ji et al., 2020a), and it is clear that the most metal-rich Jhelum star (Jhelum_2_2) has similar [Mg/Fe] as but lower [Ca/Fe] than the typical Typhon star (Figure 1). While there could be more metal-rich stars in Typhon that have not yet been found, at face value this suggests that Typhon quenched rather early in cosmic history, as it stopped forming stars while it was dominated by core-collapse instead of Type Ia supernovae (e.g. Johnston et al., 2008; Lee et al., 2015; Cunningham et al., 2021). For comparison, the intact dSph with the closest [Fe/H] is Sculptor, with (Kirby et al., 2013), and Typhon has similar [Mg/Fe] and higher [Ca/Fe] than Sculptor (Hill et al., 2019). Lower mass dwarf galaxies like Draco and Ursa Minor have similar or lower [/Fe] (Norris et al., 2017; Cohen & Huang, 2009). Two other faint dwarf galaxy streams with lower apocenters, Jhelum and Indus, also display this high- feature, with the same caveat that more metal-rich stars not yet studied in these streams may show lower--element abundances (Ji et al., 2020a; Hansen et al., 2021). In contrast, the recently accreted Orphan/Chenab (OC) stream displays quite low [/Fe] abundances at (Casey et al., 2014; Ji et al., 2020a; Hawkins et al., 2022; Naidu et al., 2022a).
The Eu abundances in the bottom two rows of Figure 3 show an intriguing trend, namely that [Eu/Fe] appears to increase with [Fe/H] in Typhon. The difference in [Eu/Fe] between the most Fe-poor star and the other Typhon stars is significant: like [Fe/H], the [Eu/Fe] dispersion is resolved when including the low-metallicity star, while it is unresolved when only considering the metal-rich Typhon stars. This trend is opposite most dwarf galaxies, where [Eu/Fe] stays flat or declines at high metallicity, though a similar increasing [Eu/Fe] trend is also seen in Ursa Minor (Cohen & Huang, 2010). An increasing [Eu/Fe] or [Eu/Mg] at higher [Fe/H] can indicate the onset of delayed -process enrichment in a dwarf galaxy (e.g. Skúladóttir et al., 2019; Aguado et al., 2021b; Matsuno et al., 2021; Reggiani et al., 2021; Naidu et al., 2022b). This is corroborated by the lower [Ba/Eu] in Typhon at high [Fe/H], indicating an increased -process dominance at higher metallicity (except for the -process mass transfer star, see Section 2). It is also possible such an enhancement could be due to extreme inhomogeneous metal mixing (e.g. Hansen et al., 2021; Reichert et al., 2021), though Typhon’s high mass inferred from the mass-metallicity relations ( to ) suggests it is unlikely to have a lot of stochastic enrichment (Naidu et al. 2022b, Frebel & Ji submitted). Note that there is a slight trend between and [Eu/Fe] for the high-Fe Typhon stars, so one should not over-interpret the slightly rising trend in [Eu/Fe] within the clump.
In summary, Typhon’s chemical abundances somewhat conflictingly indicate a star formation history short enough to remain -enhanced, but long enough to be enriched by delayed -process sources.
4 Discussion and Conclusion
Our chemical evidence, along with the spatial and dynamics arguments by Tenachi et al. (2022), suggests that Typhon is probably a dwarf galaxy. The evidence primarily hinges on the membership of the most metal-poor star in Typhon and a small number of [Na/Fe] measurements, so we caution that future observations could end up showing this early conclusion to be incorrect. However, assuming this star is a member, then Typhon is a dwarf galaxy with three somewhat contradictory observational facts:
-
1.
Typhon’s metal-rich stars are moderately -enhanced, indicating it was forming stars efficiently at the end of its probably short life;
-
2.
Typhon’s metal-rich stars show evidence for increased Eu-enhancement, indicating that it captured delayed -process production from a source like neutron star mergers;
-
3.
Typhon has an apocenter larger than 100 kpc, usually interpreted as meaning it accreted relatively recently into the Milky Way.
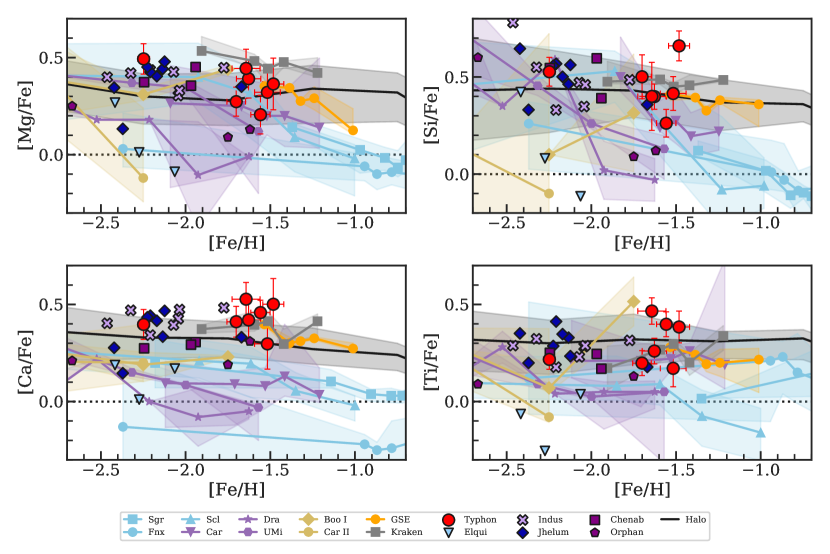
To elaborate, the typical explanation for high -enhancement in a satellite dwarf galaxy’s most metal-rich stars is that it only formed stars for a short duration due to environmental quenching from early accretion onto the Milky Way galaxy (e.g. Johnston et al., 2008). We show this in more detail in Figure 4, where low-mass galaxies (purple) whose most metal-rich stars match Typhon’s metal-rich stars have lower [/Fe]; and more massive galaxies (blue) have similar [/Fe] as Typhon but all continue to higher [Fe/H] while Typhon truncates. If Typhon is a new dwarf galaxy, this explanation implies Typhon would have formed stars for a shorter duration than Sculptor, which has a similar [Fe/H] as Typhon but continues to evolve to higher [Fe/H] and lower [/Fe]. Sculptor formed 90% of its stars within only the first 2 Gyr of the universe according to Weisz et al. (2014)444de los Reyes et al. (2022) argue that chemical evolution shows the total duration of star formation is Gyr, which could be consistent with Weisz et al. (2014) if the beginning of star formation was delayed; Hill et al. (2019) alternatively argue Sculptor formed its stars over 7 Gyr using RGB ages.. The high [Mg/Fe] also matches other tidally disrupted halo dwarf galaxies that quenched at , when the universe is about 2-3 Gyr old (Naidu et al., 2022a). However, such a short star formation duration is in tension with Typhon’s high apocenter and -process evolution. For example, compare Typhon to Gaia–Sausage-Enceladus (GSE), which has the bulk of its stars with apocenters within 30-50kpc (Deason et al., 2018; Naidu et al., 2021) and is certainly more massive than Typhon, but has a similar [Mg/Fe] as Typhon at (Helmi et al., 2018; Haywood et al., 2018; Mackereth et al., 2019, see Figure 4). Thus, at face value Typhon was forming stars as efficiently as GSE at the end of its life, but it has a larger apocenter that naively suggests it accreted onto the Milky Way (and thus quenched) at a later time, as well as an increasing [Eu/Fe] (and [Eu/Mg]) trend that indicates it captured delayed -process element production (Aguado et al., 2021b; Matsuno et al., 2021; Naidu et al., 2022b).
We suggest four possible explanations to explain these apparently conflicting properties.
(1) Late-time dynamical interaction. Tenachi et al. (2022) noted that Typhon may have had a past interaction with Sgr. Typhon could thus potentially have accreted early onto the Milky Way, shutting off its star formation before enough SN Ia enrichment occurred to affect [/Fe], and then was scattered to higher energies by a later interaction. This would require a stochastic explanation for the late-time -process enhancement, and it can be tested by additional dynamical simulations.
(2) Late-time star formation enhancement. The metal-rich Typhon stars could have formed in a starburst that enhances [/Fe]. It is well-known that this ratio does not have to monotonically decline as a galaxy grows, but it can increase e.g. during a starburst that causes core-collapse supernovae to increase relative to Type Ia supernovae (e.g. Weinberg et al., 2017). This has been seen in the Large Magellanic Cloud (Nidever et al., 2020) and likely in the early Milky Way as well (Conroy et al., 2022). With only one metal-poor star anchoring the tail of the chemical evolution history, and a large [Fe/H] gap between that star and the Fe-rich stars, Typhon’s chemical evolution history could potentially display such a varying [/Fe] ratio, which can be tested with future chemical abundances. Delayed star formation could also potentially explain the [Eu/Fe] rise at late times, since neutron star mergers produce Eu through the -process and explode with a time delay. However, increasing Eu relative to Fe requires Eu to either increase faster than Fe, e.g. through a difference in the delay time distribution of neutron star mergers and Type Ia supernovae.
(3) Early accretion and late-time group infall. Typhon could have been first quenched by environmental interactions with a dwarf galaxy, and only later fell into the Milky Way. Wetzel et al. (2015) found in dark matter simulations that about of intact dwarf galaxies with stellar masses () have passed within the virial radius of another galaxy before falling into the Milky Way, though only 10-30% of such systems remained as satellites at the time of infall. Such an environmental interaction could have kept Typhon -enhanced by early environmental quenching, but allow it to have a large apocenter around the Milky Way due to a later infall. The statistics of this scenario in cosmological simulations should be revisited in the context of tidally disrupted dwarf galaxies as well as in hydrodynamic simulations.
(4) High-energy tail of another disrupted galaxy. Dwarf galaxies accreting into the Milky Way do not deposit all their material at a single energy, as dynamical friction causes them to sink to lower energies (and thus smaller apocenters) with each orbit (e.g. Naidu et al., 2021). Thus, while no known structure resides in the same kinematic space as Typhon (Tenachi et al., 2022; Dodd et al., 2022), Typhon could still potentially be the first orbital wrap of another accretion event. Such an event would likely strip only a relatively metal-poor part of the galaxy, such that our discussion does not reflect the whole galaxy’s chemical evolution (e.g. Johnson et al., 2020; Naidu et al., 2021).
This scenario would likely require Typhon being the tail of a massive accretion event, as massive galaxies are most strongly affected by dynamical friction. Thus, we probably should already know the possible progenitiors of Typhon in this scenario. Examining all known large accretion events (Naidu et al., 2020; Bonaca et al., 2021; Li et al., 2022; Malhan et al., 2022), we reject the three most massive accretion events as possible origins of Typhon: the LMC pericenter of kpc is not nearly small enough to match Typhon’s 6 kpc pericenter (Tenachi et al., 2022); GSE’s high-energy debris should be much more retrograde than Typhon (Naidu et al., 2021); and Sgr has the wrong sign for .
There are also myriad known closer dwarf galaxy streams with moderately high metallicities that are similar or slightly more massive than Typhon (e.g. Palca/Cetus, LMS-1/Wukong, the Helmi stream, and others; Naidu et al. 2020; Bonaca et al. 2021; Li et al. 2022; Malhan et al. 2022). The initial infall of these systems has not yet been studied in fully live N-body simulations, so it remains possible that Typhon is an early wrap of one of these systems. A path forward to rule out such associations is to compare the detailed chemical abundances of these nearby lower-mass streams to Typhon. Palca/Cetus does not have any detailed chemical abundances published. LMS-1/Wukong has a similar [Mg/Fe] as Typhon in APOGEE and H3, but more elements are needed to compare with Typhon (Horta et al., 2022; Naidu et al., 2020). The Helmi stream has been chemically studied many times (Roederer et al., 2010; Aguado et al., 2021a; Gull et al., 2021; Limberg et al., 2021; Matsuno et al., 2022). Limberg et al. (2021) summarized these results, including a crucial re-assessment of stream membership with Gaia, which removed a large number of stars previously hypothesized to be part of the Helmi stream. At , they find the Helmi stream has similar [Mg/Fe] and [Eu/Fe] but lower [Ca/Fe] than Typhon, so it is probably not the progenitor of Typhon though more data is certainly needed to be sure. Matsuno et al. (2022) also found a lower [Ca/Fe] in the Helmi stream, as well as a somewhat low [Y/Fe] ratio also inconsistent with Typhon. This exercise emphasizes the crucial importance of pinning down accurate chemical signatures of metal-poor stars in known accretion events before trying to discover new faint stellar streams.
To set an initial prior on whether Typhon is a bona fide dwarf galaxy (scenarios 1-3) or an early wrap of a larger dwarf galaxy (scenario 4), we examine the accreted halo star catalog from the Caterpillar dark-matter-only simulations (Griffen et al., 2016; Brauer et al., 2022). Briefly, halo star particles are identified by examining the merger tree of each Milky Way mass host halo to find all branches where a halo merged into the Milky Way. The 10% most bound particles of each merging subhalo are tagged as stars at the time of peak mass and then traced to . The orbital parameters and apocenters are computed using the AGAMA software library (Vasiliev, 2019) following Brauer et al. (2022). We then select halo star particles within a 5 kpc radius of the solar neighborhood at , pick the subset with apocenters kpc, and connect those star particles back to their original birth galaxies. Fewer than 0.1% of the tagged star particles have apocenters kpc. Using the Garrison-Kimmel et al. (2017) abundance matching relation, we find that 56% of these high-apocenter solar neighborhood stars originated in massive galaxies with , 24% of the stars originate in galaxies between , and 20% of the stars originate in galaxies less than (which is disfavored for Typhon). Note that the star particle method tags a constant fraction of dark matter particles, so the number of actual stars in lower mass galaxies is even lower due to the steepness of the stellar mass-halo mass relation. In conclusion, of the time, high-apocenter stars with Typhon’s metallicity are the tails of massive accretion events, which gives odds that Typhon is not an independent dwarf galaxy. More detailed future investigation of this question would be beneficial, such as accounting for the shared kinematics and orbital phase of Typhon stars.
We also note that Yu et al. (2020) proposed an in situ formation scenario that could explain Typhon-like systems. They found that very bursty feedback in the FIRE-2 simulations sometimes deposited a large amount of momentum into giant molecular clouds, triggering star formation and producing stars with halo-like orbits. The chemical abundances of Typhon are only moderately different from in situ metal-poor Milky Way stars, so we cannot rule out such a scenario.
Typhon emphasizes the need for a global picture to tackle the chemical and dynamical complexity expected for the Milky Way’s tidally disrupted dwarf galaxy satellites. If Typhon is the high-energy wrap of a massive dwarf galaxy, it shows the crucial importance of connecting apparently disparate kinematic components with detailed chemical abundances and dynamical models. If instead Typhon is indeed a new dwarf galaxy, its different and unusual formation scenarios can likely be quickly tested with additional chemical abundance measurements within Typhon, especially because its high inferred stellar mass suggests many other Typhon stars should be nearby to be discovered. Either way, simulations suggest that of dwarf galaxies that existed in the Milky Way volume at high redshift are now tidally disrupted (Safarzadeh et al., 2018; Santistevan et al., 2020), so the coming years are an exciting time for Gaia and spectroscopic surveys to continue to unravel our Milky Way stellar halo into its component parts.
| El. | ul | [X/H] | [X/Fe] | ||||
|---|---|---|---|---|---|---|---|
| Gaia DR3 1765600930139450752 | |||||||
| C-H | 2 | 0.15 | 0.14 | ||||
| C-N | 1 | ||||||
| O I | 1 | 0.13 | 0.12 | ||||
| Na I | 4 | 0.16 | 0.16 | ||||
| Na NLTE | |||||||
| Mg I | 2 | 0.08 | 0.08 | ||||
| Al I | 2 | 0.33 | 0.33 | ||||
| Si I | 6 | 0.07 | 0.07 | ||||
| K I | 2 | 0.11 | 0.11 | ||||
| Ca I | 12 | 0.08 | 0.08 | ||||
| Sc II | 7 | 0.08 | 0.05 | ||||
| Ti I | 28 | 0.10 | 0.10 | ||||
| Ti II | 24 | 0.09 | 0.05 | ||||
| V I | 2 | 0.06 | 0.07 | ||||
| V II | 2 | 0.10 | 0.06 | ||||
| Cr I | 13 | 0.13 | 0.12 | ||||
| Cr II | 5 | 0.09 | 0.05 | ||||
| Mn I | 5 | 0.08 | 0.08 | ||||
| Fe I | 78 | 0.04 | 0.00 | ||||
| Fe II | 19 | 0.08 | 0.00 | ||||
| Co I | 5 | 0.12 | 0.12 | ||||
| Ni I | 20 | 0.08 | 0.08 | ||||
| Cu I | 1 | 0.16 | 0.15 | ||||
| Zn I | 2 | 0.07 | 0.07 | ||||
| Sr II | 2 | 0.10 | 0.10 | ||||
| Y II | 7 | 0.09 | 0.05 | ||||
| Zr II | 1 | 0.10 | 0.05 | ||||
| Ba II | 4 | 0.13 | 0.11 | ||||
| La II | 5 | 0.08 | 0.04 | ||||
| Eu II | 3 | 0.09 | 0.06 | ||||
| Dy II | 2 | 0.09 | 0.04 | ||||
| Gaia DR3 3573787693673899520 | |||||||
| C-H | 2 | 0.11 | 0.11 | ||||
| C-N | 1 | ||||||
| O I | 1 | ||||||
| Na I | 2 | 0.18 | 0.17 | ||||
| Na NLTE | |||||||
| Mg I | 2 | 0.10 | 0.10 | ||||
| Al I | 2 | 0.23 | 0.22 | ||||
| Si I | 4 | 0.06 | 0.07 | ||||
| K I | 2 | 0.14 | 0.13 | ||||
| Ca I | 12 | 0.06 | 0.06 | ||||
| Sc II | 8 | 0.08 | 0.06 | ||||
| Ti I | 20 | 0.11 | 0.10 | ||||
| Ti II | 16 | 0.10 | 0.06 | ||||
| V I | 2 | 0.12 | 0.10 | ||||
| V II | 2 | 0.09 | 0.07 | ||||
| Cr I | 10 | 0.11 | 0.09 | ||||
| Cr II | 5 | 0.09 | 0.05 | ||||
| Mn I | 5 | 0.07 | 0.07 | ||||
| Fe I | 80 | 0.06 | 0.00 | ||||
| Fe II | 16 | 0.09 | 0.00 | ||||
| Co I | 3 | 0.11 | 0.10 | ||||
| Ni I | 8 | 0.09 | 0.08 | ||||
| Zn I | 2 | 0.08 | 0.08 | ||||
| Sr II | 2 | 0.12 | 0.13 | ||||
| Y II | 3 | 0.10 | 0.08 | ||||
| Zr II | 1 | 0.09 | 0.07 | ||||
| Ba II | 4 | 0.10 | 0.08 | ||||
| La II | 3 | 0.10 | 0.09 | ||||
| Eu II | 2 | 0.09 | 0.07 | ||||
| Dy II | 1 | 0.18 | 0.18 | ||||
| Gaia DR3 3736372993468775424 | |||||||
| C-H | 2 | 0.15 | 0.13 | ||||
| C-N | 1 | 0.21 | 0.18 | ||||
| O I | 1 | 0.11 | 0.11 | ||||
| Na I | 4 | 0.07 | 0.08 | ||||
| Na NLTE | |||||||
| Mg I | 4 | 0.10 | 0.10 | ||||
| Si I | 5 | 0.06 | 0.07 | ||||
| K I | 2 | 0.20 | 0.19 | ||||
| Ca I | 12 | 0.10 | 0.09 | ||||
| Sc II | 7 | 0.10 | 0.07 | ||||
| Ti I | 36 | 0.12 | 0.12 | ||||
| Ti II | 18 | 0.09 | 0.07 | ||||
| V I | 2 | 0.13 | 0.15 | ||||
| V II | 1 | 0.11 | 0.07 | ||||
| Cr I | 13 | 0.17 | 0.15 | ||||
| Cr II | 3 | 0.10 | 0.06 | ||||
| Mn I | 5 | 0.09 | 0.09 | ||||
| Fe I | 77 | 0.07 | 0.00 | ||||
| Fe II | 21 | 0.10 | 0.00 | ||||
| Co I | 5 | 0.16 | 0.16 | ||||
| Ni I | 22 | 0.11 | 0.10 | ||||
| Cu I | 1 | 0.16 | 0.14 | ||||
| Zn I | 2 | 0.10 | 0.11 | ||||
| Sr II | 2 | 0.05 | 0.09 | ||||
| Y II | 6 | 0.10 | 0.08 | ||||
| Zr II | 1 | 0.18 | 0.14 | ||||
| Ba II | 4 | 0.09 | 0.12 | ||||
| La II | 5 | 0.10 | 0.07 | ||||
| Eu II | 3 | 0.08 | 0.07 | ||||
| Dy II | 3 | 0.09 | 0.07 | ||||
| Gaia DR3 3793377208170393984 | |||||||
| C-H | 2 | 0.15 | 0.14 | ||||
| C-N | 1 | ||||||
| O I | 1 | ||||||
| Mg I | 2 | 0.07 | 0.07 | ||||
| Al I | 2 | 0.07 | 0.09 | ||||
| Si I | 2 | 0.12 | 0.11 | ||||
| K I | 2 | 0.12 | 0.12 | ||||
| Ca I | 10 | 0.08 | 0.08 | ||||
| Sc II | 8 | 0.09 | 0.08 | ||||
| Ti I | 10 | 0.12 | 0.11 | ||||
| Ti II | 14 | 0.11 | 0.06 | ||||
| V I | 2 | 0.13 | 0.12 | ||||
| V II | 2 | 0.11 | 0.07 | ||||
| Cr I | 9 | 0.12 | 0.11 | ||||
| Cr II | 4 | 0.10 | 0.06 | ||||
| Mn I | 5 | 0.07 | 0.07 | ||||
| Fe I | 68 | 0.06 | 0.00 | ||||
| Fe II | 17 | 0.10 | 0.00 | ||||
| Co I | 4 | 0.16 | 0.15 | ||||
| Ni I | 12 | 0.10 | 0.09 | ||||
| Zn I | 2 | 0.09 | 0.08 | ||||
| Sr II | 2 | 0.16 | 0.14 | ||||
| Y II | 7 | 0.09 | 0.08 | ||||
| Zr II | 1 | 0.10 | 0.06 | ||||
| Ba II | 4 | 0.10 | 0.10 | ||||
| La II | 5 | 0.10 | 0.07 | ||||
| Eu II | 2 | 0.12 | 0.07 | ||||
| Dy II | 2 | 0.12 | 0.09 | ||||
| Gaia DR3 3891712266823336192 | |||||||
| C-H | 2 | 0.17 | 0.18 | ||||
| C-N | 1 | 0.28 | 0.27 | ||||
| O I | 1 | 0.13 | 0.16 | ||||
| Na I | 4 | 0.11 | 0.12 | ||||
| Na NLTE | |||||||
| Mg I | 2 | 0.12 | 0.11 | ||||
| Si I | 4 | 0.07 | 0.09 | ||||
| K I | 2 | 0.24 | 0.23 | ||||
| Ca I | 10 | 0.13 | 0.13 | ||||
| Sc II | 4 | 0.14 | 0.10 | ||||
| Ti I | 31 | 0.12 | 0.12 | ||||
| Ti II | 17 | 0.14 | 0.10 | ||||
| V I | 2 | 0.16 | 0.15 | ||||
| V II | 2 | 0.13 | 0.10 | ||||
| Cr I | 12 | 0.21 | 0.19 | ||||
| Cr II | 5 | 0.13 | 0.09 | ||||
| Mn I | 5 | 0.10 | 0.10 | ||||
| Fe I | 76 | 0.08 | 0.00 | ||||
| Fe II | 20 | 0.12 | 0.00 | ||||
| Co I | 5 | 0.15 | 0.16 | ||||
| Ni I | 19 | 0.12 | 0.12 | ||||
| Cu I | 1 | 0.20 | 0.19 | ||||
| Zn I | 2 | 0.10 | 0.13 | ||||
| Sr II | 2 | 0.08 | 0.10 | ||||
| Y II | 7 | 0.12 | 0.10 | ||||
| Zr II | 1 | 0.14 | 0.11 | ||||
| Ba II | 4 | 0.16 | 0.15 | ||||
| La II | 5 | 0.12 | 0.08 | ||||
| Eu II | 3 | 0.09 | 0.08 | ||||
| Dy II | 3 | 0.09 | 0.11 | ||||
| Gaia DR3 3913243629368310912 | |||||||
| C-H | 2 | 0.17 | 0.18 | ||||
| C-N | 1 | 0.25 | 0.25 | ||||
| O I | 1 | ||||||
| Na I | 4 | 0.11 | 0.11 | ||||
| Na NLTE | |||||||
| Mg I | 3 | 0.14 | 0.13 | ||||
| Si I | 4 | 0.06 | 0.08 | ||||
| K I | 2 | 0.21 | 0.20 | ||||
| Ca I | 12 | 0.13 | 0.13 | ||||
| Sc II | 6 | 0.09 | 0.11 | ||||
| Ti I | 26 | 0.14 | 0.14 | ||||
| Ti II | 18 | 0.12 | 0.08 | ||||
| V I | 2 | 0.19 | 0.18 | ||||
| Cr I | 14 | 0.21 | 0.20 | ||||
| Cr II | 2 | 0.18 | 0.14 | ||||
| Mn I | 5 | 0.11 | 0.11 | ||||
| Fe I | 61 | 0.06 | 0.00 | ||||
| Fe II | 20 | 0.13 | 0.00 | ||||
| Co I | 5 | 0.19 | 0.19 | ||||
| Ni I | 20 | 0.14 | 0.14 | ||||
| Cu I | 1 | 0.19 | 0.18 | ||||
| Zn I | 2 | 0.11 | 0.13 | ||||
| Sr II | 2 | 0.13 | 0.15 | ||||
| Y II | 7 | 0.10 | 0.10 | ||||
| Zr II | 1 | 0.14 | 0.10 | ||||
| Ba II | 4 | 0.13 | 0.12 | ||||
| La II | 4 | 0.12 | 0.10 | ||||
| Eu II | 3 | 0.09 | 0.08 | ||||
| Dy II | 3 | 0.06 | 0.11 | ||||
| Gaia DR3 3939346894405032576 | |||||||
| C-H | 2 | 0.17 | 0.15 | ||||
| C-N | 1 | ||||||
| O I | 1 | ||||||
| Na I | 2 | 0.21 | 0.18 | ||||
| Na NLTE | |||||||
| Mg I | 2 | 0.10 | 0.10 | ||||
| Al I | 2 | 0.15 | 0.13 | ||||
| Si I | 1 | 0.21 | 0.17 | ||||
| K I | 2 | 0.20 | 0.19 | ||||
| Ca I | 8 | 0.09 | 0.09 | ||||
| Sc II | 6 | 0.10 | 0.06 | ||||
| Ti I | 9 | 0.15 | 0.13 | ||||
| Ti II | 13 | 0.11 | 0.07 | ||||
| V I | 1 | 0.11 | 0.10 | ||||
| V II | 2 | 0.11 | 0.10 | ||||
| Cr I | 4 | 0.16 | 0.13 | ||||
| Cr II | 3 | 0.09 | 0.04 | ||||
| Mn I | 5 | 0.10 | 0.09 | ||||
| Fe I | 51 | 0.08 | 0.00 | ||||
| Fe II | 11 | 0.09 | 0.00 | ||||
| Co I | 4 | 0.12 | 0.11 | ||||
| Ni I | 7 | 0.10 | 0.09 | ||||
| Zn I | 2 | 0.11 | 0.10 | ||||
| Sr II | 2 | 0.21 | 0.19 | ||||
| Y II | 3 | 0.11 | 0.08 | ||||
| Ba II | 3 | 0.13 | 0.10 | ||||
| La II | 1 | 0.16 | 0.14 | ||||
| Eu II | 2 | 0.11 | 0.08 | ||||
| Dy II | 1 | 0.17 | 0.16 | ||||
Note. — The “ul” column is an upper limit flag.
Acknowledgements
This paper includes data gathered with the 6.5 meter Magellan Telescopes located at Las Campanas Observatory, Chile. We thank all the LCO staff for enabling astronomical observations during a global pandemic. We thank Yuri Beletsky for assistance with part of these observations and Ting Li for helpful conversations. This work benefited from the Gaia DR3 Chicago Sprint hosted by KICP. A.P.J. thanks M.C.T. for her infinite patience. R.P.N. acknowledges an Ashford Fellowship granted by Harvard University. K.B. acknowledges support from the United States Department of Energy grant DE-SC0019323. Y.S.T. acknowledges financial support from the Australian Research Council through DECRA Fellowship DE220101520.
This work has made use of data from the European Space Agency (ESA) mission Gaia (https://www.cosmos.esa.int/gaia), processed by the Gaia Data Processing and Analysis Consortium (DPAC, https://www.cosmos.esa.int/web/gaia/dpac/consortium). Funding for the DPAC has been provided by national institutions, in particular the institutions participating in the Gaia Multilateral Agreement. This research has made use of NASA’s Astrophysics Data System Bibliographic Services.
Data Availability
The individual line measurements are provided as supplementary material. The reduced spectra can be obtained by reasonable request to the corresponding author.
References
- Abohalima & Frebel (2018) Abohalima A., Frebel A., 2018, ApJS, 238, 36
- Aguado et al. (2021a) Aguado D. S., et al., 2021a, MNRAS, 500, 889
- Aguado et al. (2021b) Aguado D. S., et al., 2021b, ApJ, 908, L8
- Anders et al. (2022) Anders F., et al., 2022, A&A, 658, A91
- Asplund et al. (2009) Asplund M., Grevesse N., Sauval A. J., Scott P., 2009, ARA&A, 47, 481
- Barklem et al. (2005) Barklem P. S., et al., 2005, A&A, 439, 129
- Bastian & Lardo (2018) Bastian N., Lardo C., 2018, ARA&A, 56, 83
- Battaglia et al. (2017) Battaglia G., North P., Jablonka P., Shetrone M., Minniti D., Díaz M., Starkenburg E., Savoy M., 2017, A&A, 608, A145
- Belokurov et al. (2006) Belokurov V., et al., 2006, ApJ, 642, L137
- Bergemann et al. (2019) Bergemann M., et al., 2019, A&A, 631, A80
- Bernard et al. (2016) Bernard E. J., et al., 2016, MNRAS, 463, 1759
- Bernstein et al. (2003) Bernstein R., Shectman S. A., Gunnels S. M., Mochnacki S., Athey A. E., 2003, in Iye M., Moorwood A. F. M., eds, Society of Photo-Optical Instrumentation Engineers (SPIE) Conference Series Vol. 4841, Instrument Design and Performance for Optical/Infrared Ground-based Telescopes. pp 1694–1704, doi:10.1117/12.461502
- Bonaca et al. (2021) Bonaca A., et al., 2021, ApJ, 909, L26
- Brauer et al. (2022) Brauer K., Andales H. D., Ji A. P., Frebel A., Mardini M. K., Gomez F. A., O’Shea B. W., 2022, arXiv e-prints, p. arXiv:2206.07057
- Bressan et al. (2012) Bressan A., Marigo P., Girardi L., Salasnich B., Dal Cero C., Rubele S., Nanni A., 2012, MNRAS, 427, 127
- Bullock & Johnston (2005) Bullock J. S., Johnston K. V., 2005, ApJ, 635, 931
- Carretta et al. (2009a) Carretta E., et al., 2009a, A&A, 505, 117
- Carretta et al. (2009b) Carretta E., Bragaglia A., Gratton R., Lucatello S., 2009b, A&A, 505, 139
- Casey et al. (2014) Casey A. R., Keller S. C., Da Costa G., Frebel A., Maunder E., 2014, ApJ, 784, 19
- Castelli & Kurucz (2003) Castelli F., Kurucz R. L., 2003, in Piskunov N., Weiss W. W., Gray D. F., eds, Vol. 210, Modelling of Stellar Atmospheres. p. A20 (arXiv:astro-ph/0405087)
- Chambers et al. (2016) Chambers K. C., et al., 2016, arXiv e-prints, p. arXiv:1612.05560
- Cohen & Huang (2009) Cohen J. G., Huang W., 2009, ApJ, 701, 1053
- Cohen & Huang (2010) Cohen J. G., Huang W., 2010, ApJ, 719, 931
- Cohen & Kirby (2012) Cohen J. G., Kirby E. N., 2012, ApJ, 760, 86
- Cohen et al. (2013) Cohen J. G., Christlieb N., Thompson I., McWilliam A., Shectman S., Reimers D., Wisotzki L., Kirby E., 2013, ApJ, 778, 56
- Conroy et al. (2022) Conroy C., et al., 2022, arXiv e-prints, p. arXiv:2204.02989
- Cunningham et al. (2021) Cunningham E. C., et al., 2021, arXiv e-prints, p. arXiv:2110.02957
- Dark Energy Survey Collaboration et al. (2016) Dark Energy Survey Collaboration et al., 2016, MNRAS, 460, 1270
- Deason et al. (2018) Deason A. J., Belokurov V., Koposov S. E., Lancaster L., 2018, ApJ, 862, L1
- Dodd et al. (2022) Dodd E., Callingham T. M., Helmi A., Matsuno T., Ruiz-Lara T., Balbinot E., Lovdal S., 2022, arXiv e-prints, p. arXiv:2206.11248
- Frebel et al. (2013) Frebel A., Casey A. R., Jacobson H. R., Yu Q., 2013, ApJ, 769, 57
- Fulbright (2000) Fulbright J. P., 2000, AJ, 120, 1841
- Gaia Collaboration et al. (2016) Gaia Collaboration et al., 2016, A&A, 595, A1
- Gaia Collaboration et al. (2022) Gaia Collaboration Vallenari A., Brown A. G. A., Prusti T., et al. 2022, A&A
- Garrison-Kimmel et al. (2017) Garrison-Kimmel S., Bullock J. S., Boylan-Kolchin M., Bardwell E., 2017, MNRAS, 464, 3108
- Gratton et al. (2019) Gratton R., Bragaglia A., Carretta E., D’Orazi V., Lucatello S., Sollima A., 2019, A&ARv, 27, 8
- Griffen et al. (2016) Griffen B. F., Ji A. P., Dooley G. A., Gómez F. A., Vogelsberger M., O’Shea B. W., Frebel A., 2016, ApJ, 818, 10
- Grillmair (2009) Grillmair C. J., 2009, ApJ, 693, 1118
- Gull et al. (2021) Gull M., Frebel A., Hinojosa K., Roederer I. U., Ji A. P., Brauer K., 2021, ApJ, 912, 52
- Hansen et al. (2018) Hansen C. J., El-Souri M., Monaco L., Villanova S., Bonifacio P., Caffau E., Sbordone L., 2018, ApJ, 855, 83
- Hansen et al. (2021) Hansen T. T., et al., 2021, ApJ, 915, 103
- Hawkins et al. (2022) Hawkins K., et al., 2022, arXiv e-prints, p. arXiv:2205.14218
- Haywood et al. (2018) Haywood M., Di Matteo P., Lehnert M. D., Snaith O., Khoperskov S., Gómez A., 2018, ApJ, 863, 113
- Helmi (2020) Helmi A., 2020, ARA&A, 58, 205
- Helmi et al. (1999) Helmi A., White S. D. M., de Zeeuw P. T., Zhao H., 1999, Nature, 402, 53
- Helmi et al. (2018) Helmi A., Babusiaux C., Koppelman H. H., Massari D., Veljanoski J., Brown A. G. A., 2018, Nature, 563, 85
- Hill et al. (2019) Hill V., et al., 2019, A&A, 626, A15
- Horta et al. (2022) Horta D., et al., 2022, arXiv e-prints, p. arXiv:2204.04233
- Ibata et al. (2019) Ibata R. A., Malhan K., Martin N. F., 2019, ApJ, 872, 152
- Ibata et al. (2021) Ibata R., et al., 2021, ApJ, 914, 123
- Jablonka et al. (2015) Jablonka P., et al., 2015, A&A, 583, A67
- Jacobson et al. (2015) Jacobson H. R., et al., 2015, ApJ, 807, 171
- Ji et al. (2020a) Ji A. P., et al., 2020a, AJ, 160, 181
- Ji et al. (2020b) Ji A. P., et al., 2020b, ApJ, 889, 27
- Johnson et al. (2020) Johnson B. D., et al., 2020, ApJ, 900, 103
- Johnston et al. (2008) Johnston K. V., Bullock J. S., Sharma S., Font A., Robertson B. E., Leitner S. N., 2008, ApJ, 689, 936
- Jönsson et al. (2018) Jönsson H., et al., 2018, AJ, 156, 126
- Katz et al. (2022) Katz D., et al., 2022, arXiv e-prints, p. arXiv:2206.05902
- Kelson (2003) Kelson D. D., 2003, PASP, 115, 688
- Kirby & Cohen (2012) Kirby E. N., Cohen J. G., 2012, AJ, 144, 168
- Kirby et al. (2013) Kirby E. N., Cohen J. G., Guhathakurta P., Cheng L., Bullock J. S., Gallazzi A., 2013, ApJ, 779, 102
- Lee et al. (2015) Lee D. M., Johnston K. V., Sen B., Jessop W., 2015, ApJ, 802, 48
- Letarte et al. (2010) Letarte B., et al., 2010, A&A, 523, A17
- Li et al. (2019) Li T. S., et al., 2019, MNRAS, 490, 3508
- Li et al. (2022) Li T. S., et al., 2022, ApJ, 928, 30
- Limberg et al. (2021) Limberg G., et al., 2021, ApJ, 913, L28
- Lind et al. (2011) Lind K., Asplund M., Barklem P. S., Belyaev A. K., 2011, A&A, 528, A103
- Lindegren et al. (2021) Lindegren L., et al., 2021, A&A, 649, A2
- Mackereth et al. (2019) Mackereth J. T., et al., 2019, MNRAS, 482, 3426
- Majewski et al. (2003) Majewski S. R., Skrutskie M. F., Weinberg M. D., Ostheimer J. C., 2003, ApJ, 599, 1082
- Malhan et al. (2022) Malhan K., et al., 2022, ApJ, 926, 107
- Martin et al. (2022) Martin N. F., et al., 2022, arXiv e-prints, p. arXiv:2201.01310
- Mateu (2022) Mateu C., 2022, arXiv e-prints, p. arXiv:2204.10326
- Matsuno et al. (2021) Matsuno T., Hirai Y., Tarumi Y., Hotokezaka K., Tanaka M., Helmi A., 2021, A&A, 650, A110
- Matsuno et al. (2022) Matsuno T., et al., 2022, arXiv e-prints, p. arXiv:2203.11808
- Milone et al. (2017) Milone A. P., et al., 2017, MNRAS, 464, 3636
- Milone et al. (2020) Milone A. P., et al., 2020, MNRAS, 491, 515
- Naidu et al. (2020) Naidu R. P., Conroy C., Bonaca A., Johnson B. D., Ting Y.-S., Caldwell N., Zaritsky D., Cargile P. A., 2020, ApJ, 901, 48
- Naidu et al. (2021) Naidu R. P., et al., 2021, ApJ, 923, 92
- Naidu et al. (2022a) Naidu R. P., et al., 2022a, arXiv e-prints, p. arXiv:2204.09057
- Naidu et al. (2022b) Naidu R. P., et al., 2022b, ApJ, 926, L36
- Nidever et al. (2020) Nidever D. L., et al., 2020, ApJ, 895, 88
- Norris et al. (2017) Norris J. E., Yong D., Venn K. A., Gilmore G., Casagrande L., Dotter A., 2017, ApJS, 230, 28
- Price-Whelan (2017) Price-Whelan A. M., 2017, The Journal of Open Source Software, 2
- Price-Whelan & Bonaca (2018) Price-Whelan A. M., Bonaca A., 2018, ApJ, 863, L20
- Price-Whelan et al. (2020) Price-Whelan A., et al., 2020, adrn/gala: v1.3, doi:10.5281/zenodo.4159870, https://doi.org/10.5281/zenodo.4159870
- Reggiani et al. (2021) Reggiani H., Schlaufman K. C., Casey A. R., Simon J. D., Ji A. P., 2021, AJ, 162, 229
- Reichert et al. (2021) Reichert M., Hansen C. J., Arcones A., 2021, ApJ, 912, 157
- Rocha et al. (2012) Rocha M., Peter A. H. G., Bullock J., 2012, MNRAS, 425, 231
- Roederer et al. (2010) Roederer I. U., Sneden C., Thompson I. B., Preston G. W., Shectman S. A., 2010, ApJ, 711, 573
- Roederer et al. (2014) Roederer I. U., Preston G. W., Thompson I. B., Shectman S. A., Sneden C., Burley G. S., Kelson D. D., 2014, AJ, 147, 136
- Safarzadeh et al. (2018) Safarzadeh M., Ji A. P., Dooley G. A., Frebel A., Scannapieco E., Gómez F. A., O’Shea B. W., 2018, MNRAS, 476, 5006
- Santistevan et al. (2020) Santistevan I. B., Wetzel A., El-Badry K., Bland-Hawthorn J., Boylan-Kolchin M., Bailin J., Faucher-Giguère C.-A., Benincasa S., 2020, MNRAS, 497, 747
- Shetrone et al. (2003) Shetrone M., Venn K. A., Tolstoy E., Primas F., Hill V., Kaufer A., 2003, AJ, 125, 684
- Shipp et al. (2018) Shipp N., et al., 2018, ApJ, 862, 114
- Shipp et al. (2019) Shipp N., et al., 2019, ApJ, 885, 3
- Skúladóttir et al. (2019) Skúladóttir Á., Hansen C. J., Salvadori S., Choplin A., 2019, A&A, 631, A171
- Sneden (1973) Sneden C. A., 1973, PhD thesis, University of Texas, Austin
- Sneden et al. (2008) Sneden C., Cowan J. J., Gallino R., 2008, ARA&A, 46, 241
- Sobeck et al. (2011) Sobeck J. S., et al., 2011, AJ, 141, 175
- Tenachi et al. (2022) Tenachi W., Oria P.-A., Ibata R., Famaey B., Yuan Z., Arentsen A., Martin N., Viswanathan A., 2022, arXiv e-prints, p. arXiv:2206.10405
- Ting et al. (2019) Ting Y.-S., Conroy C., Rix H.-W., Cargile P., 2019, ApJ, 879, 69
- Tsujimoto et al. (2017) Tsujimoto T., Matsuno T., Aoki W., Ishigaki M. N., Shigeyama T., 2017, ApJ, 850, L12
- Vasiliev (2019) Vasiliev E., 2019, MNRAS, 482, 1525
- Wang et al. (2022) Wang C., Huang Y., Yuan H., Zhang H., Xiang M., Liu X., 2022, ApJS, 259, 51
- Weinberg et al. (2017) Weinberg D. H., Andrews B. H., Freudenburg J., 2017, ApJ, 837, 183
- Weisz et al. (2014) Weisz D. R., Dolphin A. E., Skillman E. D., Holtzman J., Gilbert K. M., Dalcanton J. J., Williams B. F., 2014, ApJ, 789, 147
- Wetzel et al. (2015) Wetzel A. R., Deason A. J., Garrison-Kimmel S., 2015, ApJ, 807, 49
- Yong et al. (2005) Yong D., Grundahl F., Nissen P. E., Jensen H. R., Lambert D. L., 2005, A&A, 438, 875
- York et al. (2000) York D. G., et al., 2000, AJ, 120, 1579
- Yu et al. (2020) Yu S., et al., 2020, MNRAS, 494, 1539
- de los Reyes et al. (2020) de los Reyes M. A. C., Kirby E. N., Seitenzahl I. R., Shen K. J., 2020, ApJ, 891, 85
- de los Reyes et al. (2022) de los Reyes M. A. C., Kirby E. N., Ji A. P., Nuñez E. H., 2022, ApJ, 925, 66