Vol.0 (20xx) No.0, 000–000
22institutetext: Department of Physics, Visva-Bharati University, Santiniketan, Birbhum, 731235, India biswap@visva-bharati.ac.in
44institutetext: Department of Physics, Indian Institute of Science Education and Research Tirupati, Tirupati - 517507, India 44institutetext: Department of Physics, Indian Institute of Technology Kharagpur, Kharagpur, 721302, India suman2reach@gmail.com
Received 20xx month day; accepted 20xx month day
Do minor interactions trigger star formation in galaxy pairs?
Abstract
We analyze the galaxy pairs in a set of volume limited samples from the SDSS to study the effects of minor interactions on the star formation rate (SFR) and colour of galaxies. We carefully design control samples of the isolated galaxies by matching the stellar mass and redshift of the minor pairs. The SFR distributions and colour distributions in the minor pairs differ from their controls at significance level. We also simultaneously match the control galaxies in stellar mass, redshift and local density to assess the role of the environment. The null hypothesis can be rejected at confidence level even after matching the environment. Our analysis shows a quenching in the minor pairs where the degree of quenching decreases with the increasing pair separation and plateaus beyond 50 kpc. We also prepare a sample of minor pairs with line information. We calculate the SFR of these galaxies using the line and repeat our analysis. We observe a quenching in the sample too. We find that the majority of the minor pairs are quiescent systems that could be quenched due to minor interactions. Combining data from the Galaxy Zoo and Galaxy Zoo2, we find that only galaxies have a dominant bulge, galaxies host a bar, and galaxies show the AGN activity in minor pairs. This indicates that the presence of bulge, bar and AGN activity plays an insignificant role in quenching the galaxies in minor pairs. The more massive companion satisfies the criteria for mass quenching in most of the minor pairs. We propose that the stripping and starvation likely caused the quenching in the less massive companion at a later stage of evolution.
keywords:
methods: statistical – data analysis – galaxies: formation – evolution – cosmology: large scale structure of the Universe.1 Introduction
The formation and the evolution of the galaxies in the Universe remains one of the most challenging problems in modern cosmology. The CDM model is quite successful in explaining most of the cosmological observations on large-scales. However, our understanding of the details of the galaxy formation and evolution within the framework of the CDM model is still incomplete. The first bound objects form in the Universe when the primordial density fluctuations in the dark matter density field collapse into dark matter halos. The galaxies are believed to have formed by the accretion of neutral hydrogen gas onto the dark matter halos and the subsequent cooling and condensation of the gas at the centre of these halos (Rees & Ostriker 1977; Silk 1977; White & Rees 1978; Fall & Efstathiou 1980).
The galaxies are not island universes that evolve in isolation. They are an integral part of an extensive and complex network, namely the cosmic web (Bond, Kofman & Pogosyan 1996). The initial conditions at the location of formation, the assembly history and the interactions with the environment may play crucial roles in the formation and evolution of a galaxy. In the hierarchical scenario, the galaxy interactions and mergers provide an efficient mechanism for the buildup of massive galaxies. Such processes can modify the mass distribution, morphology and the star formation activity in the galaxies. Using simulations of tidal interactions, Toomre et al. (1972) first show that the spiral and irregular galaxies could transform into ellipticals and S0 galaxies. Subsequent studies with more sophisticated simulations (Barnes & Hernquist 1996; Mihos & Hernquist 1996; Tissera et al. 2002; Cox et al. 2006; Matteo, Combes, Melchior & Semelin 2007; Montuori et al. 2010; Rupke, Kewley & Barnes 2010; Torrey et al. 2012; Renaud, Bournaud, Kraljic & Duc 2014) reveal that the tidal torques generated during the encounter can trigger starburst in the interacting galaxies. The efficiency of the tidally triggered star formation is known to depend on several factors such as the amount of available gas, depth of the potential well, morphology, orbital parameters and the internal dynamical properties of the galaxies (Barnes & Hernquist 1996; Tissera 2000; Perez et al. 2006).
The first observational evidence of enhanced star formation in interacting galaxies came from a seminal study of optical colours in the morphologically disturbed galaxies by Larson & Tinsley (1978). Subsequently, many other studies on interacting galaxy pairs from the modern spectroscopic redshift surveys confirm the SFR enhancement at smaller pair separation (Barton, Geller & Kenyon 2000; Lambas et al. 2008; Alonso et al. 2004; Nikolic, Cullen & Alexander 2004; Alonso et al. 2006; Woods, Geller & Barton 2006; Woods & Geller 2007; Barton et al. 2007; Ellison et al. 2008; Heiderman et al. 2009; Knapen & James 2009; Robaina et al. 2009; Ellison et al. 2010; Woods et al. 2010; Patton et al. 2011; Pan et al. 2018; Das, Pandey, & Sarkar 2022). The level of enhancement reported in most of these studies is within a factor of two compared to the isolated galaxies. The enhancement is known to depend on multiple factors such as the separation, luminosity or mass ratio and the type of galaxies involved in the interaction. The changes in the star formation is very often studied as a function of the projected separation because it is believed as an indicator of the merger phase of a galaxy pair. The pairs at smaller separation are most likely undergoing a close passage. On the other hand, the pairs at larger separation may be approaching each other or receding away after their first pericentric passage. Nevertheless, these are difficult to confirm as the projected separation corresponds to a snapshot view of the interaction that does not provide any direct information about the time scale.
The equilibrium model (Dekel, Sari, & Ceverino 2009; Bouché et al. 2010; Davé, Finlator, & Oppenheimer 2011, 2012; Lilly et al. 2013) emerged as a successful model of galaxy evolution over the last decade. The model suggests that the galaxies maintain an equilibrium between inflow, outflow and star formation. The galaxies are perturbed off the equilibrium relations by interactions and mergers. These galaxies tend to be driven back towards equilibrium. The deviations in SFR from the equilibrium relation are correlated with the available gas fraction. So the star formation rate of a galaxy is primarily decided by the available gas mass, which itself is modulated by inflows and outflows of gas. Besides, both the fraction of molecular gas in the cold ISM reservoir and the rate of conversion of molecular gas to stars are also important (Saintonge & Catinella 2022). Saintonge et al. (2012) show that the global SFR is driven by both the molecular gas density and the gas depletion time. The molecular gas properties may be also affected by galaxy interactions. Pan et al. (2018) find that interactions modify the molecular gas properties in galaxy pairs where the magnitude of the effect is sensitive to the pair configuration. Ellison, Catinella, & Cortese (2018) study the atomic Hydrogen gas fraction in post-merger galaxies and find that the enhanced atomic gas fractions in post-mergers are not a consequence of the merger induced star bursts or outflows but arises due to the enhanced turbulence that decreases the star formation efficiency. Thorp et al. (2022) study merger induced starbursts using ALMaQUEST survey and find that the star formation in some mergers are driven by the abundance of molecular gas fuel whereas the star formation efficiency plays a leading role in others. Violino et al. (2018) study the relation between star formation and molecular gas properties in galaxy mergers and find that both interactions and internal processes may lead to molecular gas enhancement and decreased depletion times. All these studies suggest that the available gas mass plays a crucial role for star formation in galaxies. However, the galaxies are diverse in their details and star formation in interacting galaxies also depend on the properties of the interacting pairs. Many of these findings are also supported by parsec-scale galaxy-merger simulations (Renaud, Bournaud, Kraljic & Duc 2014; Moreno et al. 2021) and analysis of galaxy pairs from hydrodynamical simulations (Patton et al. 2020).
The simulations of galaxy interactions suggest that the tidally triggered star formation is more efficient in galaxy pairs with similar stellar mass or luminosity. Such interactions are known as the major interactions. On the other hand, the minor interactions are the interactions between galaxies with a relatively larger mass or luminosity ratio. The minor interactions and mergers are expected to be more frequent in a galaxy’s history since the frequency of mergers of dark matter halos increases with their mass ratio (Lacey & Cole 1993; Fakhouri & Ma 2008). Studies with simulations (Mihos & Hernquist 1994; Masterpietro et al. 2005; Cox et al. 2008) indicate that a lower level of star formation enhancement may also occur in minor mergers after several billion years.
Most of the observational studies of galaxy pairs confirm the tidally triggered star formation in major interactions. However, the issue of star formation enhancement in minor interactions are less clear. In the hierarchical galaxy formation model (Somerville & Primack 1999; Kauffmann, Colberg, Diaferio & White 1999a, b; Diaferio et al. 1999), most interactions and mergers occur between unequal-mass systems due to the greater abundance of low mass and low luminosity galaxies. The minor interactions may thus play a crucial role in galaxy evolution. Any observational study of minor interaction and merger is challenging due to several reasons. The number of minor pairs identified from magnitude limited surveys are far less than the number of major pairs as the galaxies have similar magnitudes in such surveys. It is also difficult to identify the low-luminosity companions around the more luminous members due to the contaminations from the background galaxies. Despite these limitations, the effects of minor interactions on star formation have drawn considerable interest. Lambas et al. (2008) study the star formation enhancement in paired galaxies using 2dFGRS and find a dependence on the relative luminosity of the pairs. Nikolic, Cullen & Alexander (2004) use SDSS to analyze the star formation in paired galaxies and find no dependence on the luminosity of the companion galaxy. Woods, Geller & Barton (2006) analyze data from CfA2 survey and a follow-up search to find that the star formation enhancement in pairs decreases with increasing stellar mass ratio. Woods & Geller (2007) show that the specific SFR of the less massive member in a minor pair is enhanced, whereas the more massive member remains unaffected. Ellison et al. (2008) analyze the SDSS data and find tentative evidence for higher SFR for the less massive companions in minor pairs at a low significance level. Li et al. (2008) also reach a similar conclusion using the SDSS data. Our current understanding of the impact of minor interactions and mergers are far from complete. The observational studies do not provide a conclusive evidence of enhanced star formation in minor pairs in the present Universe.
The Sloan Digital Sky Survey (SDSS) (Strauss et al. 2002) is the largest photometric and spectroscopic redshift survey available at present. The availability of precise spectroscopic information for a large number of galaxies in the SDSS provides an excellent opportunity for the statistical study of minor interactions and their effects on the star formation and colour. We intend to study the SFR and colour of the minor galaxy pairs in the present Universe using the SDSS.
The galaxy colour is strongly correlated with the star formation due to the observed bimodality (Strateva et al. 2001; Baldry et al. 2004; Pandey 2020). The galaxies in the blue cloud are gas rich and they have higher star formation rates. Contrarily, the red sequence hosts the gas poor galaxies with very low to no star formation. The tidal interactions and mergers between galaxies may trigger starbursts or quenching which consequently alter their colours. Such colour changes usually happen on a time scale longer than the starburst or quenching. The effect of tidal interactions on the galaxy pairs can be captured more convincingly if we employ both star formation rate and colour for such studies. We plan to study the star formation rate and the dust corrected colour of the minor galaxy pairs in a set of volume limited samples from the SDSS and compare these with the respective control samples of the isolated galaxies.
The outline of the paper is as follows. We describe the data and the
method of analysis in Section 2, discuss the results in Section 3 and
present our conclusions in Section 4.
Through out the paper we use the CDM cosmological model with
, and
(Planck Collaboration et al. 2018) for conversion of redshift to comoving distance.
2 DATA AND METHOD OF ANALYSIS
2.1 SDSS DR16
The Sloan Digital Sky Survey (SDSS) is a multi-band imaging and spectroscopic redshift survey with a 2.5 m telescope at Apache Point Observatory in New Mexico. The technical details of the SDSS telescope is described in (Gunn et al. 2006) and a description of the SDSS photometric camera can be found in (Gunn et al. 1998). The selection algorithm for the SDSS Main galaxy sample is discussed in (Strauss et al. 2002) and a technical summary of the survey is provided in (York et al. 2000).
We use the sixteenth data release (DR16) of the SDSS to identify the galaxy pairs in the nearby universe. We use the structured query language (SQL) to download the spectroscopic and photometric information of galaxies in DR16 (Ahumada et al. 2020) from the SDSS CasJobs 111https://skyserver.sdss.org/casjobs/. We select a contiguous region of the sky that spans and in equatorial co-ordinates. We consider all the galaxies with band Petrosian magnitudes and construct three volume limited samples by restricting the band absolute magnitude to , and . The details of these samples are provided in the Table 1. The three magnitude bins are not independent of each other. We also tried to construct pair samples using independent magnitude bins. However this drastically reduces the number of available minor pairs. The primary motivation behind the choice of these magnitude bins is to investigate if there are any luminosity dependence of the outcomes of minor interactions.
We obtain the stellar mass and the star formation rate (SFR) of the galaxies from the StellarMassFSPSGranWideNoDust table. These are calculated using the Flexible Stellar Population Synthesis (FSPS) model (Conroy, Gunn & White 2009). We retrieve the information of internal reddening E(B-V) of the galaxies from the emmissionLinesPort table which is based on publicly available Gas AND Absorption Line Fitting (GANDALF) (Sarzi et al. 2006) and penalised PIXEL Fitting (pPXF) (Cappellari & Emsellem 2004). We correct for the dust attenuation in the source galaxy by using its internal reddening E(B-V). While downloading the above information, we consider only those galaxies which have their flag set to 1. This ensures that only the galaxies with high quality spectra are used in our analysis. Further, we obtain morphological information of the galaxies in three volume limited samples by cross-matching their with the galaxies in Galaxy Zoo (Lintott, Schawinski & Slosar et al 2008). We identify elliptical and spiral galaxies respectively as those which have their elliptical and spiral debiased vote fraction 0.8. We also obtain the information about the presence of a dominant bulge and a bar in the galaxies in our sample by cross-matching their with the galaxies in Galaxy Zoo 2 (Willett et al. 2013). We also identify the paired galaxies with an AGN by cross-matching their with the galaxies present in the MPA-JHU spectroscopic catalogue (Brinchmann et al. 2004; Kauffmann et al. 2003b).

| Volume limited sample | |||
|---|---|---|---|
| () | () | () | |
| Number of galaxies | 21984 | 69456 | 85745 |
| Number of pairs | 2581 | 5441 | 3039 |
| Number of paired galaxies | 4032 | 9389 | 5679 |
| Number of isolated galaxies | 17952 | 60067 | 80066 |
2.2 Identification of galaxy pairs
We identify the galaxy pairs using the traditional method based on the application of simultaneous cuts on the projected separation and the velocity difference.
We calculate the projected separation () between any two galaxies in the distribution using the following relation,
| (1) |
where represents the mean distance of the galaxy pair from the observer given by,
| (2) |
Here and carry their usual meaning and in terms of , and redshift is given by the following relation,
| (3) |
The angular separation between the two galaxies is,
| (4) |
Here and are the equatorial co-ordinates of the two galaxies considered.
The difference between the rest frame Hubble velocities of the two galaxies is given by,
| (5) |
In order to select the galaxy pairs, we impose simultaneous cuts on the projected separation and the velocity difference of the two galaxies under consideration. Any two galaxies are considered to form a pair if their projected separation kpc and the rest-frame velocity difference km/s. It is known from earlier studies that the pairs with larger separations are unlikely to be interacting (Patton et al. 2000; De Propris et al. 2007).
An earlier work by Scudder et al. (2012) shows that excluding the galaxies with multiple companions do not alter their results. So we allow a single galaxy to be part of multiple pairs provided they satisfy the criteria imposed on and .
The pair selection algorithm, when applied to the total 350536 galaxies from the contiguous region considered in our analysis, yields a total 24756 galaxy pairs. We then cross-match the galaxies in the volume limited sample for , , with the galaxies in the identified pairs. This provides us with total 2581, 5441, 3039 galaxy pairs present in our volume limited samples corresponding to the three magnitude bins listed in Table 1. We ensure that the matched galaxies in pairs must have measurements of stellar mass, star formation rate and internal reddening. We then impose another cut so as to only consider the pairs with stellar mass ratio . This restriction reduces the available number of galaxy pairs to 2024, 5014 and 3002 in the three volume limited samples considered in our work.
2.3 SDSS fibre collision effect: culling pairs
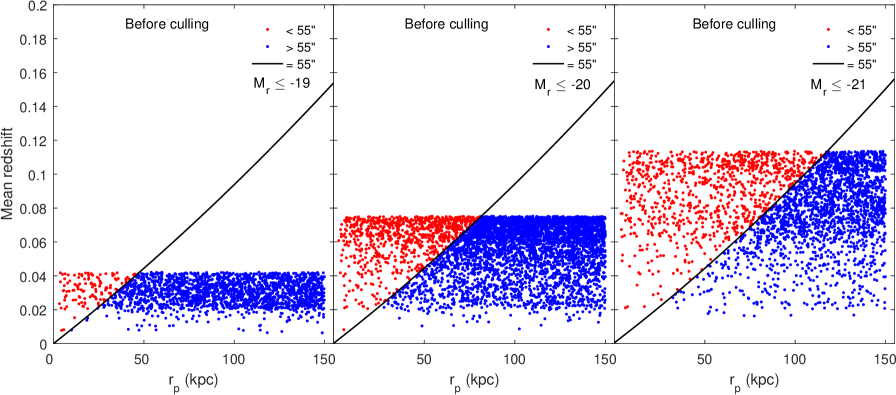
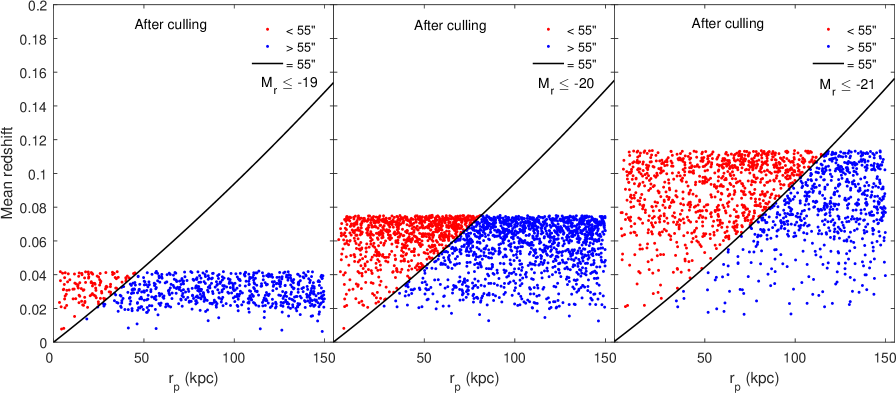
It is important to take into account the spectroscopic incompleteness due to the finite size of the SDSS fibres. The minimum separation of the fibre centres in the SDSS is (Strauss et al. 2002). Consequently, the companion galaxies closer than are preferentially missed. This leads to an under-selection of the closer angular pairs. The galaxies within the collision limit can still be observed if they lie in the overlapping regions between adjacent plates. The ratio of spectroscopic to photometric pairs decreases from at to at lower angular separation (Patton & Atfield 2008). This incompleteness effect can be compensated by randomly culling of galaxies in pairs with the angular separation (Ellison et al. 2008; Patton et al. 2011; Scudder et al. 2012).
Our three volume limited samples for , , respectively contains 2024, 5014 and 3002 galaxy pairs. In a similar spirit to earlier works, we randomly exclude 67.5% of pairs which have their angular separation in all the three samples. The total number of galaxy pairs available for further analysis after culling in the three samples are 737, 2203 and 1600 respectively. The galaxy pairs in the three samples before and after culling are shown in Figure 1.
In the three volume limited samples (, and ), there are respectively , , (Table 1) galaxies that have no identified pairs according to the criteria applied in subsection 2.2. We term these galaxies as isolated and use them to build our control sample as described in the next subsection.
| Redshift | 99% | 90% | 80% | 70% | 60% | 50% | 40% | |||
|---|---|---|---|---|---|---|---|---|---|---|
| 0.0267 | 0.0273 | 0.0483 | 0.0363 | 0.0318 | 0.0289 | 0.0266 | 0.0247 | 0.0230 | ||
| 0.0116 | 0.0123 | 0.0281 | 0.0211 | 0.0185 | 0.0168 | 0.0155 | 0.0144 | 0.0134 | ||
| 0.0181 | 0.0178 | 0.0322 | 0.0242 | 0.0212 | 0.0192 | 0.0177 | 0.0164 | 0.0153 | ||
| Redshift | Local density | 99% | 90% | 80% | 70% | 60% | |||
| 0.0218 | 0.0223 | 0.0205 | 0.0392 | 0.0295 | 0.0258 | 0.0235 | 0.0216 | ||
| SFR | 99% | 90% | 80% | 70% | 60% | 50% | 40% | 30% | |||
|---|---|---|---|---|---|---|---|---|---|---|---|
| 0.1855 | 0.1944 | 0.0686 | 0.0516 | 0.0452 | 0.0411 | 0.0378 | 0.0351 | 0.0327 | 0.0289 | ||
| 0.1412 | 0.1481 | 0.0464 | 0.0349 | 0.0306 | 0.0277 | 0.0256 | 0.0237 | 0.0221 | 0.0202 | ||
| 0.1773 | 0.1908 | 0.0688 | 0.0518 | 0.0454 | 0.0412 | 0.0379 | 0.0352 | 0.0328 | 0.0289 | ||
| Galaxies in minor pairs | 675 | 1479 | 671 |
| after control matching | |||
| Elliptical | 147 | 218 | 123 |
| Spiral | 185 | 402 | 160 |
| Uncertain morphology | 308 | 796 | 351 |
| Morphology not available | 35 | 63 | 37 |
| Dominant bulge | 8 | 13 | 6 |
| Bar | 24 | 56 | 49 |
| AGN | 72 | 98 | 38 |
| Minor pairs | 350 | 756 | 338 |
| after control matching | |||
| Spiral - Spiral | 37 | 66 | 30 |
| Elliptical - Elliptical | 22 | 13 | 12 |
| Spiral - Elliptical | 34 | 51 | 25 |
| SFR | 99% | 90% | 80% | 70% | 60% | 50% | 40% | 30% | |||
| 0.1011 | 0.0843 | 0.0702 | 0.0528 | 0.0463 | 0.0420 | 0.0387 | 0.0359 | 0.0335 | 0.0313 | ||
2.4 Building control sample
The physical properties of interacting galaxies should be compared against carefully designed control sample of non-interacting galaxies. The colour and SFR of galaxies depends on their stellar mass. So it is crucial to ensure that the distributions of stellar mass for the pairs and control samples are statistically indistinguishable. The colour and the star formation activity of galaxies are also known to depend on the redshift. The redshift dependent selection effects can not be eliminated completely even in a volume limited sample. So we also decide to match the redshift distributions of the paired galaxies and control sample of isolated galaxies.
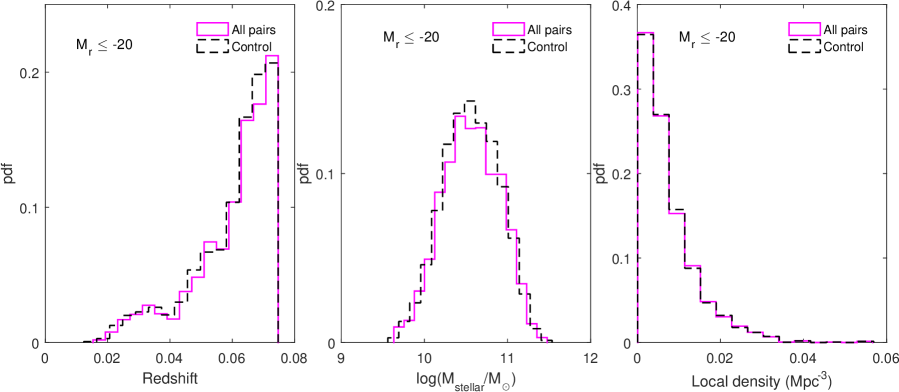
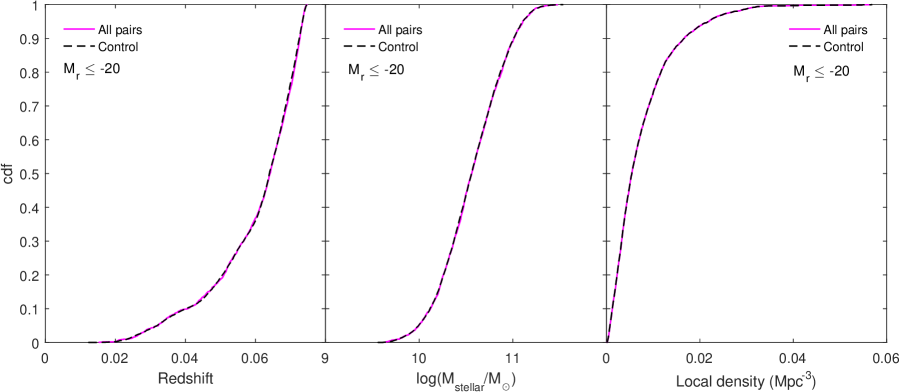
After correcting for the fibre collision effect by culling galaxy pairs as described in subsection 2.3, we have total 737, 2203 and 1600 pairs in the three volume limited samples. We adopt a strategy similar to Ellison et al. (2008) for building the control sample. We build the control sample of the isolated galaxies by simultaneously matching their stellar mass and redshift with that of the paired galaxies. For each paired galaxy, we pick unique isolated galaxies matched in stellar mass and redshift. We match the paired galaxies and their controls within 0.085, 0.050, 0.061 dex in stellar mass and 0.0065, 0.0010, 0.0030 in redshift for the three samples corresponding to the magnitude bins , , respectively. We match every paired galaxy to their controls and then perform a Kolmogorov-Smirnov (KS) test on the stellar mass and redshift distributions. The PDFs and CDFs of the paired and control matched galaxies are shown in Figure 2. The results for the corresponding KS tests are tabulated in Table 2. The control samples are accepted only when their stellar mass and redshift distributions are consistent with that of the paired galaxies at a level of at least KS probability for and KS probability for the remaining two magnitude bins. This implies that the null hypothesis can be rejected at confidence level (Table 2) for and confidence level (Table 2) for and . This ensures that the galaxies in the pair and control samples are highly likely to be drawn from the same parent redshift and stellar mass distributions. The two magnitude bins and contain relatively smaller number of pairs as compared to the magnitude bin . So a somewhat higher threshold for the confidence level was used to prepare the control samples in these two magnitude bins.
All the paired galaxies in our volume limited samples have measurements of stellar mass and redshift. But the condition that there should be at least control galaxies for each paired galaxy reduces the number of available galaxy pairs. After the control matching, we have 737, 2159 and 1592 galaxy pairs in the three volume limited samples corresponding to the magnitude bins , , respectively. These galaxy pairs are formed by a total 1363, 4032, 3074 galaxies respectively. The control sample of these paired galaxies consists of a total 6815, 20160, 15370 isolated galaxies respectively. The control matching in stellar mass and redshift eliminate most of the biases that can plague a comparison between the two samples (Perez, Tissera & Blaizot 2009).
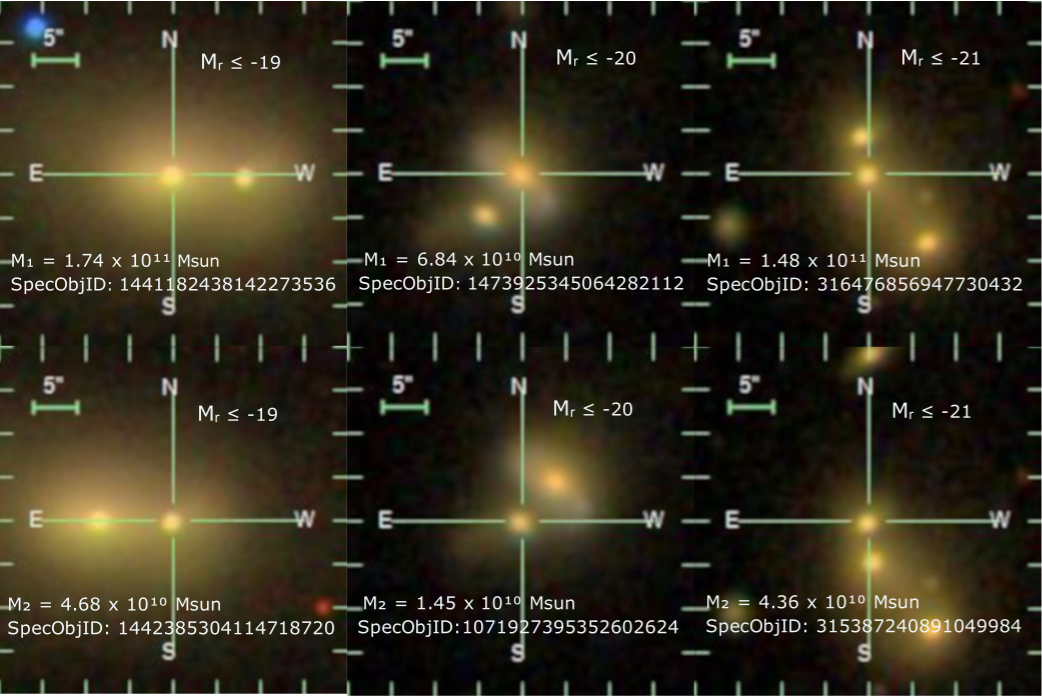
We define minor pairs as those which have their stellar mass ratio in the range . We find that there are 350, 756, 338 minor pairs after control matching in the three volume limited samples corresponding to the magnitude bins , , respectively. These minor pairs are respectively formed by 675, 1479 and 671 galaxies. We note that the minimum projected separation between the galaxies in the minor pairs in all the three volume limited samples are kpc. We show the image of one representative minor pair from each of the three volume limited samples in Figure 10. The and the stellar mass of the member galaxies are provided in each panel of Figure 10.
The environment plays a crucial role in determining the galaxy properties. The paired galaxies may preferentially reside in the high density environments. This may affect any comparison between the colour and SFR of the paired galaxies and the isolated galaxies in our sample. To account this, we also match the local density of the paired and isolated galaxies besides matching their stellar mass and redshift. However, this significantly reduces the number of available minor pairs in our samples. So we simultaneously match the stellar mass, redshift and local density of paired and their controls only for the volume limited sample corresponding to the magnitude bin . Here the paired galaxies and their controls are matched within 0.005 in redshift, 0.08 dex in stellar mass and 0.001 in local density (Mpc-3). The PDFs and CDFs of the paired and control matched galaxies are shown in Figure 3. The results for the corresponding KS tests are tabulated in Table 3. We get a total 1076 pairs after control matching out of which 328 are minor pairs.
We estimate the local number density at the location of each galaxies by using the nearest neighbour method (Casertano & Hut 1985). The local number density is defined as,
| (6) |
Here is the distance between the galaxy and its
nearest neighbour. We choose for the present analysis.
2.5 Colour and SFR offsets
The ongoing interaction between the galaxies in pair can influence their colour and star formation. The paired galaxies would be bluer compared to the control matched isolated galaxies when SFR is enhanced due to the tidal interaction. However, the colour of a galaxy pair can also become redder than the colour of its control matched isolated galaxies. This could happen due to the fact that paired galaxies reside in high density regions than the regions occupied by control sample of isolated galaxies. This reddening of colour is therefore also true for pairs in which interaction between the two members has not started and are in the stage of pre-interaction (Patton et al. 2011). Such a change in colour of the galaxies in pair and their corresponding control galaxies would not be detected individually and only an overall change could be detected by comparing the colour distributions of the entire pair and control samples.
We compute the colour offset of every paired galaxy in our sample with respect its control galaxies. Patton et al. (2011) define the color offset of individual paired galaxy as difference of its colour and the mean colour of its 5 associated control galaxies. Similarly, the colour offset of each control galaxy is defined as the difference of its colour and the mean colour of the remaining 4 control galaxies. Following the strategy, we compute the colour offset of each galaxy in minor pairs and the corresponding control galaxies in each of the three volume limited samples considered in this work. We then compute the difference between the colour offsets of all galaxies in minor pairs and their control galaxies at each projected separation (). We estimate the cumulative mean of this colour offset difference offset) as a function of the projected separation. It maybe noted that if colour of paired and control galaxies represent subsets of the same colour distribution, then the average value of colour offset difference is expected to be zero (Patton et al. 2011).
We also calculate the star formation rate (SFR) offset of each galaxy in minor pairs and their corresponding control galaxies in all the volume limited samples in a similar manner. The cumulative mean of the SFR offset difference ( offset) is estimated as a function of the projected separation. The ( offset) is expected to be positive for SFR enhancement, negative for suppression in SFR and zero when there are no differences in the SFR of the paired galaxies and their controls.
3 Results
3.1 Comparing SFR and colour distributions in the minor pairs and the isolated galaxies after matching the stellar mass and redshift
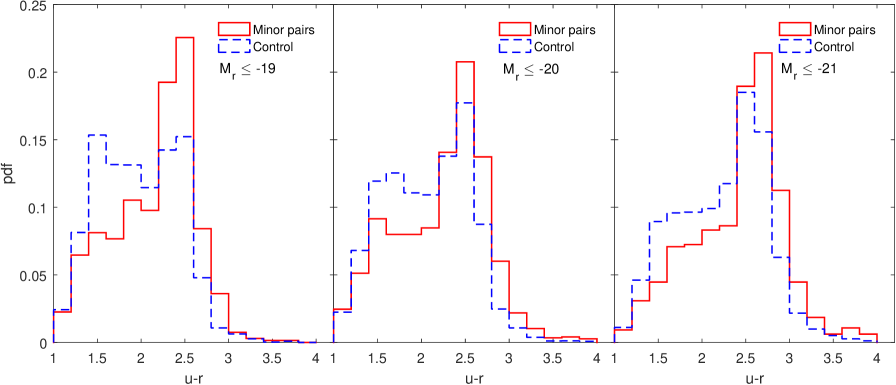
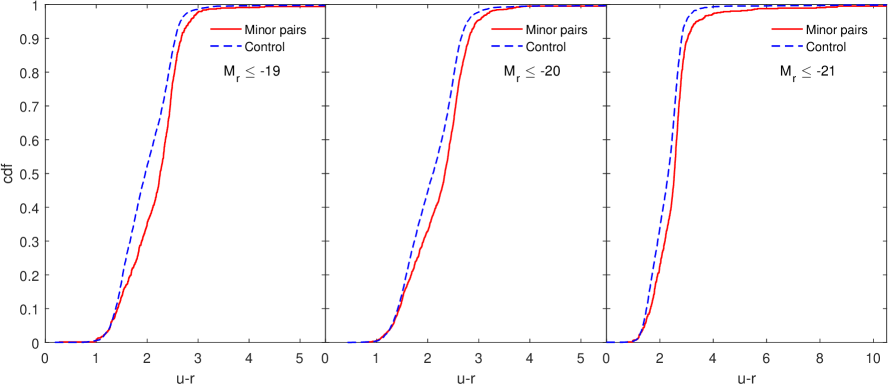
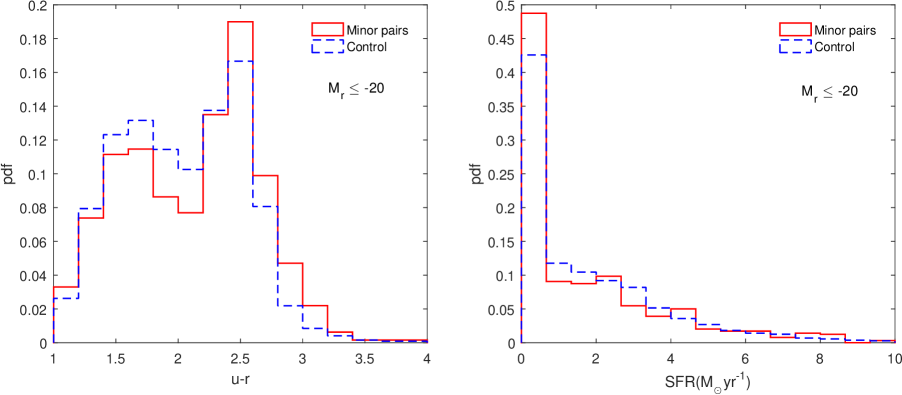
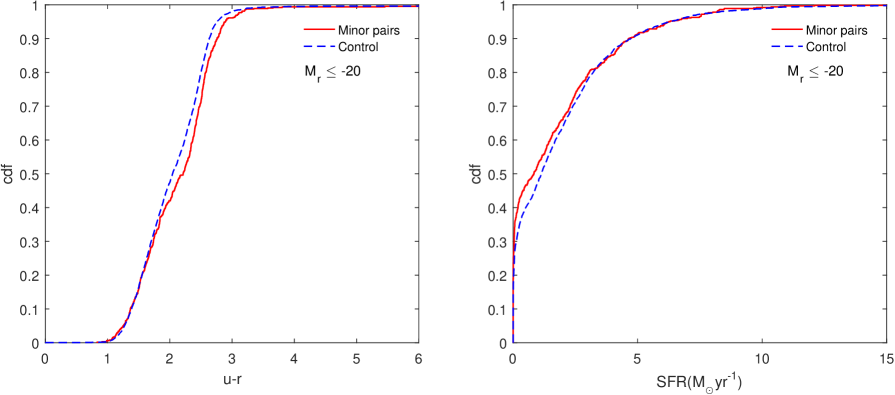
We would like to understand the role of minor interactions on the star formation rate and colour of galaxies in the present Universe. It is important to test whether the galaxies in minor pair and their control sample of isolated galaxies have any differences in their colour and SFR distributions. We compare the colour distribution of the galaxies in minor pairs and their control samples in three volume limited samples in the top three panels of Figure 5. The galaxies can be divided into blue and red classes by employing a cut in their colour. The galaxies with and can be labelled as blue and red respectively (Strateva et al. 2001). We find more red galaxies in the minor pairs compared to their control samples in each of the volume limited samples. Besides, the control samples of the isolated galaxies contain a relatively larger number of blue galaxies than the samples of minor pairs. We also compare the CDFs of the colour for the paired and control galaxies in each volume limited sample in the bottom panels of Figure 5. We perform a KS test to check if the distributions of colour in minor pairs and their control samples are statistically different in a significant manner. The results of the KS test are tabulated in Table 4 which clearly shows that the null hypothesis can be rejected at confidence level for each volume limited sample. So the colour of the minor pairs are significantly different from the galaxies in their control samples.
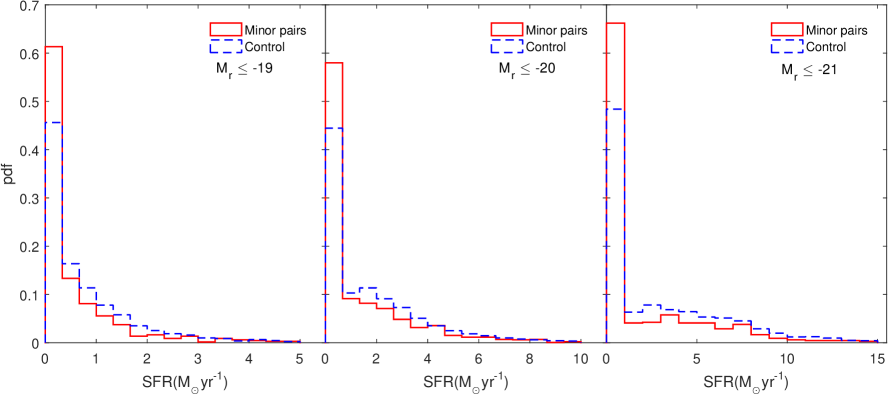
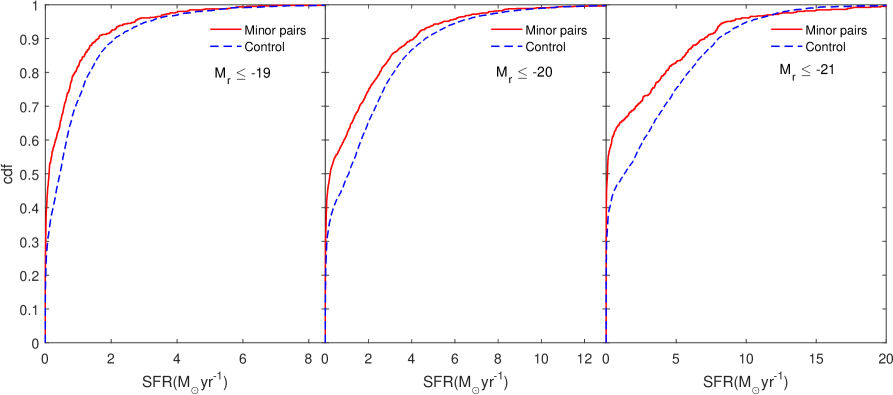
We perform a similar analysis with the SFR of the galaxies in the minor pairs and their controls. The PDFs and CDFs for the paired and isolated galaxies are compared in the top and bottom panels of Figure 6. The top panels of Figure 6 show that the minor pairs contain a larger number of low star-forming galaxies compared to their control samples in each volume limited sample. Noticeably, the number of high star-forming galaxies in the minor pairs is lower than the respective control samples of the isolated galaxies. The results of the KS test for SFR distributions are also tabulated in Table 4. We find that the SFR of the minor pairs and their controls are significantly different, and the null hypothesis can be rejected at confidence level.
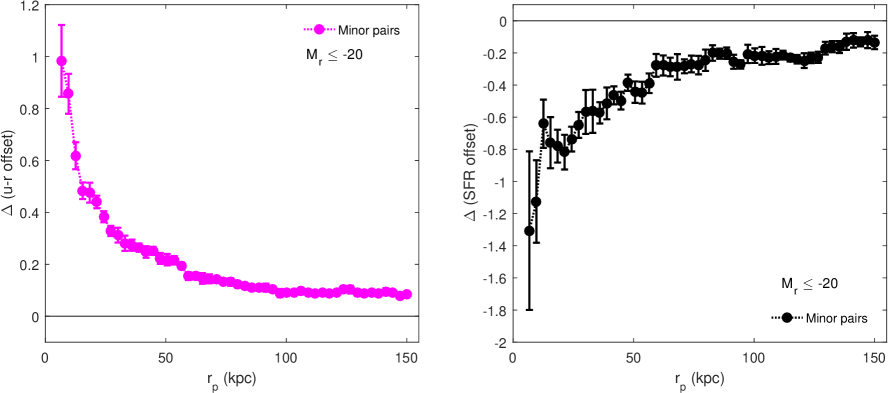
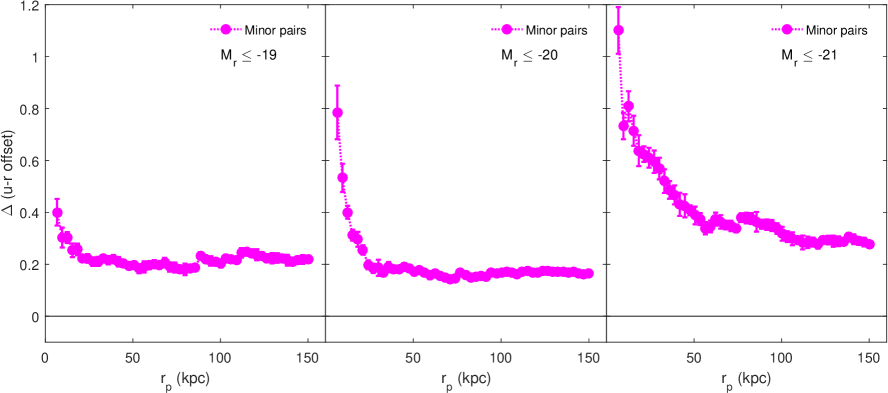
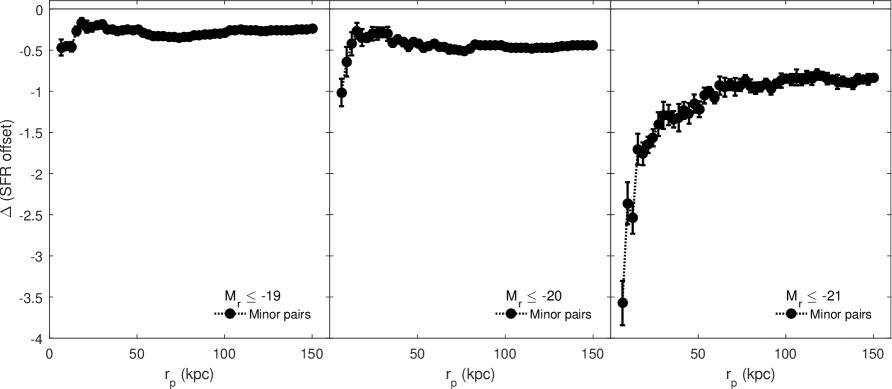
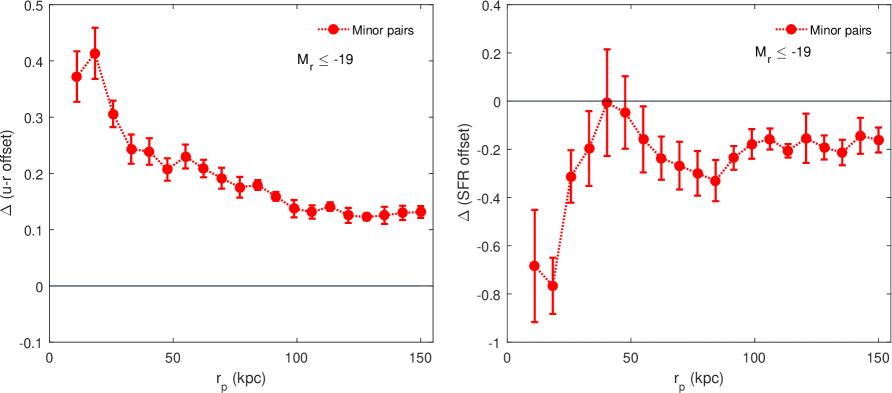
We show the cumulative mean of the offset) as a function of projected separation for the three volume limited samples in the top panels of Figure 8. The results show that the offset) is positive at all pair separations upto 150 kpc. The offset) tends to decrease with increasing pair separation but nearly plateaus beyond 50 kpc in all three volume limited samples. The magnitude of offset) is relatively higher in the brighter samples. The cumulative mean of the ( offset) as a function of projected separation are shown for all three volume limited samples in the bottom panels of Figure 8. The ( offset) is negative throughout the entire pair separation range. The ( offset) increases with increasing pair separation upto a distance of kpc and nearly plateaus out beyond this pair separation. We also note that the magnitude of ( offset) is systematically lower for brighter samples. A higher offset) and lower ( offset) for brighter samples indicate a luminosity dependent quenching. Such trends may arise because brighter pairs reside in denser environments where the galaxies are mostly red.
A positive offset) indicates that, on average, galaxies in minor pairs are redder than galaxies without a close companion. A negative ( offset) corresponds to the suppression of star formation in the minor pairs. So the trends observed in offset) and ( offset) are consistent. Our results indicate that the minor interactions may initiate quenching in galaxies in the present universe. However, it is also important to note that the environment may play an important role in such quenching.
The control samples are matched in stellar mass and redshift, which ensures that any differences in the colour and SFR distributions of the minor pairs and their controls do not arise due to differences in their stellar mass and redshift distributions. The observed differences in colour and SFR may be caused by the differences in their environments. It can be tested by matching the environment of the controls before the comparison.
3.2 Morphology of the galaxies in the minor pairs
It is well known that the tidal interactions may cause gas loss through AGN or shock-driven winds (Murray, Quataert & Thompson 2005; Springel, Matteo & Hernquist 2005), induce bar quenching (Haywood et al. 2016) and morphological quenching (Martig, Bournad, Teyssier & Dekel 2009). We want to check the bar, dominant bulge and AGN occurrences in the minor pairs. We cross-match the minor pairs with the galaxies in Galaxy Zoo (Lintott, Schawinski & Slosar et al 2008) and Galaxy Zoo2 (Willett et al. 2013) to reveal the morphological properties of the member galaxies in minor pairs. The morphological information of the galaxies in the minor pairs is listed in Table 5. It is worthwhile to mention that the morphological information is not available for minor pairs in our sample. We examine only the minor pairs for which the morphological information is available. The Spiral-Spiral and Spiral-Elliptical combinations in minor pairs are more prevalent than the Elliptical-Elliptical combination. Only galaxies in the minor pairs host a bar. A dominant bulge is observed in only of the galaxies in the minor pairs. galaxies in the minor pairs show the AGN activity. We observe that only a small percentage of the galaxies in the minor pairs host bar, dominant bulge or AGN. We do not compare the SFR in minor pairs to that with the galaxies hosting bar, dominant bulge or AGN. Since the galaxies with AGN, bar and dominant bulge are known to initiate quenching in galaxies, a dominance of such galaxies in minor pairs would indicate that the observed quenching in minor pairs are primarily driven by these factors. We do not observe any such trends in our analysis.
3.3 Comparing SFR and colour distributions in the minor pairs and the isolated galaxies after matching the stellar mass, redshift and local density
The quenching in minor pairs may also arise due to the environment. The paired galaxies preferentially reside in the denser environments that host the redder galaxies. So the overabundance of red and low star-forming galaxies in the minor pairs compared to their control sample of isolated galaxies may not be caused by the interactions alone. One needs to compare these properties by also matching the environment of the control galaxies. We prepare the control samples by simultaneously matching the stellar mass, redshift and the local density of the isolated galaxies. We find that such controls can be prepared only for a single volume limited sample () due to the smaller number of minor pairs present in our samples.
We compare the PDFs of colour and SFR in the minor pairs and their control galaxies in the top two panels of Figure 7. Interestingly, the minor pairs still host more red and low star-forming galaxies compared to their controls. The differences in their PDFs are smaller than those observed in Figure 5 and Figure 6 though. The respective CDFs are compared in the two bottom panels of Figure 7. We perform KS tests to quantify the differences in the distributions of colour and SFR in the minor pairs and their control galaxies. The results of the KS tests are listed in Table 6 which clearly show that the null hypothesis can still be rejected at confidence level.
We show the cumulative mean of the offset) and ( offset) as a function of pair separation in the two panels of Figure 9. The Figure 9 exhibits the same trends as observed in the Figure 8. We find that offset) decreases, and ( offset) increases with the increasing pair separation. The dependence of the quenching on the pair separation is noticeable at least upto kpc. The degree of suppression of the star formation in minor pairs remains nearly unchanged at greater separations.
The analysis in this subsection implies that the environment has some role in quenching the star formation in minor pairs. Nevertheless, the signature of quenching in minor pairs persists even after controlling their environment, stellar mass and redshift. It indicates that the minor interaction induces quenching in galaxies in the present Universe.

3.4 Possible limitations of the study
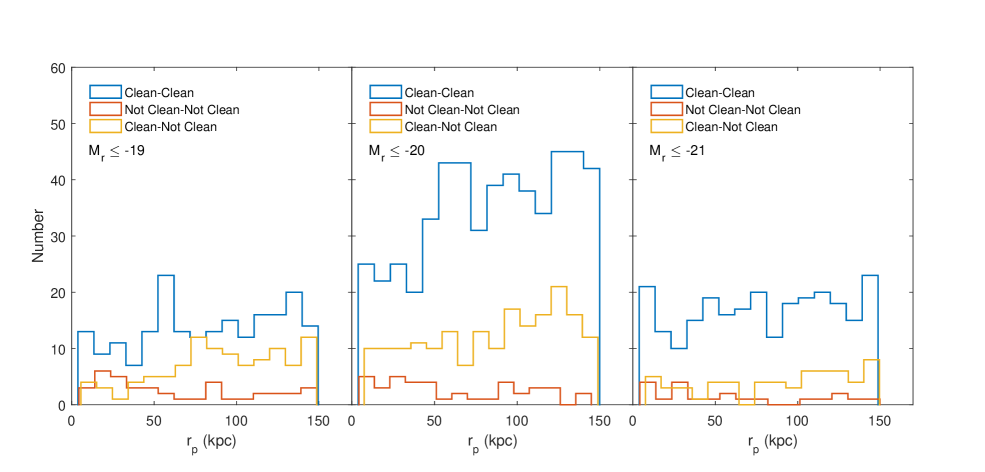
We discuss about a few limitations of our study in this subsection. It is challenging to obtain reliable photometry in blending systems particularly for the low mass galaxies in paired systems. We use the ‘clean’ flag in the SDSS database to check whether the minor merger systems in our samples have a reliable photometry. We show the numbers of pairs with clean or unclean photometry as a function of projected separation in the three volume limited samples in Figure 10. There are a small number of minor pairs present in each sample for which both the members have unclean photometry. We see that the relative abundance of such pairs do not depend on their projected separations. Most of the galaxies in minor pairs have a clean photometry in our samples. However, the pairs with unclean photometry may have some impact on our results. Considering this, we also repeat our analysis with only the minor pairs with clean photometry and find that our conclusions remain unchanged. The quenching observed in minor pairs in our study is statistical and the trends are identical in all three magnitude bins.
It is also challenging to measure the total flux of each galaxy in the merger systems and calculate the individual SFRs accurately. We use the SFRs derived from a catalogue which is based on the stellar population synthesis (SPS) technique (Conroy, Gunn & White 2009). The SPS models translate the observations (SED, magnitudes etc.) to physical properties using a set of fit parameters in the model. We plot the stellar mass versus SFR of the galaxies in minor pairs and their control samples in all three volume limited samples in Figure 11. We find that the galaxies in these samples follow a main sequence relation but with larger scatters at higher masses. This may be related to the substantial uncertainties in the SPS modelling. Such uncertainties may have some impact on our results.
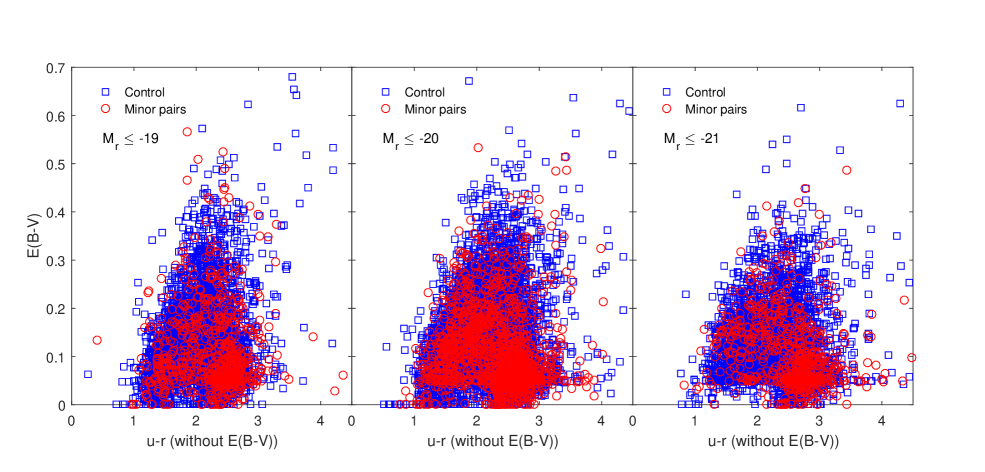
The colour is also affected by the reddening or dust extinction in galaxies. The additional reddening is often quantified with the E(B-V) colour. It is determined by comparing the observed colors of galaxies with the expected colors of an unreddened stellar population. This colour excess affect the intrinsic properties like observed colour and SFR of galaxies. A very large reddening for the galaxies in our sample may in principle affect the results of our analysis. We show the colour excess E(B-V) versus the observed (u-r) colour (without E(B-V) correction) for the minor pairs and their control galaxies in all three volume limited samples in Figure 12. We find that the colour of the minor pairs and their controls are reasonable and similar in all three samples. We do not expect these to affect our conclusions.
3.5 Roles of photometric quality and SFR estimator
We address these limitations of our study by considering only the galaxies with clean photometry and calculating the SFR of the minor pairs using the line. It is crucial to identify the galaxies having reliable photometry for any analysis with galaxy pairs. Some of the galaxies in our minor pair sample do not have reliable photometry. We only consider the galaxies with a reliable photometry by using the ’clean’ flag in the SDSS database. The brightest magnitude bin in our sample may include some BCGs with their satellites as minor pairs. It shows a higher degree of quenching compared to the other two magnitude bins (Figure 8). The inclusion of BCGs may be responsible for a higher quenching signal in the brightest magnitude bin. Keeping this in mind, we only repeat our analysis in the faintest magnitude bin () considered in our analysis. We now have minor pairs in this bin that have clean photometry and line information. The control samples for these minor pairs are obtained following the same method described in subsection 2.4.
Our results could be sensitive to different SFR estimators. We calculate the SFR of minor pairs and their control matched sample using the emission line of these galaxies. The SFR of these galaxies are estimated using the formula (Hopkins et al. 2003),
| (7) |
Here , are stellar absorption corrected and fluxes respectively. The , are the Petrosian and fiber magnitudes in the band of SDSS and represents the luminosity distance of the galaxies. The information about the spectral lines of minor pairs and their control matched sample is obtained from the SDSS database by matching their s. The cumulative median of the colour offset difference and SFR offset difference are shown as a function of projected separation in Figure 13. The results show a positive value of colour offset difference and negative value of SFR offset difference for nearly the entire pair separation range. We find that our results do not change after we discard the galaxies with unreliable photometry and employ a different SFR estimator for our analysis.
4 Conclusions
We study the effects of tidal interactions on the SFR, and the dust corrected colour of the minor pairs using a set of volume limited samples from the SDSS. We first prepare our control samples by matching the stellar mass and redshift and then compare the SFR and colour in the minor pairs against their control samples of isolated galaxies. The analysis shows that the SFR and colour distributions of minor pairs significantly differ from their control galaxies in all three volume limited samples. The null hypothesis can be rejected at confidence level. Both the offset) and the ( offset) as a function of pair separation indicate a quenching in minor pairs. The degree of quenching decreases with the increasing pair separation upto kpc. The minor pairs in the brighter samples exhibit a higher quenching at a fixed pair separation. The more luminous galaxies preferentially reside in the denser environments where the galaxies are known to be redder. This luminosity dependence indicates some role of the environment in quenching the galaxies in minor pairs.
The control samples of the minor pairs must also be matched in the environment besides the stellar mass and redshift. We repeat our analysis with carefully designed control samples that are simultaneously matched in stellar mass, redshift and the local density. Interestingly, the SFR and colour distributions of the minor pairs significantly differ from their control galaxies. The null hypothesis can still be rejected at confidence level. We find that the offset) and the ( offset) as a function of pair separation still indicate a quenching in minor pairs even after controlling their environment. The degree of quenching is sensitive to the pair separation upto kpc. Our results suggest that the minor interactions suppress the SFR and enhance the colour in galaxies. The suppression of the SFR decreases with the increasing pair separation but a non-zero suppression is observed throughout the length scale probed. There is observational evidence that SFR in paired galaxies may be influenced by tidal interactions up to kpc (Scudder et al. 2012; Patton et al. 2013).
The present analysis indicates that the minor interactions suppress the SFR and enhance the colour in galaxies. This result seemingly contradicts some of the findings reported in Scudder et al. (2012). This difference most likely arises due to the different treatment of environments. We use the density estimates in three-dimension using redshift information whereas Scudder et al. (2012) use the projected densities for their work. Our pair sample is defined within a volume limited sample whereas the pair sample in Scudder et al. (2012) was defined within a flux limited sample. Most of the selection biases are taken into account in a volume limited sample. The local density can be estimated more reliably within a volume limited sample. We would like to mention here that we indeed observe an enhanced star formation in interacting major pairs (Das et al. 2021; Das, Pandey, & Sarkar 2022) in our analysis with volume limited samples. However, we observe an opposite trend for the minor pairs.
We also analyze the morphology of the minor pairs by cross-matching the paired galaxies with the Galaxy Zoo and Galaxy Zoo2. The Spiral-Spiral and Spiral-Elliptical combinations are more frequently observed than the Elliptical-Elliptical combinations in the minor pairs. We note that only galaxies have a dominant bulge, galaxies host a bar, and galaxies show the AGN activity in the minor pairs. It suggests that the bar, bulge and AGN activity do not take a leading role in quenching the galaxies in the minor pairs.
The minor interactions are believed to trigger a mild enhancement in the star formation activity in the past. However, we do not find such enhancement in the star formation activity in the minor pairs in the local Universe. Our analysis indicates that the minor interactions in the present Universe initiate quenching in galaxies. The degree of quenching decreases with the increasing pair separation. A significant number of galaxies in the minor pairs have a stellar mass above which are intrinsically redder and less star-forming (Kauffmann et al. 2003a). We propose that the more massive members in the minor pairs may curtail their star formation through mass quenching (Binney 2004; Birnboim & Dekel 2003; Dekel & Birnboim 2006; Das, Pandey & Sarkar 2021) or major merger-driven quenching (Gabor et al. 2010; Rodríguez Montero et al. 2019). They possibly quench the star formation in their less massive companions at a later stage by stripping away the gas and leading them to starvation (Larson, Tinsley & Caldwell 1980; Somerville & Primack 1999; Kawata & Mulchaey 2008). It should be noted that the control galaxies in our analysis are matched in stellar mass. So any mass driven quenching would be equally effective in the control matched samples of isolated galaxies. However any quenching induced by the interactions would be present only in the minor paired galaxies.
We carefully select the control galaxies by closely matching the redshift, stellar mass and environment. It eliminates the biases in our results. Any other systematic biases should equally affect both the samples and should not be a matter of concern here. However, a few caveats remain in our analysis. All the galaxies in close pairs may not be undergoing interactions. Some pairs may be approaching each other and are yet to experience an encounter. Also some of the selected pairs may not be close in three dimensions due to the chance superposition in the high-density regions like groups and clusters (Alonso et al. 2004). Nevertheless, these caveats plague all previous analysis of galaxy pairs with observational data.
Any stellar mass incompleteness present in the pair and control samples would spoil the comparisons between their colour and SFR. We also apply stellar mass limit to our volume limited samples and repeat our entire analysis. We find that our conclusions remain unchanged in such an analysis.
We note that some galaxies in our minor pair sample have unreliable photometry. The SFR estimates used in our analysis are derived from the SED fitting. These estimates have large uncertainities at higher stellar masses. We also notice a larger quenching signal for the brightest magnitude bin in our analysis (Figure 8). This indicates that the brightest magnitude bin may contain a significant number of BCGs with their quenched satellite galaxies. Keeping these issues in mind, we select only the galaxies with clean photometry in the faintest magnitude bin. We estimate the SFR of these minor pairs and their control matched sample using the line in these galaxies. We repeat our analysis to calculate the SFR and colour offsets in the faintest magnitude bin. The results show that we still obtain a quenching signal in the faintest magnitude bin. This suggests that the quenching phenomena in minor pairs in our work can not be explained by the unclean photometry, contaminations from BCGs and differences between the SFR estimators.
Observations indicate that the star formation in galaxies peaked at a redshift of (Tran et al. 2010; Förster Schreiber & Wuyts 2020; Gupta et al. 2020). This epoch is often referred as the “cosmic noon”. The minor interactions may trigger star formation in galaxies in the early stages of their evolution. The tidal interactions are more effective in inducing star formation during this period due to the lack of stability in the galaxies (Tissera et al. 2002). The minor interactions may have contributed significantly to the rapid rise in cosmic star formation rate during the “cosmic noon”. The cosmic star formation rate declines sharply between to (Madau et al. 1996).
We find that a significant number of minor pairs in our sample have a very low SFR. These quiescent galaxies could be quenched due to multiple reasons. For example, the environment may have some role in such quenching. The presence of bar, dominant bulge and AGN may also play some roles in quenching the galaxies in minor pairs. However, they do not explain the quenching in most minor pairs. We expect the more massive companion to be mass quenched or merger quenched in most minor pairs. We propose that the less massive companion may experience a satellite quenching at a later stage of evolution (van den Bosch et al. 2008; Wright et al. 2022). However, these alternate scenarios can not be verified in this work and require further studies. The quenching by minor interactions in the present Universe would contribute significantly to the build-up of the red sequence and the observed bimodality. We propose that this should be taken into account while modelling the observed bimodality.
5 ACKNOWLEDGEMENT
We sincerely thank an anonymous reviewer for the insightful comments and suggestions that helped us to improve the draft. The authors thank the SDSS team for making the data publicly available. BP would like to acknowledge financial support from the SERB, DST, Government of India through the project CRG/2019/001110. BP would also like to acknowledge IUCAA, Pune for providing support through associateship programme. SS acknowledges IISER Tirupati for support through a postdoctoral fellowship.
Funding for the SDSS and SDSS-II has been provided by the Alfred P. Sloan Foundation, the Participating Institutions, the National Science Foundation, the U.S. Department of Energy, the National Aeronautics and Space Administration, the Japanese Monbukagakusho, the Max Planck Society, and the Higher Education Funding Council for England. The SDSS website is http://www.sdss.org/.
The SDSS is managed by the Astrophysical Research Consortium for the Participating Institutions. The Participating Institutions are the American Museum of Natural History, Astrophysical Institute Potsdam, University of Basel, University of Cambridge, Case Western Reserve University, University of Chicago, Drexel University, Fermilab, the Institute for Advanced Study, the Japan Participation Group, Johns Hopkins University, the Joint Institute for Nuclear Astrophysics, the Kavli Institute for Particle Astrophysics and Cosmology, the Korean Scientist Group, the Chinese Academy of Sciences (LAMOST), Los Alamos National Laboratory, the Max-Planck-Institute for Astronomy (MPIA), the Max-Planck-Institute for Astrophysics (MPA), New Mexico State University, Ohio State University, University of Pittsburgh, University of Portsmouth, Princeton University, the United States Naval Observatory, and the University of Washington.
6 DATA AVAILABILITY
The data underlying this article are publicly available at https://skyserver.sdss.org/casjobs/.
References
- Ahumada et al. (2020) Ahumada, R., Allende Prieto, C., Almeida, A., Anders, F., Anderson, S. F., Andrews, B. H., Anguiano, B., et al., 2020, ApJS, 249, 3
- Alonso et al. (2006) Alonso, M. S., Lambas, D. G., Tissera, P., Coldwell, G., 2006, MNRAS, 367, 1029
- Alonso et al. (2004) Alonso, M. S., Tissera, P. B., Coldwell, G., Lambas, D. G., 2004, MNRAS, 352, 1081
- Baldry et al. (2004) Baldry, I. K., Glazebrook, K., Brinkmann, J., Ivezić, Ž., Lupton, R. H., Nichol, R. C. & Szalay, A. S., ApJ, 600, 681
- Barton, Geller & Kenyon (2000) Barton, E. J., Geller, M. J., Kenyon, S. J., 2000, ApJ, 530, 660
- Barton et al. (2007) Barton, E. J., Arnold, J. A., Zentner, A. R., Bullock, J. S., Wechsler, R. H., 2007, ApJ, 671, 1538
- Barnes & Hernquist (1996) Barnes, J. E., Hernquist, L., 1996, ApJ, 471, 115
- Binney (2004) Binney, J., 2004, MNRAS, 347, 1093
- Birnboim & Dekel (2003) Birnboim, Y., & Dekel, A., 2003, MNRAS, 345, 349
- Bond, Kofman & Pogosyan (1996) Bond, J. R., Kofman, L., & Pogosyan, D., 1996, Nature, 380, 603
- Bouché et al. (2010) Bouché N., Dekel A., Genzel R., Genel S., Cresci G., Förster Schreiber N. M., Shapiro K. L., et al., 2010, ApJ, 718, 1001
- Brinchmann et al. (2004) Brinchmann, J., Charlot, S., White, S. D. M., Tremonti, C., Kauffmann, G., Heckman, T., & Brinkmann, J., 2004, MNRAS, 351, 1151
- Cappellari & Emsellem (2004) Cappellari, M. & Emsellem, E., 2004, PASP, 116, 138
- Casertano & Hut (1985) Casertano, S., & Hut, P., 1985, ApJ, 298, 80
- Conroy, Gunn & White (2009) Conroy, C., Gunn, J. E., & White, M., 2009, ApJ, 699, 486
- Cox et al. (2006) Cox, T. J. , Jonsson, P., Primack, J. R., Somerville, R. S., 2006, MNRAS, 373, 1013
- Cox et al. (2008) Cox, T. J., Jonsson, P., Somerville, R. S., Primack, J. R., Dekel, A., 2008, MNRAS, 384, 386
- Das, Pandey & Sarkar (2021) Das, A., Pandey, B., & Sarkar, S., 2021, JCAP, 06, 045
- Das et al. (2021) Das A., Pandey B., Sarkar S., Dutta A., 2021, arXiv:2108.05874
- Das, Pandey, & Sarkar (2022) Das A., Pandey B., Sarkar S., 2023, RAA, 23, 025016
- Davé, Finlator, & Oppenheimer (2011) Davé R., Finlator K., Oppenheimer B. D., 2011, MNRAS, 416, 1354
- Davé, Finlator, & Oppenheimer (2012) Davé R., Finlator K., Oppenheimer B. D., 2012, MNRAS, 421, 98
- De Propris et al. (2007) De Propris, R., Conselice, C. J., Liske, J., Driver, S. P., Patton, D. R., Graham, A. W., Allen, P. D., 2007, ApJ, 666, 212
- Dekel & Birnboim (2006) Dekel, A., & Birnboim, Y., 2006, MNRAS, 368, 2
- Dekel, Sari, & Ceverino (2009) Dekel A., Sari R., Ceverino D., 2009, ApJ, 703, 785
- Diaferio et al. (1999) Diaferio, A., Kauffmann, G., Colberg, J. M., White, S. D. M., 1999, MNRAS, 307, 537
- Ellison et al. (2008) Ellison, S. L., Patton, D. R., Simard, L., McConnachie, A. W., 2008, AJ, 135, 1877
- Ellison et al. (2010) Ellison, S. L., Patton, D. R., Simard, L., McConnachie, A. W.,Baldry, I. K., Mendel, J. T., MNRAS, 407, 1514
- Ellison, Catinella, & Cortese (2018) Ellison S. L., Catinella B., Cortese L., 2018, MNRAS, 478, 3447
- Fakhouri & Ma (2008) Fakhouri, O., Ma, C.-P., 2008, MNRAS, 386, 577
- Fall & Efstathiou (1980) Fall, S. M., & Efstathiou, G., 1980, MNRAS, 193, 189
- Förster Schreiber & Wuyts (2020) Förster Schreiber N. M., Wuyts S., 2020, ARA&A, 58, 661
- Gabor et al. (2010) Gabor J. M., Davé R., Finlator K., Oppenheimer B. D., 2010, MNRAS, 407, 749
- Gupta et al. (2020) Gupta A., Tran K.-V., Cohn J., Alcorn L. Y., Yuan T., Rodriguez-Gomez V., Harshan A., et al., 2020, ApJ, 893, 23
- Gunn et al. (2006) Gunn, J. E., Siegmund, W. A., Mannery, E. J., Owen, R. E., Hull, C. L., Leger, R. F., Carey, L. N., et al., 2006, AJ, 131, 2332
- Gunn et al. (1998) Gunn, J. E., Carr, M., Rockosi, C., Sekiguchi, M., Berry, K., Elms, B.,Has, E. de, et al., 1998, AJ, 116, 3040
- Haywood et al. (2016) Haywood, M., Lehnert, M. D., Di Matteo, P., Snaith, O., Schultheis, M., Katz, D., & Gómez, A., 2016, A&A, 589, A66
- Heiderman et al. (2009) Heiderman, A., Jogee, S., Marinova, I., van Kampen, E., Barden, M., Peng, C. Y., Heymans, C. et al., 2009, ApJ, 705, 1433
- Hopkins et al. (2003) Hopkins A. M., Miller C. J., Nichol R. C., Connolly A. J., Bernardi M., Gómez P. L., Goto T., et al., 2003, ApJ, 599, 971
- Kauffmann, Colberg, Diaferio & White (1999a) Kauffmann, G., Colberg, J. M., Diaferio, A., White, S. D. M., 1999, MNRAS, 303, 188
- Kauffmann, Colberg, Diaferio & White (1999b) Kauffmann, G., Colberg, J. M., Diaferio, A., White, S. D. M., 1999, MNRAS, 307, 529
- Kauffmann et al. (2003a) Kauffmann, G., Heckman, T. M., White, S. D. M., Charlot, S., Tremonti, C., Peng, E. W., Seibert, M. et al., 2003, MNRAS, 341, 54
- Kauffmann et al. (2003b) Kauffmann, G., Heckman, T. M., White, S. D. M., Charlot, S., Tremonti, C., Brinchmann, J., Bruzual, G. et al., 2003, MNRAS, 341, 33
- Kawata & Mulchaey (2008) Kawata, D., & Mulchaey, J. S., 2008, ApJL, 672, L103
- Knapen & James (2009) Knapen, J. H., James, P. A., 2009, ApJ, 698, 1437
- Lacey & Cole (1993) Lacey, C., Cole, S., 1993, MNRAS, 262, 627
- Lambas et al. (2008) Lambas D. G., Tissera, P. B., Alonso, M. S., Coldwell, G., 2008, MNRAS, 346, 1189
- Larson, Tinsley & Caldwell (1980) Larson, R. B., Tinsley, B. M., & Caldwell, C. N., 1980, ApJ, 237, 692
- Larson & Tinsley (1978) Larson R. B., Tinsley B. M., 1978, ApJ, 219, 46
- Li et al. (2008) Li, C., Kauffmann, G., Heckman, T. M., White, S. D. M., Jing, Y. P., 2008, MNRAS, 385, 1915
- Lilly et al. (2013) Lilly S. J., Carollo C. M., Pipino A., Renzini A., Peng Y., 2013, ApJ, 772, 119
- Lintott, Schawinski & Slosar et al (2008) Lintott, C. J., Schawinski, K., Slosar, A. et al., MNRAS, 389, 1179 (2008)
- Madau et al. (1996) Madau, P., Ferguson, H. C., Dickinson, M. E. , Giavalisco, M., Steidel, C. C. , & Fruchter, A., 1996, MNRAS, 283, 1388
- Martig, Bournad, Teyssier & Dekel (2009) Martig, M., Bournaud, F., Teyssier, R., & Dekel, A., 2009, ApJ, 707, 250
- Masterpietro et al. (2005) Mastropietro, C., Moore, B., Mayer, L., Wadsley, J., Stadel,J., 2005, MNRAS, 363, 509
- Matteo, Combes, Melchior & Semelin (2007) Matteo, P. Di., Combes,F., Melchior, A.-L., Semelin, B., 2007, A&A, 468, 61
- Mihos & Hernquist (1996) Mihos, J. C., Hernquist, L., 1996, ApJ, 464, 641
- Mihos & Hernquist (1994) Mihos, J. C., Hernquist, L., 1994, ApJL, 425, L13
- Montuori et al. (2010) Montuori M., Matteo, P. Di., Lehnert, M. D., Combes, F., Semelin, B., 2010, A&A, 518, A56
- Moreno et al. (2021) Moreno J., Torrey P., Ellison S. L., Patton D. R., Bottrell C., Bluck A. F. L., Hani M. H., et al., 2021, MNRAS, 503, 3113
- Murray, Quataert & Thompson (2005) Murray, N., Quataert, E., & Thompson, T. A., 2005, ApJ, 618, 569
- Nikolic, Cullen & Alexander (2004) Nikolic, B., Cullen, H., Alexander, P., 2004, MNRAS, 355, 874
- Pandey (2020) Pandey B., 2020, MNRAS, 499, L31
- Pan et al. (2018) Pan H.-A., Lin L., Hsieh B.-C., Xiao T., Gao Y., Ellison S. L., Scudder J. M., et al., 2018, ApJ, 868, 132
- Patton et al. (2000) Patton, D. R., Carlberg, R. G., Marzke, R. O., Pritchet, C. J., da Costa, L. N., Pellegrini, P. S., 2000, ApJ, 536, 153
- Patton et al. (2011) Patton, D. R., Ellison, S. L., Simard, L., McConnachie, A. W., Mendel, J. T., 2011, MNRAS, 412, 591
- Patton et al. (2013) Patton, D. R., Torrey, P., Ellison, S. L., Mendel, J. T., Scudder, J. M., 2013, MNRAS, 433, L59
- Patton et al. (2020) Patton D. R., Wilson K. D., Metrow C. J., Ellison S. L., Torrey P., Brown W., Hani M. H., et al., 2020, MNRAS, 494, 4969
- Patton & Atfield (2008) Patton, D. R., Atfield, J. E., 2008, ApJ, 685, 235
- Perez et al. (2006) Perez, M. J., Tissera, P. B., Lambas, D. G., Scannapieco, C., 2006, A&A, 449, 23
- Perez, Tissera & Blaizot (2009) Perez, J., Tissera, P. & Blaizot, J., 2009, MNRAS, 397, 748
- Planck Collaboration et al. (2018) Planck Collaboration, Aghanim, N., Akrami, Y., Ashdown, M., Aumont, J., Baccigalupi, C., Ballardini, M., et al., 2018, A&A, 641, A6
- Rees & Ostriker (1977) Rees, M. J. & Ostriker, J. P., 1977, MNRAS,179, 541
- Renaud, Bournaud, Kraljic & Duc (2014) Renaud, F., Bournaud, F., Kraljic, K., Duc, P.-A., 2014, MNRAS, 442, L33
- Robaina et al. (2009) Robaina, A. R., Bell, E. F., Skelton, R. E., Mcintosh, D. H., Somerville, R. S., Zheng, X., Rix, H.-W. et al., 2009, ApJ, 704, 324
- Rodríguez Montero et al. (2019) Rodríguez Montero F., Davé R., Wild V., Anglés-Alcázar D., Narayanan D., 2019, MNRAS, 490, 2139
- Rupke, Kewley & Barnes (2010) Rupke, D. S. N., Kewley, L. J., Barnes, J. E., 2010, ApJL, 710, L156
- Saintonge & Catinella (2022) Saintonge A., Catinella B., 2022, ARA&A, 60, 319
- Saintonge et al. (2012) Saintonge A., Tacconi L. J., Fabello S., Wang J., Catinella B., Genzel R., Graciá-Carpio J., et al., 2012, ApJ, 758, 73
- Sarzi et al. (2006) Sarzi, M., Falcón-Barroso, J., Davies, R. L., Bacon, R., Bureau, M., Cappellari, M., de Zeeuw, P. T. et al., 2006, MNRAS, 366, 1151
- Scudder et al. (2012) Scudder, J. M., Ellison, S. L., Torrey P., Patton, D. R., Mendel, J. T., 2012, MNRAS, 426, 549
- Silk (1977) Silk, J., 1977 ApJ, 211, 638
- Somerville & Primack (1999) Somerville, R. S. , & Primack, J. R., 1999, MNRAS, 310, 1087
- Springel, Matteo & Hernquist (2005) Springel, V., Di Matteo, T., & Hernquist, L., 2005, MNRAS,361, 776
- Strauss et al. (2002) Strauss, M. A., Weinberg, D. H., Lupton, R. H., Narayanan, V. K., Annis, J., Bernardi, M., Blanton, M., et al., 2002, AJ, 124, 1810
- Strateva et al. (2001) Strateva I., Ivezić Ž., Knapp G. R., Narayanan V. K., Strauss M. A., Gunn J. E., Lupton R. H., et al., 2001, AJ, 122, 1861
- Thorp et al. (2022) Thorp M. D., Ellison S. L., Pan H.-A., Lin L., Patton D. R., Bluck A. F. L., Walters D., et al., 2022, MNRAS, 516, 1462
- Tissera (2000) Tissera, P. B., 2000, ApJ, 534, 636
- Tissera et al. (2002) Tissera, P. B., Domínguez-Tenreiro, R., Scannapieco, C., Sáiz, A., 2002, MNRAS, 333, 327
- Toomre et al. (1972) Toomre, A., Toomre, J., 1972 , ApJ, 178, 623
- Torrey et al. (2012) Torrey, P., Cox, T. J., Kewley, L., Hernquist, L., 2012, ApJ, 746, 108
- Tran et al. (2010) Tran K.-V. H., Papovich C., Saintonge A., Brodwin M., Dunlop J. S., Farrah D., Finkelstein K. D., et al., 2010, ApJL, 719, L126
- van den Bosch et al. (2008) van den Bosch F. C., Aquino D., Yang X., Mo H. J., Pasquali A., McIntosh D. H., Weinmann S. M., et al., 2008, MNRAS, 387, 79
- Violino et al. (2018) Violino G., Ellison S. L., Sargent M., Coppin K. E. K., Scudder J. M., Mendel T. J., Saintonge A., 2018, MNRAS, 476, 2591
- White & Rees (1978) White, S. D. M., & Rees,M. J., 1978 MNRAS, 183, 341
- Willett et al. (2013) Willett, K. W., Lintott, C. J., Bamford, S. P., Masters, K. L., Simmons, B. D., Casteels, K. R. V., Edmondson, E. M. et al., 2013, MNRAS, 435, 2835
- Woods et al. (2010) Woods, D. F., Geller, M. J., Kurtz, M. J., Westra, E., Fabricant, D. G., Dell’Antonio, I., 2010, AJ, 139, 1857
- Woods & Geller (2007) Woods, D. F., Geller, M. J., 2007, AJ, 134, 527
- Woods, Geller & Barton (2006) Woods, D. F., Geller, M. J., Barton, E. J., 2006, AJ, 132, 197
- Wright et al. (2022) Wright R. J., Lagos C. del P., Power C., Stevens A. R. H., Cortese L., Poulton R. J. J., 2022, arXiv:2205.08414
- York et al. (2000) York, D. G., et al., 2000, AJ, 120, 1579