11email: jose.cernicharo@csic.es 22institutetext: Centro de Desarrollos Tecnológicos, Observatorio de Yebes (IGN), 19141 Yebes, Guadalajara, Spain 33institutetext: Observatorio Astronómico Nacional (OAN, IGN), Madrid, Spain
Discovery of five cyano derivatives of propene with the QUIJOTE1 line survey ††thanks: Based on observations carried out with the Yebes 40m telescope (projects 19A003, 20A014, 20D023, and 21A011). The 40m radiotelescope at Yebes Observatory is operated by the Spanish Geographic Institute (IGN, Ministerio de Transportes, Movilidad y Agenda Urbana).
We report the discovery of five cyano derivatives of propene towards TMC-1 with the QUIJOTE1 line survey: and -crotononitrile (-CH3CHCHCN, -CH3CHCHCN), methacrylonitrile (CH2C(CH3)CN), and and -allyl cyanide (-CH2CHCH2CN and -CH2CHCH2CN). The observed transitions allowed us to derive a common rotational temperature of 71 K for all them. The derived column densities are N(-CH3CHCHCN)=(50.5)1010 cm-2, N(-CH3CHCHCN)=(1.30.2)1011 cm-2, N(CH2C(CH3)CN)=(1.00.1)1011 cm-2, N(-CH2CHCH2CN)=(8.00.8)1010 cm-2, and N(-CH2CHCH2CN)=(7.00.7)1010 cm-2, respectively. The abundance of cyano-propene relative to that of propene is thus 10-2, which is considerably lower than those of other cyano derivatives of abundant hydrocarbons. Upper limits are obtained for two ethynyl derivatives of propene ( and -CH3CHCHCCH).
Key Words.:
molecular data – line: identification – ISM: molecules – ISM: individual (TMC-1) – astrochemistry1 Introduction
Propene (also called propylene, CH2CHCH3) is the most saturated hydrocarbon ever detected in space through radio astronomical techniques. In spite of its weak dipole moment, several doublets of its and species were observed by Marcelino et al. (2007) towards TMC-1 with the IRAM 30m radio telescope. They derived, surprisingly, a very large column density, 41013 cm-2. The molecule has also been detected towards four other cold dense clouds, Lupus-1 A, L1495B, L1521F, and Serpens South (Agúndez et al. 2015), with column densities similar to those of TMC-1 within a factor of two. More recently, this species has also been detected towards the hot corino IRAS 16293-2422B (Manigand et al. 2021).
Since its discovery, the chemical paths leading to the formation of propene have been subject to debate. Marcelino et al. (2007) proposed that the formation of propene could occur through reactions of radiative associations between hydrocarbon cations and H2. However, laboratory experiments and detailed calculations by Lin et al. (2013) have shown that these reactions are not efficient at the low temperatures of 10 K prevailing in TMC-1. A recent analysis of the gas-phase reactions producing propene has been provided by Hickson et al. (2016) who conclude that it cannot be synthesized in the gas phase and suggest that it is formed by hydrogenation of C3 on the surface of dust grains followed by non-thermal desorption processes. In the hot corino IRAS 16293-2422B, models including hydrogenation and radical-radical additions on grain surfaces seem to explain the observed abundance of propene and other species (Manigand et al. 2021). However, the kinetic temperature of the dust and gas in this source is much higher than in TMC-1.
The QUIJOTE111Q-band Ultrasensitive Inspection Journey to the Obscure TMC-1 Environment line survey of TMC-1 (Cernicharo et al. 2021a) performed with the Yebes 40m radio telescope has permitted 29 new molecular species to be detected in the last months, among them are cyclic hydrocarbons such as indene, benzyne, and cyclopentadiene (see, e.g. Cernicharo et al. 2021a, b, c, d and references therein). Propargyl, CH2CCH, has been found to be one of the most abundant hydrocarbon radicals in this source (Agúndez et al. 2021, 2022a). Other hydrocarbons such as CH2CCHCCH and CH2CHCCH have been found to have large abundances as well (Cernicharo et al. 2021b, d). The discovery of this variety of hydrocarbons, with different degrees of saturation and sizes, strongly suggests that large and complex hydrocarbons such as polycyclic aromatic hydrocarbons are formed through a bottom-up mechanism involving small hydrocarbons as intermediate species. We still lack a correct picture of the complex hydrocarbon chemistry at work in cold dark clouds. Discovering new hydrocarbons and their CN and CCH derivatives could help to elucidate the origin of these species, either gas-phase, grain-surface, or both.
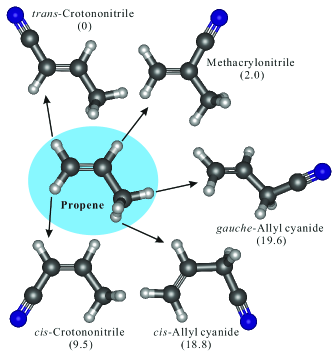
In this Letter, we report the discovery of five cyano derivatives of propene (CH2CHCH3). Their structures are shown in Fig. 1. The detected species are and -crotononitrile (-CH3CHCHCN, -CH3CHCHCN), methacrylonitrile (CH2C(CH3)CN), and and -allyl cyanide (-CH2CHCH2CN, -CH2CHCH2CN).
2 Observations
New receivers, built within the Nanocosmos project222https://nanocosmos.iff.csic.es/, and installed at the Yebes 40m radiotelescope, were used for the observations of TMC-1 ( and ). A detailed description of the system is given by Tercero et al. (2021). Details of the QUIJOTE line survey are provided by Cernicharo et al. (2021a). The observations were carried out during different observing runs between November 2019 and January 2022. The receiver consists of two cold high electron mobility transistor amplifiers covering the 31.0-50.4 GHz band with horizontal and vertical polarizations. Receiver temperatures in the runs achieved during 2020 vary from 22 K at 32 GHz to 42 K at 50 GHz. Some power adaptation in the down-conversion chains have reduced the receiver temperatures during 2021 to 16 K at 32 GHz and 25 K at 50 GHz. The backends are GHz fast Fourier transform spectrometers with a spectral resolution of 38.15 kHz, providing the whole coverage of the Q-band in both polarizations.
The data presented here correspond to observations carried out in the period 2019-2021 and correspond to 427 hours of observing time on the source, of which 254 and 173 hours were acquired with a frequency switching throw of 10 MHz and 8 MHz, respectively. The intensity scale used in this work, the antenna temperature (), was calibrated using two absorbers at different temperatures and the atmospheric transmission model (ATM; Cernicharo 1985; Pardo et al. 2001). The antenna temperature has an estimated uncertainty of 10 % and can be converted to main beam brightness temperature, , by dividing by /. For the Yebes 40m telescope, = 0.738 [((GHz)/72.2)2] and = 0.97 (Tercero et al. 2021). All data were analysed using the GILDAS package333http://www.iram.fr/IRAMFR/GILDAS.
3 Results
QUIJOTE has now reached a level of sensitivity (0.15-0.4 mK across the Q-band) that permits new isotopologues and CN and CCH derivatives of species with abundances 10-9 to be detected. Although it has not reached the confusion limit yet, special care has to be taken when assigning lines to a given molecule as blending with other features often occurs. Consequently, spectral line assignment has to be performed with special attention. Line identification in this work was done using the catalogues MADEX (Cernicharo 2012), CDMS (Müller et al. 2005), and JPL (Pickett et al. 1998). By May 2022, the MADEX code contained 6434 spectral entries corresponding to the ground and vibrationally excited states, together with the corresponding isotopologues, of 1734 molecules. Once the assignment of all known molecules and their isotopologues is done, then QUIJOTE permits one to search for new molecular species for which laboratory spectroscopy is available. Last but not least, QUIJOTE also allows one to perform rotational spectroscopy in space of new species for which no previous rotational spectroscopic laboratory information was available such as HC5NH+ (Marcelino et al. 2020), HC3O+(Cernicharo et al. 2020a), HC3S+ (Cernicharo et al. 2021e), CH3CO+ (Cernicharo et al. 2021f), HCCS+ (Cabezas et al. 2022a), C5H+ (Cernicharo et al. 2022), HC7NH+ (Cabezas et al. 2022b), and HCCNCH+ (Agúndez et al. 2022b).
3.1 Energetics of the cyano derivatives of propene
All the molecular species studied in this work belong to the C4H5N family. Up to 16 isomers have been calculated within an energy window of 190 kJ mol-1, where pyrrole, stabilized by aromaticity, is unambiguously the most stable species (Lattelais et al. 2010). According to Lattelais et al. (2010), the second most stable species is crotononitrile lying at 33 kJ mol-1 above pyrrole. Since Lattelais et al. (2010) did not distinguish between - and - crotononitrile, we ran our own energy calculations using the Møller-Plesset post-Hartree-Fock method (Møller & Plesset 1934)(MP2) (Møller & Plesset 1934) and the Pople basis set 6-311++G(d,p) (Frisch et al. 1984). Our results are similar to those found by Lattelais et al. (2010) with pyrrole being the most stable one and -crotononitrile lying at 44 kJ mol-1. The relative energies for the other five species are shown in Fig. 1. It must be noted that there exists another conformer for the ally cyanide isomer, named -allyl cyanide, which is about 9 kJ mol-1 less stable than the one. However, it has not been included in this work since no experimental data are available for it, contrary to the five species shown in Fig. 1 for which several laboratory investigations have been performed (see below). Moreover, taking the weakness expected for its lines into account, a search for it within the forest of U-lines of QUIJOTE is hopeless at this level of sensitivity. Rotational constants for the five cyano derivatives studied in this work (shown in Fig. 1) were derived from a fit to the available laboratory spectroscopy and have been implemented in MADEX (Cernicharo 2012) to predict the frequencies of their rotational transitions and to compute their synthetic spectra.
3.2 Detection of and -crotononitrile (/-CH3CHCHCN)
Rotational spectra up to 371.1 GHz have been investigated for -crotononitrile and -crotononitrile by Lesarri et al. (1995). Their dipole moments have been measured by Beaudet (1963) and Suzuki & Kozima (1970), respectively. For -crotononitrile, internal rotation splittings were observed, but not for -crotononitrile (Lesarri et al. 1995). The analysis of the hyperfine structure due to the 14N nuclear quadrupole has been done for -crotononitrile and -crotononitrile by Lesarri et al. (1995), and very recently by McCarthy et al. (2020).
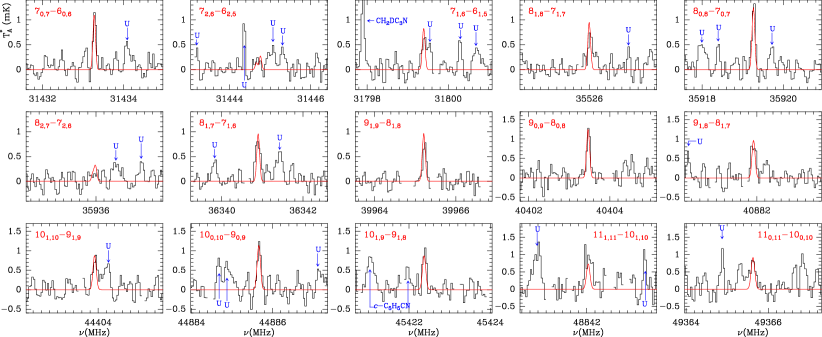
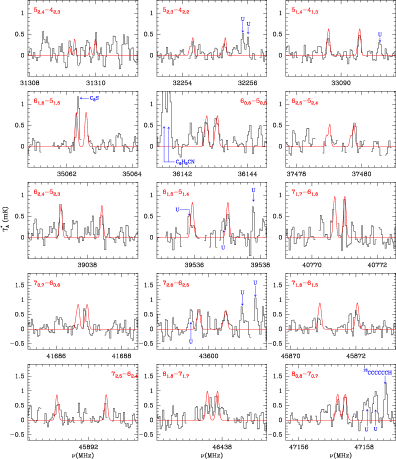
We started the search for both isomers of crotononitrile by adopting a rotational temperature of 10 K and a column density of 1011 cm-2. All lines of the and isomers with have been searched for. Lines with 3 are predicted to be extremely weak for the adopted rotational temperature. As a result of the inspection of the QUIJOTE data, all =0,1 lines of the isomer have been detected with no missing lines (=4.39 D, Beaudet 1963). The lines are shown in Fig. 2 and the line parameters are given in Table 2. Two lines with =2 are also presented to show the low intensity level expected for them ( and ). In order to derive a column density and a rotational temperature for this isomer, we have assumed a source of uniform brightness with a diameter of 80′′ (Fossé et al. 2001) and used a line model fitting method (see, e.g. Cernicharo et al. 2021e). All models have been performed taking the hyperfine structure of the observed transitions into account. Although mostly unresolved, some line broadening could be produced in the lines of all isomers. The derived rotational temperature is 71 K and the column density of -crotononitrile is (5.00.5)1010 cm-2. Adopting a column density for molecular hydrogen of 1022 cm-2 (Cernicharo & Guélin 1987), the abundance of -crotononitrile is (5.00.5)10-12. The detection of the -isomer is reported in Appendix 4. For this isomer, we derived a rotational temperature of 71 K, identical to that of the isomer, and a column density of (1.30.2)1011, that is to say 2-3 times more abundant than -crotononitrile.
3.3 Detection of methacrylonitrile (CH2C(CH3)CN)
The rotational spectrum of methacrylonitrile has been investigated up to 200 GHz by López et al. (1990). This species shows small internal rotation splittings due to the methyl top. The dipole moments of this species have been derived by Stark-effect measurements (López et al. 1990). The analysis of the hyperfine structure due to the nuclear quadrupole coupling interactions of the 14N nucleus has been done by Lesarri et al. (1995). All =0,1 lines have been detected as shown in Fig. 3. The line parameters are provided in Table 5. A couple of transitions with =2 are also detected. The derived rotational temperature is similar to that of crotononitrile, 71 K, and the column density (total + ) is (1.00.1)1011 cm-2. The abundance relative to H2 is (1.00.1)10-11.
3.4 Detection of - and -allyl cyanide (/-CH2CHCH2CN)
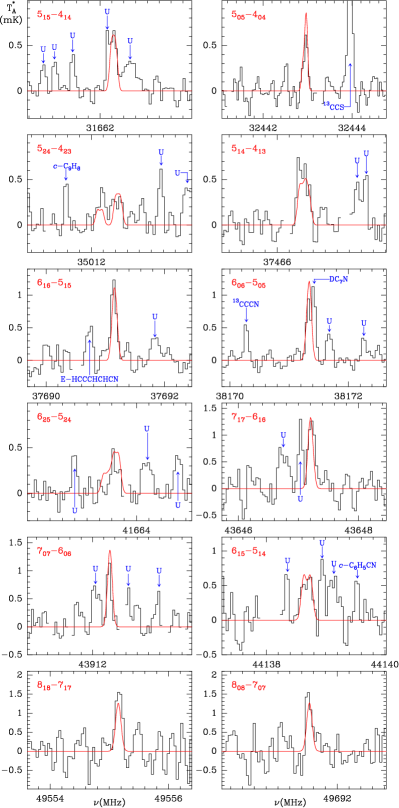
The rotational spectra of the and conformers of allyl cyanide have been measured up to 250 GHz by Demaison et al. (1991) and the dipole moments have been determined by Sastry et al. (1968). The analysis of the hyperfine structure due to the nuclear quadrupole coupling interactions of the 14N nucleus has been done by McCarthy et al. (2020). For the conformer, all =0,1 lines are detected in the frequency coverage of the QUIJOTE line survey. The lines are shown in Fig. 4 and the line parameters are given in Table 6. Similar to the case of the other isomers, the lines with =2,3 are weak and below the sensitivity of the survey. The best rotational temperature is also 71 K and the column density is (8.00.8)1010 cm-2.
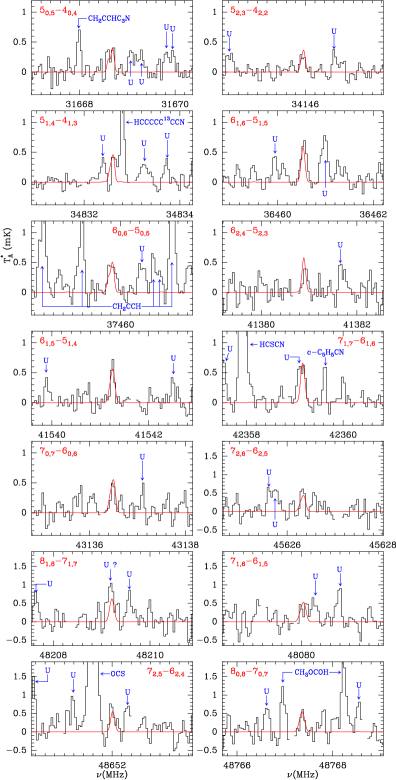
The lines of -allyl cyanide (-CH2CHCH2CN) are shown in Fig. 6 and the line parameters are given in Table 7. All =0,1 lines are detected, together with two =2 transitions. The best rotational temperature is also 71 K and the column density is N(-CH2CHCH2CN)=(7.00.7)1010 cm-2, that is to say nearly identical to that of the conformer.
4 Discussion
The five isomers of cyano-propene detected in this work show very similar abundances, despite the large energy differences between them. This is a further example that the chemical composition of cold dark clouds is driven by chemical kinetics so that thermodynamic considerations such as the minimum energy principle (Lattelais et al. 2010) are not relevant.
The formation of the five cyano derivatives of propene is likely related to propene, the formation of which is not yet well understood. Soon after the discovery of propene in TMC-1 by Marcelino et al. (2007), Herbst et al. (2010) proposed a formation mechanism based on two successive radiative associations of the propargyl ion (CH2CCH+) with H2, resulting in the ion C3H, the dissociative recombination of which would yield propene. This mechanism was indeed found to produce propene with abundances in excess of that observed in TMC-1 (e.g. Agúndez & Wakelam 2013). However, further experiments and calculations have shown that the proposed radiative associations involving H2 have activation barriers and thus cannot be efficient at the low temperatures of TMC-1 (Lin et al. 2013). Alternative mechanisms involving dust grains have been proposed for the formation of propene in cold dark clouds (Rawlings et al. 2013; Hickson et al. 2016; Abplanalp et al. 2018). That is, currently, there is no gas-phase mechanism able to explain the formation of propene in dark clouds.
Regardless of pathway to propene in cold dark clouds, the large abundance in which it is present makes it feasible to form C2H and CN derivatives since it has been found for other hydrocarbons such as C2H4 (Cernicharo et al. 2021d), CH3CCH and CH2CCH2 (Marcelino et al. 2021; Cernicharo et al. 2021b), -C3H2 (Cernicharo et al. 2021c), benzene (McGuire et al. 2018), and cyclopentadiene (Cernicharo et al. 2021h). In this line, the most obvious route to the cyano-propene isomers detected in TMC-1 is the reaction between CN and propene. This reaction has been measured to be rapid at temperatures as low as 23 K (Morales et al. 2010) and the mechanism and products have been investigated by means of crossed beam experiments and theoretical calculations (Gu et al. 2008; Huang et al. 2009). We can consider the following reaction channels
| (1a) | ||||
| (1b) | ||||
| (1c) | ||||
| (1d) | ||||
where channels (1a), (1b), and (1c) produce crotononitrile, methacrylonitrile, and allyl cyanide, respectively, that is to say the three isomers of cyano-propene with the CN substituted at the three different carbon positions of propene (see Fig. 1). Huang et al. (2009) found that formation of vinyl cyanide (channel 1d) dominates, with a branching ratio in the range 70-86 % at zero collision energy. Given that vinyl cyanide has been detected in TMC-1 with a column density of 6.51012 cm-2 (Cernicharo et al. 2021d), which is well above those derived here for the different cyano-propene isomers, this reaction could indeed produce CH2CHCN as a major product in cold dark clouds. In regards to the three isomers of cyano-propene, Huang et al. (2009) found that crotononitrile and allyl cyanide are formed with similar yields while methacrylonitrile is not formed. On the other hand, our observations indicate that the three isomers are present with similar abundances in TMC-1. The study of Huang et al. (2009) and our observations agree in that crotononitrile and allyl cyanide are formed with comparable abundances, but they disagree regarding methacrylonitrile. It would be surprising if this isomer is formed by a reaction different to that forming the other cyano-propene isomers, which makes revisiting the product distribution of reaction (1) worth it.
We included reaction (1) with a rate coefficient of 3.7 10-10 (as measured at 23 K; Morales et al. 2010) and a branching ratio of 20 % for the formation of cyano-propene (as predicted by Huang et al. 2009) in a gas-phase chemical model similar to those presented in previous works (e.g. Agúndez et al. 2021), and assumed that cyano-propene is mostly destroyed through reactions with C+, HCO+, H, H+, and He+. We found that the calculated abundance of cyano-propene is around 1 % of that or propene, which is in agreement with observations and supports reaction (1) as the main route to cyano-propene in TMC-1.
We searched for the two ethynyl derivatives of propene for which laboratory data are available from McCarthy et al. (2020), - and -3-penten-1-yne (CH3CHCHCCH). The reaction of propene and CCH has been studied down to 79 K and has been found to be rapid (Bouwman et al. 2012). However, the main product of the reaction is vinyl acetylene with a yield of only 15% for the isomers of C5H6. Moreover, the main isomer of C5H6 produced in the reaction is 4-penten-1-yne, with a 3-penten-1-yne yield 2 times lower. Only 3 upper limits of 51011 cm-2 and of 91011 cm-2 have been obtained for the and isomers of 3-penten-1-yne, respectively.
5 Conclusions
We have reported the detection of five isomers of cyano-propene with very similar abundances towards the cold dark cloud TMC-1. The comparison of observations and models suggests that these cyano derivatives are produced in the gas-phase by the reaction of cyanide with propene. Only upper limits are obtained for the two isomers of the ethynyl derivatives of propene, - and -CH3CHCHCCH.
Acknowledgements.
We thank ERC for funding through grant ERC-2013-Syg-610256-NANOCOSMOS. We also thank Ministerio de Ciencia e Innovación of Spain (MICIU) for funding support through projects PID2019-106110GB-I00, PID2019-107115GB-C21 / AEI / 10.13039/501100011033, and PID2019-106235GB-I00.References
- Abplanalp et al. (2018) Abplanalp, M. J., Góbi, S., & Kaiser, R. I. 2018, PCCP, 21, 5378
- Agúndez & Wakelam (2013) Agúndez, M. & Wakelam, V. 2013, Chem. Rev., 113, 8710
- Agúndez et al. (2015) Agúndez, M., Cernicharo, J., Guélin, M. 2015, A&A, 577, L5
- Agúndez et al. (2021) Agúndez, M., Cabezas, C., Tercero, B., et al. 2021, A&A, 647, L10
- Agúndez et al. (2022a) Agúndez, M., Marcelino, N., Cabezas, C. et al. 2022a, A&A, 657, A96
- Agúndez et al. (2022b) Agúndez, M., Cabezas, C., Marcelino, N. et al. 2022b, A&A, 659, L9
- Beaudet (1963) Beaudet, R. A., 1964, J. Chem. Phys., 38, 2548
- Bouwman et al. (2012) Bouwman, J., Goulay, F., Leone, S.R. & Wilson, K.R. 2012, J. Phys. Chem. A, 116, 3907
- Cabezas et al. (2021) Cabezas, C., Agúndez, M., Marcelino, N. et al. 2021, A&A, 654, L9
- Cabezas et al. (2022a) Cabezas, C., Agúndez, M., Marcelino, N., et al. 2022a, A&A, 657, L4
- Cabezas et al. (2022b) Cabezas, C., Agúndez, M., Marcelino, N., et al. 2022b, A&A, 659, L8
- Cernicharo (1985) Cernicharo, J. 1985, Internal IRAM report (Granada: IRAM)
- Cernicharo & Guélin (1987) Cernicharo, J. & Guélin, M. 1987, A&A, 176, 299
- Cernicharo (2012) Cernicharo, J., 2012, in ECLA 2011: Proc. of the European Conference on Laboratory Astrophysics, EAS Publications Series, 2012, Ed.: C. Stehl, C. Joblin, & L. d’Hendecourt (Cambridge: Cambridge Univ. Press), 251; https://nanocosmos.iff.csic.es/?pageid=1619
- Cernicharo et al. (2020a) Cernicharo, J., Marcelino, N, Agúndez, M., et al. 2020a, A&A, 642, L17
- Cernicharo et al. (2021a) Cernicharo, J., Agúndez, M., Kaiser, R., et al. 2021a, A&A, 652, L9
- Cernicharo et al. (2021b) Cernicharo, J., Cabezas, C., Agúndez, M., et al. 2021b, A&A, 647, L3
- Cernicharo et al. (2021c) Cernicharo, J., Agúndez, M., Cabezas, C., et al. 2021c, A&A, 649, L15
- Cernicharo et al. (2021d) Cernicharo, J., Agúndez, M., Cabezas, C., et al. 2021d, A&A, 647, L2
- Cernicharo et al. (2021e) Cernicharo, J., Cabezas, C., Endo, Y., et al. 2021e, A&A, 646, L3
- Cernicharo et al. (2021f) Cernicharo, J., Cabezas, C., Bailleux, S., et al. 2021f, A&A, 646, L7
- Cernicharo et al. (2021g) Cernicharo, J., Cabezas, C., Aúndez, M. et al. 2021g, A&A, 648, L3
- Cernicharo et al. (2021h) Cernicharo, J., Agúndez, M., Kaiser, R. I., et al. 2021h, A&A, 655, L1
- Cernicharo et al. (2022) Cernicharo, J., Agúndez, M., Cabezas, C. et al. 2022, A&A, 657, L16
- Demaison et al. (1991) Demaison, J., Burie, J., Boucher, D., & Wlodarczak, G., 1991, J. Mol. Spectrosc., 146, 455
- Fossé et al. (2001) Fossé, D., Cernicharo, J., Gerin, M., Cox, P. 2001, ApJ, 552, 168
- Frisch et al. (1984) Frisch, M. J, Pople J. A. & Binkley, J. S., 1984, J. Chem. Phys., 80, 3265
- Frisch et al. (2016) Frisch, M. J., Trucks, G. W., Schlegel, H. B., et al. 2016, Gaussian 16, revision A.03
- Gu et al. (2008) Gu, X.B., Zhang, F.T. & Kaiser, R.I. 2008, J. Phys. Chem. A, 112, 9607
- Hartwig & Dreizler (1996) Hartwig, H., & Dreizler, H. 1996, Z. Naturforsch., 51a, 923
- Herbst et al. (2010) Herbst, E., Roueff, E., & Talbi, D. 2010, Mol. Phys., 108, 2171
- Hickson et al. (2016) Hickson, K.M., Wakelam, V. & Loisson J.-C. 2016, Molecular Astrophysics, 3, 1
- Huang et al. (2009) Huang, C.H., Kaiser, R.I. & Chang, H.H. 2009, J. Phys. Chem. A, 113, 12675
- Lattelais et al. (2010) Lattelais, M., Ellinger, Y., Matrane, A., & Guillemin, J.-C., 2010, Phys. Chem. Chem. Phys., 12, 4165
- Lesarri et al. (1995) Lesarri, A. G., Cosléou, J., Li, X., et al. 1995, J. Mol. Spectrosc., 172, 520
- Lin et al. (2013) Lin, Z, Talbi, D., Roueff, E. et al. 2013, ApJ, 765, 80
- López et al. (1990) López, J. C., Demaison, J., Gómez, A., et al., 1990, J. Mol. Spectrosc., 141, 317
- Manigand et al. (2021) Manigand, S., Coutens, A., Loisson, J.-C. et al. 2021, A&A, 645, A53
- Marcelino et al. (2007) Marcelino, N., Cernicharo, J., Agúndez, M. et al. 2007, ApJ, 665, L127
- Marcelino et al. (2020) Marcelino, N., Agúndez, M., Tercero, B. et al. 2020, A&A, 643, L6
- Marcelino et al. (2021) Marcelino, N., Tercero, B., Agúndez, M., & Cernicharo, J. 2021, A&A, 646, L9
- McCarthy et al. (2020) McCarthy, M.C., & Lee, K.L.K., Carroll, P.B., et al. 2020, J. Phys. Chem. A, 124, 5170
- McGuire et al. (2018) McGuire, B. A., Burkhardt, A. M., Kalenskii, S., et al. 2018, Science, 359, 202
- Møller & Plesset (1934) Møller, C., & Plesset, M. S., 1934, Phys. Rev. 46, 618
- Morales et al. (2010) Morales, S. B., Le Picard, S., Canosa, A., & Sims, I. R. 2010, Faraday Discuss., 147, 155
- Müller et al. (2005) Müller, H.S.P., Schlöder, F., Stutzki, J., Winnewisser, G. 2005, J. Mol. Struct., 742, 215
- Pardo et al. (2001) Pardo, J. R., Cernicharo, J., Serabyn, E. 2001, IEEE Trans. Antennas and Propagation, 49, 12
- Pickett (1991) Pickett, H. M. 1991, J. Mol. Spectrosc., 148, 371
- Pickett et al. (1998) Pickett, H.M., Poynter, R. L., Cohen, E. A., et al. 1998, J. Quant. Spectrosc. Radiat. Transfer, 60, 883
- Rawlings et al. (2013) Rawlings, J. M. C., Williams, D. A., Viti, S., & Cecchi-Pestellini, C. 2013, MNRAS, 436, L59
- Tercero et al. (2021) Tercero, F., López-Pérez, J. A., Gallego, et al. 2021, A&A, 645, A37
- Sastry et al. (1968) Sastry, K. V. L. N., Rao, V. M., & Dass, S. C. Can. J. Phys., 46, 959
- Suzuki & Kozima (1970) Suzuki, M., & Kozima, K., 1970, J. Mol. Spectrosc., 33, 407
Appendix A Line parameters
Line parameters for the different molecules studied in this work were obtained by fitting a Gaussian line profile to the observed data. A window of 15 km s-1 around the vLSR of the source (5.83 km s-1) has been considered for each transition.
A.1 -crotononitrile
The line identification for -crotononitrile was done using the frequency predictions based on the laboratory measurements reported by Lesarri et al. (1995). In that work, the authors measured a total of 75 -type rotational transitions with =78 and =19 in the 4-420 GHz frequency range. The spectroscopic constants derived by Lesarri et al. (1995) from the analysis of these data are shown in Table 1. We used these molecular constants to predict the rotational transitions of -crotononitrile in the Q-band. We observed a total of 15 transitions in the 31.0-50.4 TMC-1 survey. We detected all transitions =7 through = 11 with =0,1, and marginally two lines with =2 (, and ). The derived line parameters are given in Table 2. The lines are shown in Fig. 2. None of the lines detected in our survey were observed in the laboratory by Lesarri et al. (1995), so we included the astronomical and laboratory frequencies in a combined analysis using the programme SPFIT (Pickett 1991). The derived spectroscopic constants, shown in Table 1, are very similar to those reported by Lesarri et al. (1995), with the exception of the parameter , which was not determined in the laboratory work.
| Constant | Laba+TMC-1 | Laba |
|---|---|---|
| 38053.422(36)b | 38053.406(43) | |
| 2297.07475(42) | 2297.06890(72) | |
| 2195.19007(40) | 2195.18358(60) | |
| 0.286585(143)10-3 | 0.283422(46)10-3 | |
| -0.0173276(35) | -0.0173321(34) | |
| 0.0297147(196)10-3 | 0.029727(31)10-3 | |
| -1.140(57)10-3 | -1.124(64)10-3 | |
| 0.2913(139)10-9 | - | |
| -0.039316(217)10-6 | -0.039665(194)10-6 | |
| 1.8560(101)10-6 | 1.8400(101)10-6 | |
| c | 41.8 | 46.0 |
| Nd | 90 | 75 |
| Transitiona | Tdv c | vd | T | N | |
|---|---|---|---|---|---|
| (MHz) | (mK km s-1) | (km s-1) | (mK) | ||
| 31433.2900.010 | 1.020.10 | 0.820.08 | 1.170.13 | ||
| 31444.6760.030 | 0.440.13 | 1.560.40 | 0.260.12 | A | |
| 31799.4110.020 | 0.970.20 | 1.430.33 | 0.650.14 | B | |
| 35526.0240.010 | 0.740.13 | 0.900.19 | 0.770.13 | ||
| 35919.2710.010 | 1.190.10 | 0.800.08 | 1.400.13 | ||
| 35935.9690.000 | 0.42 | C | |||
| 36340.8850.010 | 1.010.07 | 1.140.31 | 0.830.11 | ||
| 39965.2350.010 | 0.620.08 | 0.730.12 | 0.800.12 | ||
| 40403.4790.010 | 1.010.13 | 0.720.10 | 1.320.17 | ||
| 40881.9920.010 | 0.990.12 | 1.050.13 | 0.880.16 | ||
| 44403.9340.010 | 0.890.18 | 1.060.26 | 0.790.20 | ||
| 44885.6700.010 | 0.890.13 | 0.690.11 | 1.220.21 | ||
| 45422.3850.010 | 0.820.10 | 0.680.09 | 1.130.18 | ||
| 48842.0740.020 | 1.160.26 | 1.160.30 | 0.940.26 | B | |
| 49365.6220.020 | 0.430.14 | 0.420.18 | 0.970.29 |
$a$$a$footnotetext: Quantum numbers are .
$b$$b$footnotetext: Observed frequencies adopting a vLSR of 5.83 km s-1 for TMC-1.
$c$$c$footnotetext: Integrated line intensity in mK km s-1.
$d$$d$footnotetext: Linewidth at half intensity derived by fitting a Gaussian line profile to the observed transitions (in km s-1).
$A$$A$footnotetext: Marginally detected.
$B$$B$footnotetext: Partially blended with another feature.
$C$$C$footnotetext: 3 upper limit. Frequency corresponds to the predicted one.
A.2 -crotononitrile
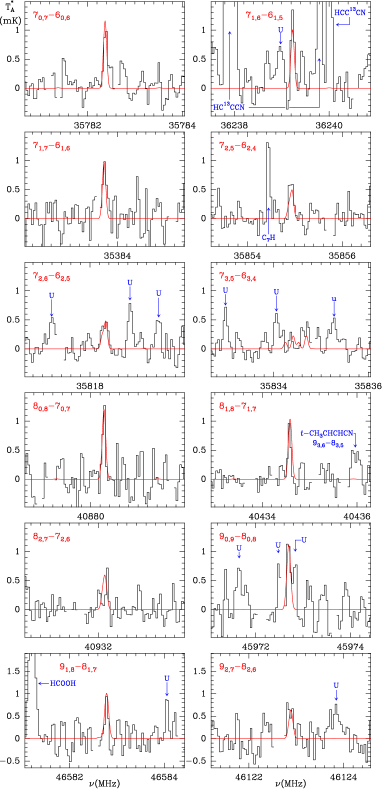
Laboratory measurements of the rotational spectrum of -crotononitrile are reported by Lesarri et al. (1995). In this work the rotational transitions of -crotononitrile are observed as doublets ( and ) due to methyl top internal rotation. The dipole moment of the molecule, 3.74 D (Beaudet 1963), is slightly smaller than that of the isomer. Lesarri et al. (1995) reported the experimental molecular constants of the state, obtained in a single state fit, but they did not perform a fit for the state. As a result of which, only the observed frequency transitions were reported. In this situation, the frequency predictions for -crotononitrile in the Q-band are not very accurate. Hence, we first carried out a double state ( and ) fit using the frequencies reported by Lesarri et al. (1995). We predicted the rotational spectra for and in the Q-band frequency range and we were able to observe a total of 22 lines that were included in the spectral analysis together with those measured by Lesarri et al. (1995). The derived line parameters are given in Table 4 and the lines are shown in Fig. 5. In this manner, our set of data contains 182 rotational transitions and the results of the fit done with the XIAM programme (Hartwig & Dreizler 1996) are shown in Table 3. The molecular constants are very similar to those reported by Lesarri et al. (1995), even the geometrical parameters are also in agreement in both fits.
Contrarily to the isomer, some of the expected strong lines of the form are missing. Although in some cases this non-detection can be attributed to the presence of negative features produced in the folding of the frequency switching data, there is a case for which an additional explanation is needed. It corresponds to the component of the transition predicted at 35062.5860.003 MHz. The frequency switching data with a throw of 8 MHz produce an exact coincidence with one of the hyperfine components of the transition at 35054.54 MHz of H2C4N, a radical recently detected with QUIJOTE (Cabezas et al. 2021). For the data with a frequency switching throw of 10 MHz, there is a U feature at 35072.559 MHz, that is, exactly at 10 MHz from the frequency of the line of -crotononitrile. Hence, both sets of data produce a negative feature at the frequency of the line, which explains the lack of observed emission. Furthermore, the component of this transition of -crotononitrile is partially blended with the =19-18 transition of C5S for which an intensity of 1 mK has been previously reported towards TMC-1 (Cernicharo et al. 2021g). Hence, we consider that there are enough individual lines for a definitive detection of the isomer with the present data. A fit to the data of Fig. 5 provides Trot=81 K and N(-CH3CHCHCN)=(1.50.2)1011 cm-2, corresponding to an abundance of (1.50.2)10-11.
| Constant | Merged Fita | Labb |
|---|---|---|
| 11854.3814(55)c | 11854.4494(100) | |
| 3524.63261(92) | 3524.6977(145) | |
| 2759.72005(96) | 2759.74293(73) | |
| 2.72760(43)10-3 | 2.73153(84)10-3 | |
| -18.2134(61)10-3 | -18.2106(53)10-3 | |
| 65.737(40)10-3 | 65.801(59)10-3 | |
| 0.87233(25)10-3 | 0.87471(54)10-3 | |
| 5.222(16)10-3 | 5.2526(167)10-3 | |
| 0.0051790(74)10-6 | 0.005204(93)10-6 | |
| -0.201(23)10-6 | -0.232(20)10-6 | |
| 0.0022233(62)10-6 | 0.002287(82)10-6 | |
| d | 1373(17) | 1387.2(7) |
| (a,)e | 103.61(25) | 102.751 |
| αf | 3.141(82) | 3.106 |
| g | 0.02745(54) | 0.02655 |
| h | 2.2541(93) | 2.2213 |
| i | 24.6 | 34j/51k |
| Nl | 182 | 111j/144k |
| Transitiona | Tdv c | vd | T | N | |
|---|---|---|---|---|---|
| (MHz) | (mK km s-1) | (km s-1) | (mK) | ||
| 31309.2830.032 | ¡0.33 | A | |||
| 31309.9390.002 | ¡0.33 | A | |||
| 32254.3420.015 | 0.210.06 | 0.670.18 | 0.360.10 | ||
| 32255.2940.015 | 0.280.07 | 0.840.22 | 0.320.10 | ||
| 33089.6080.010 | 0.380.08 | 0.870.10 | 0.420.l0 | ||
| 33090.5740.010 | 0.410.08 | 0.750.19 | 0.510.l0 | ||
| 35062.3100.047 | B | ||||
| 35062.5860.003 | C | ||||
| 36142.7410.010 | 0.580.08 | 0.870.13 | 0.620.10 | ||
| 36143.0510.010 | 0.900.10 | 1.290.16 | 0.660.10 | ||
| 37478.9910.011 | D | ||||
| 37479.7850.010 | 0.470.10 | 0.710.15 | 0.620.12 | ||
| 39037.1700.010 | 0.410.07 | 0.680.13 | 0.560.10 | ||
| 39038.4540.010 | 0.510.08 | 0.900.18 | 0.530.10 | ||
| 39535.9730.010 | 0.290.12 | 0.920.20 | 0.290.14 | ||
| 39537.0170.010 | 0.380.09 | 0.590.16 | 0.600.14 | ||
| 40770.6590.020 | 0.300.10 | 0.420.20 | 0.470.14 | ||
| 40770.9940.010 | 0.400.09 | 0.530.12 | 0.780.14 | ||
| 41686.6720.020 | 0.270.06 | 0.480.12 | 0.530.11 | ||
| 41686.8990.015 | 0.670.10 | 0.960.13 | 0.660.11 | ||
| 43599.7000.010 | 0.580.12 | 0.730.18 | 0.750.24 | ||
| 43600.5260.010 | 0.660.15 | 1.180.29 | 0.520.24 | ||
| 45870.8730.015 | 0.320.08 | 0.530.14 | 0.570.14 | ||
| 45872.0080.015 | 0.460.08 | 0.650.12 | 0.670.14 | ||
| 45891.0800.020 | 0.610.14 | 0.380.17 | 0.570.19 | ||
| 45892.5110.050 | 0.260.09 | 0.360.17 | 0.630.19 | E | |
| 46437.6470.020 | 0.400.10 | 0.480.13 | 0.780.19 | ||
| 46437.8190.020 | 0.540.14 | 0.590.12 | 0.870.19 | ||
| 47157.1960.015 | 0.540.10 | 0.800.16 | 0.640.16 | ||
| 47157.4160.015 | 0.510.09 | 0.550.10 | 0.910.16 |
$a$$a$footnotetext: Quantum numbers are .
$b$$b$footnotetext: Observed frequencies adopting a vLSR of 5.83 km s-1 for TMC-1.
$c$$c$footnotetext: Integrated line intensity in mK km s-1.
$d$$d$footnotetext: Linewidth at half intensity derived by fitting a Gaussian line profile to the observed transitions (in km s-1).
$A$$A$footnotetext: 3 upper limit. Frequency corresponds to the predicted one.
$B$$B$footnotetext: Heavily blended with the =19-18 transition of C5S.
$C$$C$footnotetext: In both set of data (8 and 10 MHz frequency switching throw), the line is blended with other features (see text).
$D$$D$footnotetext: Affected by a negative feature in the folding of the frequency switching data. Frequency corresponds to the predicted one. $e$$e$footnotetext: Affected by a negative feature in the folding of the frequency switching data. Line parameters are very uncertain.
A.3 Methacrylonitrile, CH2C(CH3)CN
The rotational spectrum of methacrylonitrile has been investigated in the laboratory by López et al. (1990) and the analysis of the hyperfine structure due to the quadrupole of the 14N nucleus has been done by Lesarri et al. (1995). Hence the frequency predictions for the and states including the nuclear quadrupole hyperfine structure have been done using those experimental data. Since the methyl internal rotation splittings are not large for methacrylonitrile, the data reported by López et al. (1990) provide accurate predictions in the Q-band, as can be seen in Fig. 3. The line parameters are provided in Table 5.
| Transitiona | Tdv c | vd | T | N | |
|---|---|---|---|---|---|
| (MHz) | (mK km s-1) | (km s-1) | (mK) | ||
| 51,5-41,4 | 31662.2320.015 | 0.780.21 | 1.11 0.36 | 0.660.07 | A |
| 50,5-40,4 | 32442.9600.010 | 0.660.10 | 1.07 0.19 | 0.580.11 | |
| 52,4-42,3 E | 35012.3740.020 | 0.360.11 | 1.14 0.45 | 0.300.08 | |
| 52,4-42,3 A | 35012.4790.020 | 0.250.10 | 0.69 0.28 | 0.340.08 | |
| 51,4-41,3 E | 37466.3590.010 | 0.510.13 | 0.63 0.16 | 0.770.11 | B |
| 51,4-41,3 A | 37466.4610.010 | 0.470.14 | 0.66 0.21 | 0.670.11 | B |
| 61,6-51,5 | 37691.1390.010 | 1.140.14 | 0.88 0.14 | 1.220.14 | |
| 60,6-50,5 | 38171.3290.010 | 0.730.10 | 0.72 0.12 | 0.950.09 | C |
| 62,5-52,4 E | 41663.6090.030 | 0.160.07 | 0.35 0.16 | 0.450.09 | B |
| 62,5-52,4 A | 41663.6890.030 | 0.240.10 | 0.86 0.29 | 0.260.09 | B |
| 71,7-61,6 | 43647.2180.010 | 1.260.22 | 0.90 0.19 | 1.320.17 | |
| 70,7-60,6 | 43912.2940.010 | 0.740.07 | 0.57 0.07 | 1.210.15 | D |
| 61,5-51,4 E | 44138.6070.010 | 0.420.05 | 0.79 0.09 | 0.500.16 | B |
| 61,5-51,4 A | 44138.7340.010 | 0.490.06 | 0.75 0.08 | 0.620.22 | B |
| 81,8-71,7 | 49555.1610.010 | 1.360.23 | 0.74 0.13 | 1.730.23 | |
| 80,8-70,7 | 49691.5190.010 | 1.100.20 | 0.62 0.13 | 1.660.20 |
$a$$a$footnotetext: Quantum numbers are .
$b$$b$footnotetext: Observed frequencies adopting a vLSR of 5.83 km s-1 for TMC-1.
$c$$c$footnotetext: Integrated line intensity in mK km s-1.
$d$$d$footnotetext: Linewidth at half intensity derived by fitting a Gaussian line profile to the observed transitions (in km s-1).
$A$$A$footnotetext: Line slightly blended with an unidentified line. Fit still possible and reliable.
$B$$B$footnotetext: and components are marginally resolved. Fit uncertain.
$C$$C$footnotetext: Line slightly blended with the =35-34 line of DC7N. Fit still possible and reliable.
$D$$D$footnotetext: Data set corresponds to frequency switching with a throw of 8 MHz alone.
A.4 -allyl cyanide, g-CH2CHCH2CN
The derived line parameters for -allyl cyanide (-CH2CHCH2CN) are given in Table 6. The lines are shown in Fig. 4.
| Transitiona | Tdv c | vd | T | N | |
|---|---|---|---|---|---|
| (MHz) | (mK km s-1) | (km s-1) | (mK) | ||
| 71,7-61,6 | 35383.7280.008 | 0.680.14 | 0.72 0.17 | 0.890.15 | A |
| 70,7-60,6 | 35782.3870.009 | 0.880.17 | 0.88 0.25 | 0.940.12 | |
| 72,6-62,5 | 35818.3450.014 | 0.380.11 | 0.78 0.26 | 0.450.12 | B |
| 72,5-62,4 | 35854.9370.010 | 0.500.13 | 0.71 0.22 | 0.660.14 | |
| 73,5-63,4 | 35834.3630.008 | 0.45 | C | ||
| 73,4-63,3 | 35834.6400.008 | 0.45 | C | ||
| 71,6-61,5 | 36239.2320.008 | 0.920.19 | 0.64 0.13 | 1.340.16 | |
| 81,8-71,7 | 40434.5700.007 | 0.510.10 | 0.51 0.10 | 0.950.13 | |
| 80,8-70,7 | 40880.2820.007 | 0.660.15 | 0.46 0.14 | 1.340.20 | A |
| 82,7-72,6 | 40932.1870.009 | 0.330.09 | 0.41 0.11 | 0.750.12 | |
| 90,9-80,8 | 45972.6960.008 | 0.830.13 | 0.66 0.13 | 1.190.15 | B |
| 92,7-82,6 | 46122.8810.023 | 0.560.19 | 0.85 0.31 | 0.620.19 | |
| 91,8-81,7 | 46582.7820.009 | 0.440.11 | 0.42 0.11 | 0.990.18 |
$a$$a$footnotetext: Quantum numbers are .
$b$$b$footnotetext: Observed frequencies adopting a vLSR of 5.83 km s-1 for TMC-1.
$c$$c$footnotetext: Integrated line intensity in mK km s-1.
$d$$d$footnotetext: Linewidth at half intensity derived by fitting a Gaussian line profile to the observed transitions (in km s-1).
$A$$A$footnotetext: Frequency switching data with a throw of 10 MHz only.
$B$$B$footnotetext: Frequency switching data with a throw of 8 MHz only.
$C$$C$footnotetext: 3 upper limit. Frequency corresponds to the predicted one.
A.5 -allyl cyanide, c-CH2CHCH2CN
The derived line parameters for -allyl cyanide (-CH2CHCH2CN) are given in Table 7. The lines are shown in Fig. 6.
| Transitiona | Tdv c | vd | T | N | |
|---|---|---|---|---|---|
| (MHz) | (mK km s-1) | (km s-1) | (mK) | ||
| 50,5-40,4 | 31668.6510.030 | 0.560.10 | 1.430.23 | 0.370.10 | A |
| 52,4-42,3 | 32828.0220.005 | 0.30 | B | ||
| 52,3-42,2 | 34415.9380.020 | 0.340.08 | 1.110.28 | 0.280.09 | |
| 51,4-41,3 | 34832.5250.030 | 0.490.07 | 0.960.14 | 0.480.09 | C |
| 61,5-51,5 | 36460.5510.010 | 0.820.11 | 1.110.18 | 0.690.10 | |
| 60,6-50,5 | 37459.8200.030 | 0.780.10 | 1.490.19 | 0.490.13 | A,D |
| 62,4-52,3 | 41380.9290.030 | 0.340.10 | 0.730.25 | 0.430.15 | |
| 61,5-51,4 | 41541.2550.010 | 0.480.08 | 0.600.11 | 0.750.13 | |
| 71,7-61,6 | 42359.1960.020 | 0.320.07 | 0.520.18 | 0.570.11 | E |
| 70,7-60,6 | 43136.4880.020 | 0.360.09 | 0.660.21 | 0.510.13 | |
| 72,6-62,5 | 45626.3210.020 | 0.430.09 | 0.570.12 | 0.710.16 | |
| 73,4-63,3 | 47016.7130.006 | 0.54 | B | ||
| 71,6-61,5 | 48080.0660.030 | 0.540.24 | 1.300.60 | 0.390.20 | F |
| 81,8-71,7 | 48209.2320.030 | 0.660.15 | 0.730.15 | 0.980.21 | G |
| 72,5-62,4 | 48651.9880.020 | 0.520.13 | 0.620.18 | 0.790.22 | |
| 80,8-70,7 | 48767.3690.020 | 0.610.11 | 0.490.18 | 0.630.22 |
$a$$a$footnotetext: Quantum numbers are .
$b$$b$footnotetext: Observed frequencies adopting a vLSR of 5.83 km s-1 for TMC-1.
$c$$c$footnotetext: Integrated line intensity in mK km s-1.
$d$$d$footnotetext: Linewidth at half intensity derived by fitting a Gaussian line profile to the observed transitions (in km s-1).
$A$$A$footnotetext: Line too broad. Hyperfine structure marginally resolved. A single line has been fitted.
$B$$B$footnotetext: 3 upper limit. Frequency corresponds to the predicted one.
$C$$C$footnotetext: The line is possibly affected by a weak negative feature. Fit still possible, but the frequency and intensity are uncertain (see Fig.6).
$D$$D$footnotetext: Frequency switching data with a throw of 8 MHz only.
$E$$E$footnotetext: Blended with an unknown feature. Fit still possible.
$F$$F$footnotetext: Marginal detection.
$G$$G$footnotetext: Line too strong, probably blended with a U line. Fit uncertain.