email: kalinova@mpifr.de 22institutetext: Instituto de Astronomía,Universidad Nacional Autonóma de México, A.P. 70-264, 04510, México, D.F. 33institutetext: Department of Physics 4-181 CCIS, University of Alberta, Edmonton AB T6G 2E1, Canada 44institutetext: National Astronomical Observatory of Japan; Osawa2-21-1, Mitaka-shi, Tokyo, Japan PC 181-8588 55institutetext: SOKENDAI, International Village, Hayama-machi, Miura-gun, Kanagawa-ken, Japan, PC 240-0193 66institutetext: Instituto de Astrofísica de Andalucía, CSIC, Apartado de correos 3004, 18080 Granada, Spain 77institutetext: Sterrenkundig Observatorium, Universiteit Gent, Krijgslaan 281 S9, B-9000 Gent, Belgium 88institutetext: School of Physics and Astronomy, Cardiff University, Queens Buildings, The Parade, Cardiff CF24 3AA, UK 99institutetext: Department of Space, Earth and Environment, Chalmers University of Technology, SE-41296 Gothenburg, Sweden
Investigating the link between inner gravitational potential and star-formation quenching in CALIFA galaxies
It has been suggested that the gravitational potential can have a significant role in suppressing the star formation in the nearby galaxies. To establish observational constrains on this scenario, we investigate the connection between the dynamics, through the circular velocity curves (CVCs) as a proxy of the inner gravitational potential, and star formation quenching in 215 non-active galaxies across Hubble sequence from the Calar Alto Legacy Integral Field Area (CALIFA) survey. Our results show that galaxies with similar CVCs tend to have a certain star-formation quenching pattern. To explore these findings in more details, we construct kpc-resolved relations of the equivalent width of the H () versus the amplitude () and shape () of the circular velocity at given radius. We find that the is a declining relationship, where the retired regions of the galaxies (the ones with values below 3 Å) tend to have higher . Differently, is a bi-modal relationship, characterised by two peaks: concentration of the star forming regions at a positive (rising CVC) and another one of the retired regions with a negative (declining CVC). Our results show that both the amplitude of the CVC, driven by the mass of the galaxies, and the shape of the CVC, reflecting the internal structure of the galaxies, play an important role in galaxy’s quenching history.
Key Words.:
galaxies: evolution – galaxies: structure – galaxies: star formation – galaxies: fundamental parameters1 Introduction
The transition of the galaxies from blue and young to red and retired systems is referred to the process ”star-formation quenching” (e.g. Strateva et al. 2001; Faber et al. 2007), which is characterised by a fast decline in the star formation rate (SFR; e.g. Corcho-Caballero et al. 2021).
Several quenching mechanisms have been proposed to explain the diversity of galaxies we observe today and they can be grouped to external (outside of the galaxy) and internal (within the galaxy).
Environmental quenching (Peng et al. 2010,Gunn & Gott 1972; Abadi et al. 1999) is an external process. This includes ram-pressure stripping of the galaxies interstellar medium, strangulation (removal of the outer gaseous envelope of the galaxy falling into galaxy cluster, which will cease the star formation of the galaxy as the only available gas is hot and it cannot replenish its cold gas reservoir (Larson et al. 1980; Balogh et al. 2000) and galaxy harassment (quenching due to interactions with other members of the galaxy cluster, leading to dynamical heating Farouki & Shapiro 1981; Moore et al. 1996; Bluck et al. 2020a, b). Low-mass galaxies, in particular, can have their gas removed by tidal stripping during travel towards the centre of a galaxy cluster (e.g. Abadi et al., 1999).
In addition, a large range of internal processes are also thought to be able to quench star formation. Dark matter (DM) halo quenching is considered an internal process, related to the most extended component of the galaxies. In systems with critical DM halo mass of 1012 M⊙, the accreated gas is shocked and heated to the virial temperature of the halo, preventing star formation (Birnboim & Dekel 2003). The correlation of the stellar component with the quenching of the massive galaxies is known as mass quenching (Peng et al. 2010). Active galactic nuclei (AGN) feedback quenching is able to suppresses star formation in the galaxies (Husemann & Harrison 2018). AGN feedback can transfer radiation to the surrounding gas and suppress gas accretion (Di Matteo et al., 2005) or kinetic energy and momentum can cause expulsion of gas (Croton et al., 2006). The ejective galactic winds from supernovae or HII regions constitute another quenching feedback mechanism (stellar feedback quenching) that acts mostly in low-mass and late-type galaxies (e.g. Colling et al. 2018). Internal dynamics contributes to the quenching of the galaxies too. Secular evolution processes can form a bar structure that generates radial inflow towards the centre of the galaxies, increasing the random motion of the gas and the disc heating that stabilises the inner gaseous disc (Romeo & Fathi, 2015, 2016; Khoperskov et al., 2018). Additionally bars drive gas flow toward galactic centre to trigger a central star-burst, which in turn can consume almost all the gas causing a quenched centre. This action leads to a periodically episodes of quenching and star formation at the centre of bars (Krumholz & Kruijssen, 2015). The growth of the central spheroid (bulge) seems to play an important role in ceasing the star formation in the galaxies via stabilisation of the disk against gravitational instability, known as ”morphological quenching” (Martig et al. 2009), gravitational quenching (Genzel et al. 2014) or dynamical suppression (e.g. Davis et al. 2014; Gensior et al. 2020; Gensior & Kruijssen 2021).
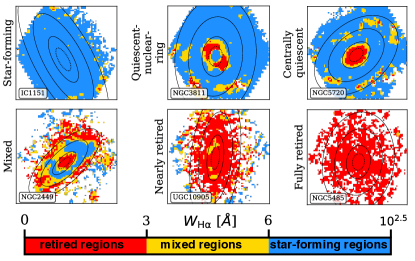
Overall, the causes of star-formation quenching in galaxies are highly complex and still debated. It is not clear whether there is one dominant mechanism or a mixture of several processes that are responsible for the variety of galaxy morphologies seen today. Recent resolved studies have tried to disentangle these effects by classifying the galaxies based on their star formation activity (or its absence; Singh et al. 2013; Belfiore et al. 2016; Lacerda et al. 2018). In particular, Kalinova et al. (2021) (hereafter K21) distinguish various quenching patterns (called ”quenching stages”; Fig. 1) in the spatially resolved ionised gas distribution of the galaxies, where the ratio star-forming versus quenching regions of the galaxies increases from late-type to early-type galaxy morphologies (e.g. Lacerda et al. 2018, K21). Based on H-equivalent-width () thresholds (e.g., Sánchez et al. 2014, Lacerda et al. 2020), K21 distinguished star-forming ( 6 Å), mixed (3 6 Å) and retired ( 3 Å) regions within the field of view of the galaxies. They proposed six quenching stages of the systems (see Fig. 1): star-forming (fully dominated by recent star-formation), quiescent-nuclear-ring (presence of a quiescent-ring structure in the central regions, but still dominated by star formation in the outskirts), centrally quiescent (quiescent inner region within of the galaxy, where is the effective radius of the galaxy), mixed (no clear patterns in the ionised gas distributions), nearly retired (quiescent galaxies with little star-formation regions) and fully retired (completely quiescent objects up to ).
In this study, we explore the connection between the dynamics and star-formation quenching stage of the galaxies, shedding light on the role of the dynamical suppression mechanism for their formation. To achieve this goal, we compare the circular velocities of the galaxies (tracing the total gravitational potential of the systems; Kalinova et al. 2017, hereafter K17) and the values of the WHα (K21), serving as a star-formation/quenching marker across Hubble sequence.
figurec
2 Sample and Data
Our sample is derived from the 238 CALIFA (Calar Alto Legacy Integral Field Area; Sánchez et al. 2012) survey galaxies, extensively analysed in K17 and K21. It is a representative population of the CALIFA mother sample (see Fig. 1 in K17), and therefore of the nearby Universe galaxies (Walcher et al. 2014). In our analysis, we only discard few targets - the active galaxies members (15 strong AGN and 8 weak AGN galaxies) from the original sample of K17 and K21 to avoid any possible biases due to the presence of nuclear activity in the galaxies. The final sample consists of 215 non-active galaxies, spanning over six different quenching stages as defined in K21 (see Fig. 1 of K21 and Fig. 1 of this study), various morphologies (from elliptical to late-type spiral galaxies), stellar masses (from 6 to 5 ) and redshifts (). Further details about the survey and data reduction can be found in Sánchez et al. (2012), Husemann et al. (2013), García-Benito et al. (2015) and Sánchez et al. (2016a).
To perform this study, we use the publicly available circular velocity curve (CVC) catalogue of K17. CVC is defined as , where is the gravitational potential and is the galactocentric radius, respectively. Further, the CVC is calculated through the solutions of the axisymmetric Jeans equations by applying the Jeans Axisymmetric Modelling (JAM) code of Cappellari (2008)111http://purl.org/cappellari/software. First, K17 derive the surface brightness (SB) of the galaxies using the r-band images from Sloan Digital Sky Survey (SDSS)222https://www.sdss.org/ catalogue of Data Release 12 (DR12; Alam et al. 2015) through the multi-Gaussian expansion method (MGE; Monnet et al. 1992; Emsellem et al. 1994). Given the defined SB of the galaxies, the second velocity moment of the galaxies () of the stellar kinematics (based on the high-resolution “V1200” dataset; Falcón-Barroso et al. 2017) is fitted, assuming constant dynamical mass-to-light ratio () and constant velocity anisotropy () in the galactic meridional plane. In the end, the CVCs were inferred from the de-projected SB of the galaxies, scaling by the best fit value of (see eq. 3 in K17).
The emission-line analysis for deriving the maps of the equivalent width of H line () was based on the Pipe3D pipeline (Sánchez et al. 2016c, b) calculations, assuming a Salpeter (Salpeter 1955) initial mass function (IMF). Further details about the adopted data and analysis are provided in K17 and K21.
3 Results
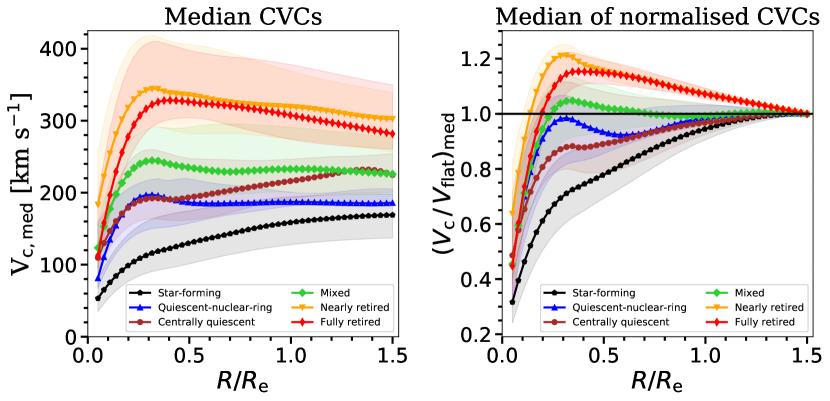
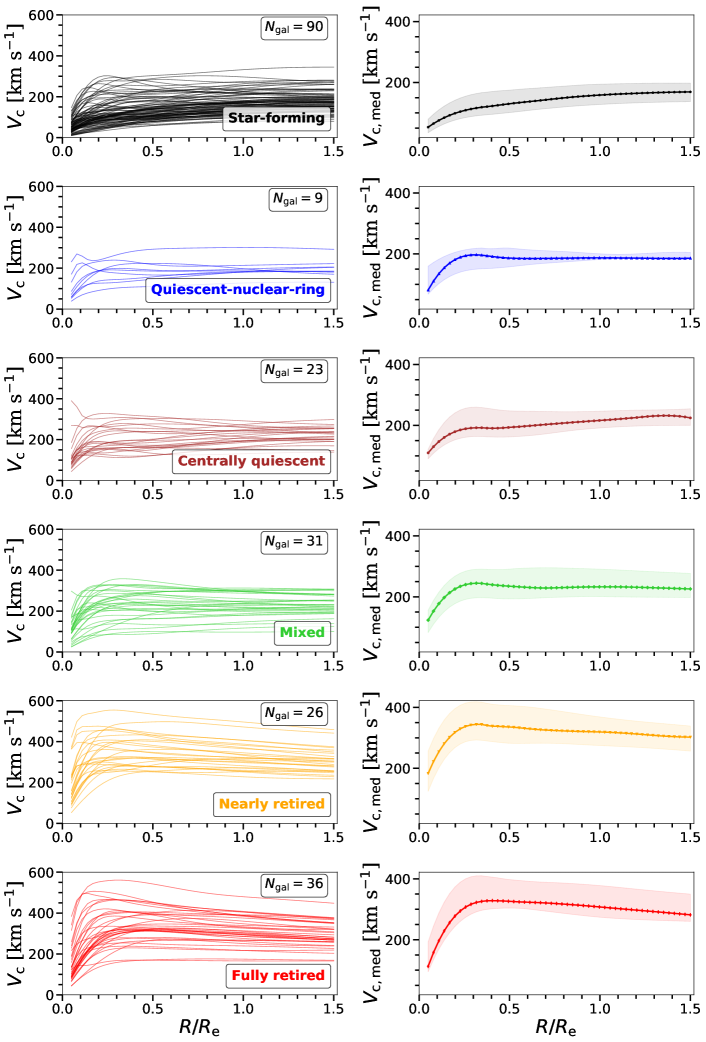
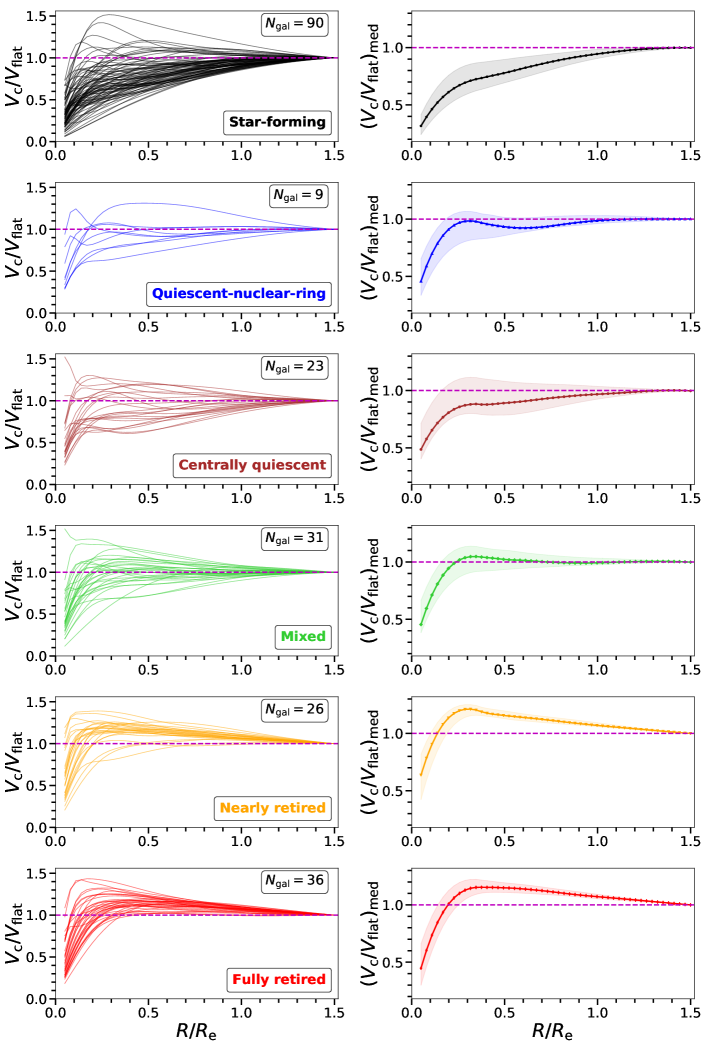
Our first test towards understanding the link between the inner gravitational potential of the galaxies and their quenching stage is performed in Fig. 2. We group the CVCs of the galaxies by their quenching stage using the CALIFA CVCs catalogue of K17. The amplitude and the slope of the central regions ( 0.1–0.4 ) of the median profiles (left panel) increase as the galaxies become progressively more quenched, e.g., increasing in the sequence star-forming to quiescent-nuclear-ring/centrally quiescent to mixed to fully retired to nearly retired. We notice that in the central region (up to 0.4 ), centrally quiescent systems have similar median velocity as the quiescent-nuclear-ring galaxies, but larger velocity in the outer parts (above 0.4 ). This indicates that the disc of the centrally quiescent galaxies is more massive than the one of the quiescent-nuclear-ring systems. Contrary, in the outer regions (above 0.40.5 ), the nearly retired galaxies have similar disc median velocity as the fully retired systems, but larger bulge median velocity in the central parts (below 0.40.5 ). Among all quenching-stage groups, the nearly retired galaxies have the largest central mass concentration (the highest peak). This might suggest that the fully retired systems (or even the rest of the quenching stage galaxies) are progenitors of the nearly retired galaxies (via re-ignition of star-formation and mass build-up by merger events), or the nearly retired class has followed a different evolutionary path from the rest of the classes. Furthermore, in the right panel of Fig. 2, the median of the CVC profiles, normalised with respect to the asymptotic velocity, show more distinguishable order: star-forming to centrally quiescent to quiescent-nuclear-ring to mixed to fully retired to nearly retired. Nevertheless, individually, the curves in a given quenching stage show a large variety. In particular, several star-forming galaxies are characterised by declining profiles, while some retired objects have rising profiles (see also the individual CVCs in each quenching-stage group in Figs. 7 and 8).
Figure 2 suggests that on average, there is a correlation between the CVC shape/amplitude and the quenching stage. To have a more detailed quantification of these correlations, we construct two resolved relationships using the available information from the maps and CVCs.
3.1 Resolved quenching relations
The first relation, quenching-velocity (), compares the value and the amplitude of the circular velocity () at a given position in the field of view of the galaxy (i.e. spaxel-by-spaxel). We calculate the circular velocity, , value at each radius of the de-projected radial map of the galaxies using the MGE_VCIRC procedure included in the JAM package of Cappellari (2008). The inclination and the MGE models of the galaxies were adopted from K17. Assuming that the galaxies are axisymmetric, we derive “maps” with constant values of at a given galactocentric radius. Once we obtain the map, we are able to construct the second relationship, quenchingCVC shape (), where is the derivative of with respect to the radius, . If the rising part of the CVC is close to a solid body rotation, then , giving , while if the part of the curve is flat gives constant, and therefore . If the logarithmic derivative of the CVC is negative (¡0) then the CVC is declining (e.g. Sect. 4.2.4 of Leroy et al. 2008). The statistical robustness of both resolved relationships is demonstrated in Appendix C.
Additionally, we use the Pearson’s correlation coefficient333https://docs.scipy.org/doc/scipy/reference/generated/scipy.stats.pearsonr.html (; e.g. Kowalski 1972) to test the strength of the monotonically linear relation. The coefficient can vary between +1 and -1 for linear correlation and linear anti-correlation, respectively (where 0 refers to no correlation between the two studied data sets). The Spearman’s rank correlation coefficient444https://docs.scipy.org/doc/scipy/reference/generated/scipy.stats.spearmanr.html (; e.g. Zwillinger & Kokoska 1999) tells us whether the tested relationship is monotonically increasing (), monotonically decreasing () or there is non-monotonic relationship (), independently from its linearity.
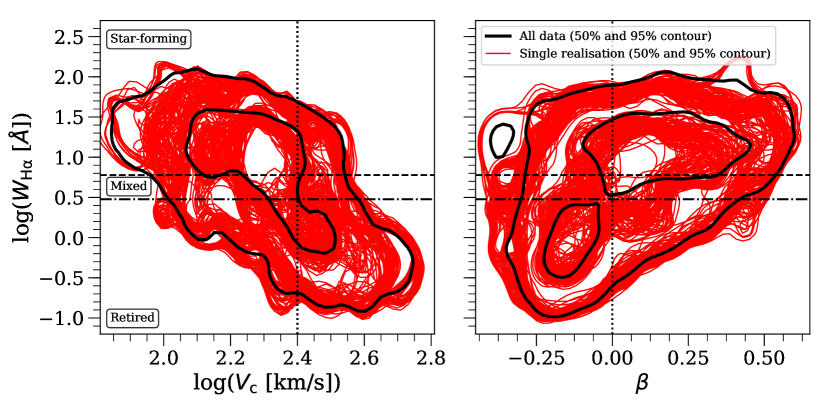
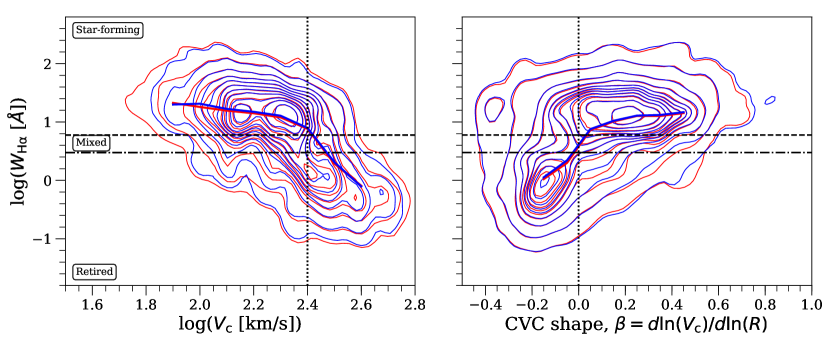
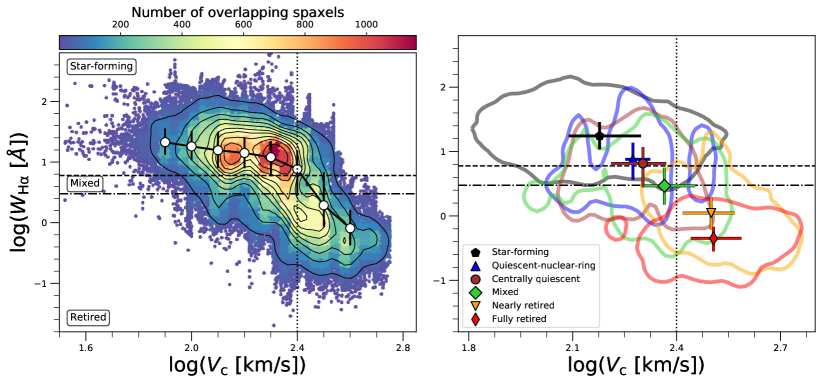
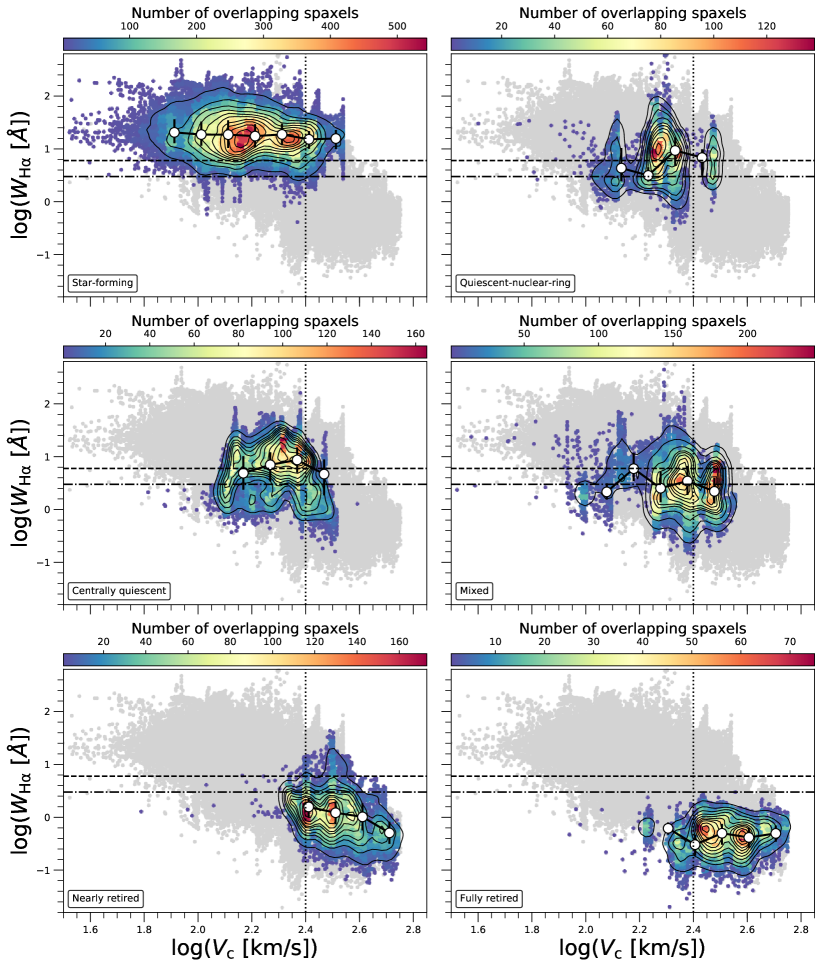
The resolved quenching-velocity relation, , which includes all values of the spaxels in each galaxy of our sample is displayed in Fig. 3 (left panel). Generally, the two quantities are moderately correlated (=0.62 and =0.60 ) with high significance (for both coefficients, we obtained p-value indicating that the moderate correlation between the two quantities is not due to chance). The relation presents two slopes, as it flattens in low velocities and steepens in the high-velocities above the critical value ()2.4 km s-1 ( 250 km s-1). Overall, the retired spaxels (i.e. those with 3 Å) tend to be characterised by higher circular velocities. Furthermore, if we segregate the quenching-velocity relation into the six quenching stages (right panel of Fig. 3; see also Fig. 9), we observe a smooth transition from star-forming to fully retired galaxies from the top-left (high and low ) to the bottom-right (low and high ) side of the relation. The central regions of the relation ( 1 Å and 2.3 km s-1) are occupied by the mixed group of galaxies, which are actually green valley galaxies on the way to be fully quenched (see Fig. 11 of K21).
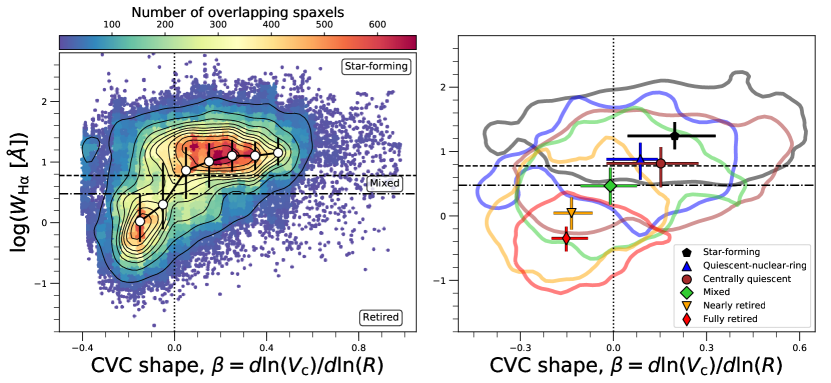
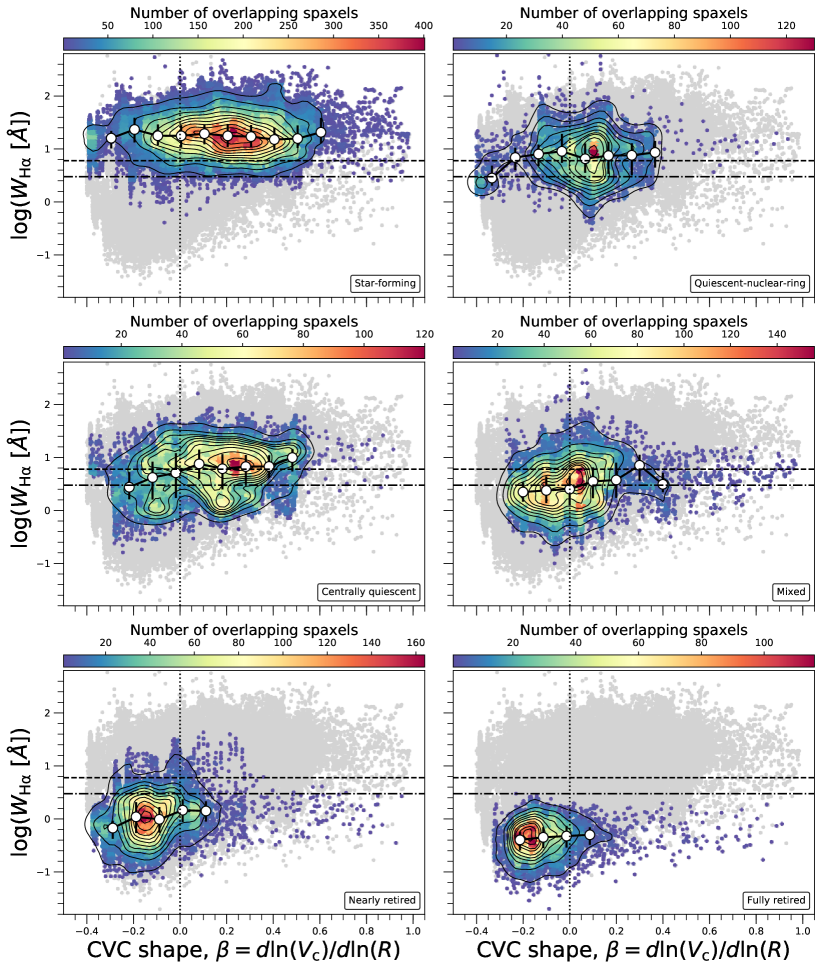
In Fig. 4, the and values moderately correlate (=0.49 and =0.48), as for the previous relation, with high significance (p-value for both tests). Contrary to the relation, the relation is bi-modal and characterised by two clear peaks, where one of them is located at and , and the second one is located at and , indicating that generally star forming regions are characterised by rising rotation curves, while retired regions by declining profiles.
We also divide the diagram across the six quenching stages (see right panel of Fig. 4 and Fig. 10). There is a smooth transition from fully retired to star-forming galaxies from the left-bottom (low and negative ) to the right-top side (high and positive ) of the relation. The intermediate quenching stage spaxel distribution of the mixed galaxies is centrally located at the plane due to the large fraction of flat CVCs that these systems possess (see Fig. 2, Fig. 7 and Fig. 7). In particular, the nearly retired and fully retired quenching stage galaxies are almost fully located in the quenched region with declining CVC of the diagram (i.e. ¡ 3 Å and ).
3.2 Nature of the scatter in the quenching relations
In the previous section, the relation depicts a link between quenching and the amplitude of CVCs, showing in particular that a majority of spaxels with high velocity (i.e. 250 km s-1) are quenched (i.e. 3 Å ). The relation, meanwhile, highlights the connection between quenching and the shapes of CVCs and exhibits a clear bi-modality: whereas star forming regions are overall characterised by rising curves, quenched regions are associated with decreasing curves.
Both quenching relations exhibit a large level of scatter, however, in the plane, quenched regions can also arise at low circular velocity and there are a large number of star-forming regions at high velocity. Many outlier spaxels in the relation represent star-forming regions with declining curves, whereas other are quenched regions with rising curves.
In this section we test whether these outliers are related to the global morphologies of the galaxies in our sample. Indeed, morphological features like bulges, bars and spiral arms are important galactic dynamical structures (see Section 4). To this end, we examine how the observed spaxels are distributed with respect to several indicators of galactic structure including Hubble type, presence of bar and bulge nature (e.g. classical or pseudo bulge, Kormendy & Kennicutt 2004; see also Figs. 5 and 6 of this work).
Following, K21 we adopt the Hubble type classifications for the galaxies in our sample from Walcher et al. (2014). As discussed in K21 (see their Fig. 7), late-type spiral galaxies (SbSdm) mostly make up the star-forming class while early-type spirals (SabSbc) predominantly make up the quiescent-nuclear-ring and centrally quiescent galaxies. The mixed quenching stage includes a large variety of morphologies (covering early-type spirals, lenticulars and ellipticals). The nearly and fully retired galaxies consist only of early-type galaxies (both lenticulars and ellipticals).
According to the bar-type statistics of K21, the quiescent-nuclear-ring group contains the largest number of barred galaxies, followed by centrally quiescent, mixed and star-forming quenching stages. The nearly- and fully- retired stages, on the other hand, are mostly constituted by unbarred galaxies (see their Fig.8). It is notable that the quiescent-nuclear-ring, centrally quiescent and mixed quenches stages consist of early-type spiral galaxies (both lenticulars and discy ellipticals). These systems are thus dominated by secular evolution/dynamical features (e.g. spiral arms and bars; K21), and we expect these galaxies to be the largest contributor to the scatter in the two trends revealed in this work.
Additionally, we use the central stellar mass surface density of the galaxies within 1 kpc, . This parameter has been used as a proxy for both the mass and compactness of the central region (bulge/spheroid) of the galaxies, scaled on the same physical size (Cheung et al. 2012; Luo et al. 2020 and references therein).
For each galaxy we define , where M is the stellar mass of the galaxy integrated within the 1 kpc ellipsoid (obtained by de-projecting the radial map on the plane of the galaxy) and R kpc (e.g. Cheung et al. 2012). For each galaxy, the stellar mass in a given spaxel is determined from the stellar mass surface density map (, included in the PIPE3D dataset; Sánchez et al. 2016c, b) multiplied by the area of the spaxel. Using , we adopt the method of Luo et al. (2020) to classify the central stellar concentration of the galaxies as either “classical bulges” (CB) or “pseudo bulges” (PB). (Elliptical galaxies are omitted from the bulge classification analysis and are designated with the label ”E” in the bulge statistics of Figs. 5 and 6.) Following Luo et al. (2020), we use the residual from their measured relation between and global stellar mass (M∗, calculated integrating across the entire stellar mass map; equation 2 of Luo et al. 2020) to classify galaxies as classical bulge hosts (or elliptical galaxies) when () ¿ 0 and as pseudo bulge hosts when () ¡ 0 (see Luo et al. (2020); their Fig. 7).
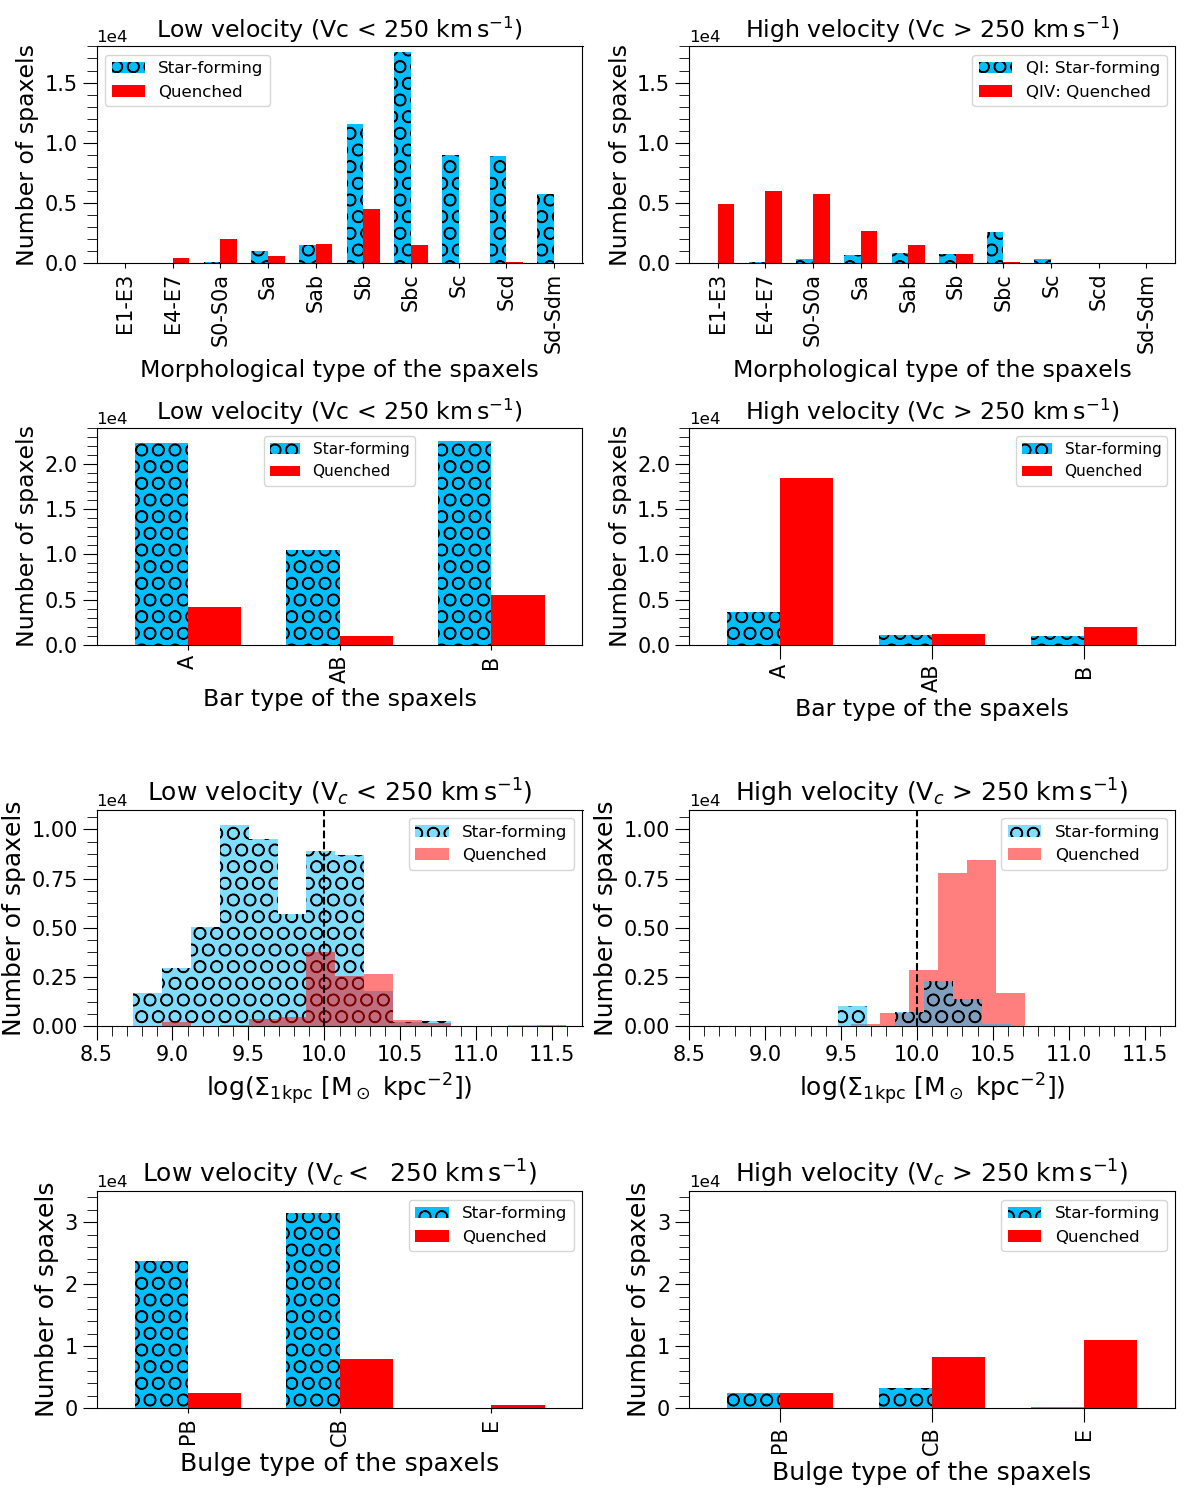
As a basic classification of the outliers around the general trend in vs. (Fig. 5), we define a critical velocity ()2.4 km s-1 ( 250 km s-1) where the trend changes from relatively flat (in the low region) to steep (in the high region). Across this critical value, galaxies also separate broadly into star-forming and quenched groups. Most of the spaxels in low region ( 250 km s-1) belong to disc galaxies (S0Sdm) without a dominant bar type (barred, unbarred or unsure) whereas most of the spaxels in the high ( 250 km s-1) zone, on the other hand, come from early-type and unbarred galaxies (E1Sab).
The critical velocity also tends to mark a separation in the behaviour of . For spaxels in the high region (e.g. mainly above 1010 M⊙ kpc-2), is also high independent of whether the region is star-forming or quenched. This indicates that regions with high amplitudes are also those with high central stellar mass density. In the low- regime (e.g. mainly below 1010 M⊙ kpc-2), in contrast, only quenched regions have high whereas the star-forming spaxels exhibit a broad bi-modal distribution. The broadness of the distribution for this latter subset of galaxies reveals a large variety of central stellar concentrations, and the bi-modality tends to correlate with bulge classification, in the sense that star-forming regions can be arise in galaxies that host both classical bulges (with high ) and pseudo bulges (with low ). Quenched regions are almost exclusively hosts of classical bulges.
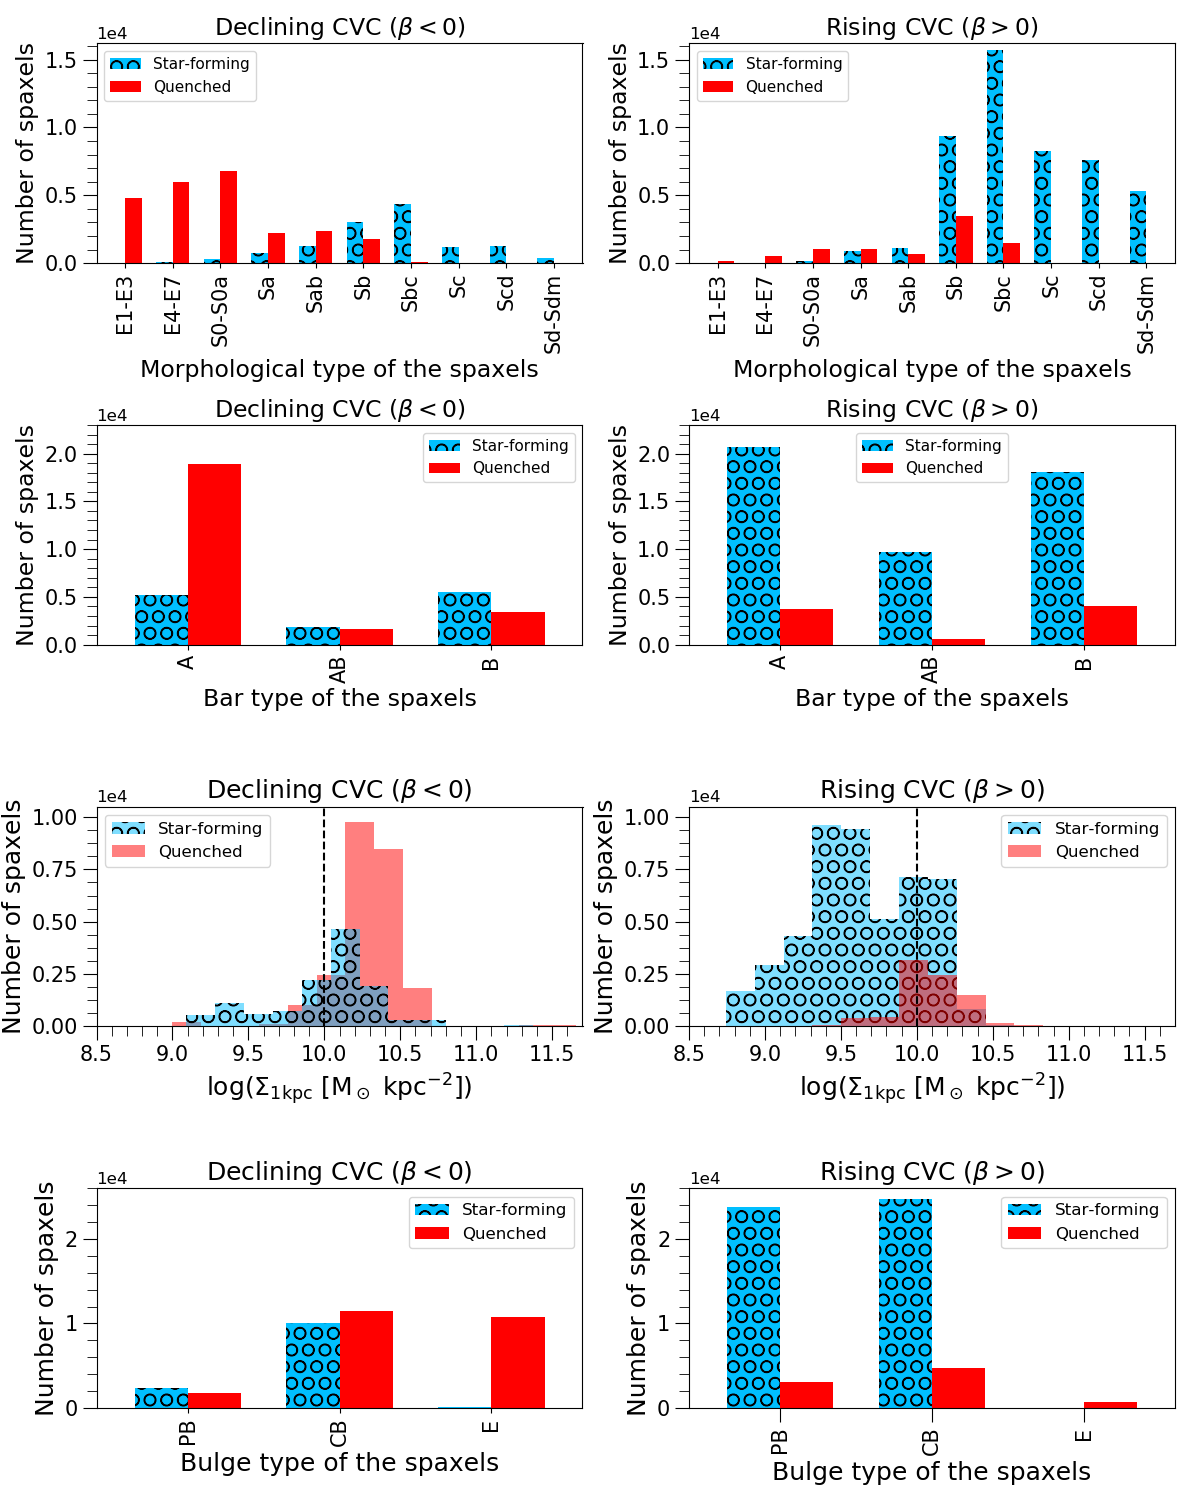
In the diagram, we see that the majority of the spaxels again separate into two main areas: a star-forming rising CVC zone ( ¿ 6 Å and ) and a quencheddeclining CVC region ( ¡ 3 Å and ). In other words, the CVCs of the star-forming galaxies are generally slowly rising (), while the CVCs of the quenched systems have a faster inner rise, followed by either a flattened part or a slowly declining part (with ; outside a central peak caused by a central mass concentration). The star-forming rising CVC zone is largely populated by spaxels of late-type spirals (SbSdm), both barred and unbarred, while the quencheddeclining CVC region is populated by the spaxels of early-type galaxies (E1Sb), mostly without bars. This behavior generally agrees with the idea that galactic regions with high stellar mass concentrations (bulges or spheroids) are quenched (e.g. Martig et al. 2009; Gensior et al. 2020).
There are significant outliers from these general trends, however, with some star-forming galaxies exhibiting declining CVCs ( ¿ 6 Å and ) and some quenched galaxies exhibit rising CVCs ( ¡ 3 Å and ). (We note, though, that these outliers represent only a minority of the sample.) Inspection of the individual CVCs in these cases (and across all quenching stages; see Figs. 7 and 8), indicates that this quenched subset (of nearly and fully retired class galaxies) are lacking peaks in their CVCs while the subset of star-formers have prominent peaks in their CVCs (e.g., prominent bulges). The latter are found to arise predominantly in classical bulge hosts. (In this same zone, quenched regions are also dominated by ellipticals and classical bulges.) Note, though, that for both star-forming and quenched regions, rising CVCs are found in galaxies with both classical and pseudo bulges.
Another characteristic of these two outlier regions is that the median of the spaxel distributions is shifted towards early-type disc galaxies (S0Sbc), both with and without bars (Fig. 6). The spaxel distribution also tends to be tighter compared to the broad distribution characteristic of the star-formingrising CVC zone.
4 Concluding remarks
In this paper, we explore the link between the inner gravitational potential of 215 (ESdm) non-active CALIFA galaxies through their circular velocity curves (CVC) (calculated from stellar dynamics within 1.5 Re), and the star-formation quenching parameter given by the value of the equivalent width of the Hα (). Our main findings can be summarised as follows:
(i) galaxies with certain CVC shape and amplitude tend to be associated with a specific quenching-stage group;
(ii) there is a moderate correlation between the amplitude of the velocity of the spaxels () and their quenching-proxy values (), where the relationship steepens at higher amplitudes above 2.4 km s-1 ( 250 km s-1);
(iii) the relation between the shape of the CVC () and is moderate and bi-modal, showing that the quenching regions of the galaxies (where is below 3 Å) are overall characterised by high and negative (declining CVC),
and the star-forming regions (where is above 6 Å) are overall characterised by low and positive (rising CVC);
(iv) the outlier spaxels of the relation is largely coming from early-type disc galaxies (S0Sbc) and follows the opposite trend of the main spaxel distribution, described above;
(v) the spaxels of the nearly and fully retired class galaxies almost fully occupy the quencheddeclining CVC region of the relation (where ¡ 3 Å and ¡ 0).
These findings indicate an important link of the gravitational potential to the present day star-formation quenching stages of the galaxies. The quenching spaxels lay in regions of the galaxies with a large gravitational potential due to a mass concentration (e.g. bulge/spheroid, bar and rings). Star formation quenching regulated by gravitational potential is generally referred to “dynamical suppression” (or “morphological quenching” Martig et al. 2009; Genzel et al. 2014; Gensior et al. 2020; Gensior & Kruijssen 2021). Our results support such a scenario, as we find that a proxy for quenching (e.g. ) appears correlated with quantities that trace features of the galactic potential, namely circular velocity curve amplitude () and shape ().
A number of other studies have argued that reductions in star formation efficiency (SFE) are responsible for quenching observed in galaxies globally and/or locally (see, e.g. Colombo et al. 2018, 2020; Ellison et al. 2020). In particular, a link between reduced SFE, morphology, increased circular velocity and rotation curve shear (expressed through the Oort’s constant ) has been observed by Colombo et al. (2018) within a sample of galaxies with largely similar molecular gas mass surface densities. That study supports the idea that high shear contributes to the stabilisation of gas discs, preventing the fragmentation in the molecular gas (e.g. Toomre 1964; Romeo & Mogotsi 2017) and reducing the rate of star formation (e.g. Martig et al. 2009; Meidt et al. 2013; Davis et al. 2014; Meidt et al. 2018).
Besides shear due to differential rotation (inferred from the CVCs), other kinds of shear may be present due to local gas flows (e.g. Meidt et al. 2018), associated either with spirals arms (Dobbs & Baba 2014; Meidt et al. 2013) or bars (Athanassoula 1992; Sormani et al. 2015). According to a recent analytical model, local and global (orbital) motions in the galactic potential can lead to a dynamical suppression of star formation on the scales of star-forming giant molecular clouds (Meidt et al. 2018, 2020; Liu et al. 2021). In this ”bottleneck” model, galactic orbital motions compete with gas self-gravity on cloud scales. These motions contribute to the velocity dispersion within clouds, thus increasing their stable mass (see, e.g. Hughes et al. 2013 for an observational example of this effect) and introducing environmental variations in gas dynamical state that can influence its ability to collapse and form stars (Meidt et al. 2013; Leroy et al. 2017).
Whether the reductions in the SFE predicted in some environments by this type of model lead to reductions in the observed rate of star formation depends on the amount of fuel available for star formation. Based on the results of this work, the galaxies most likely to show signs of dynamical suppression are the nearly and fully retired class galaxies in our sample, where the spheroidal component is prominent (e.g. quenched-declining CVC area of the relation, Figs. 4 and 6) and gas fractions are low (see also Martig et al. 2013; Gensior & Kruijssen 2021). For other systems, dynamical suppression may be less efficient due to the amount and organization of the gas reservoir. This could explain why several of the galaxies in our sample with peaks in their CVCs (indicating a large central mass concentration or bulge) are fully star-forming and why some of the galaxies that are quenched (or are approaching quenching) possess rising curves in our sample. In the first case (i.e. spaxels with ¿ 6 Å and ¡ 0), it is noteworthy that galaxies with star-forming classical bulges are less massive and less concentrated than quenched systems with classical bulges (Yu et al. 2022), possibly indicating that they have a larger gas reservoir (according to the observed increase in gas fraction with decreasing stellar mass; Saintonge et al. 2017). Central star formation enhancements in classical bulges (e.g. Luo et al. 2020) could also be induced by bars (Athanassoula 1992; Wang et al. 2012, 2020) and spirals (Kim & Kim 2014; Yu et al. 2022). In the second case (i.e. spaxels with ¡ 3 Å and ¿ 0), it may be relevant that anaemic spirals and S0s are disk galaxies that can have rising CVC and no star-formation (Kormendy & Bender 2012). Therefore, environmental quenching mechanisms may preferentially remove the gas from galaxies with rising CVCs, stopping their star-formation. Spirals could also fade away as the gas fraction decreases (Yu et al. 2021) and becomes S0s (Kormendy & Bender 2012).
In summary, our results show that the largest number of spaxels come from the two extreme quenching stages: star-forming and fully retired classes (corresponding to late-type spirals and elliptical galaxies, respectively) for which and spaxel distribution coincide with the dynamical suppression hypothesis: the non-quenching or quenching of the galaxies depends on the absence or presence of bulge/spheroid, respectively (which corresponds to low and high velocities in relation or rising and declining CVC in relation, respectively). On the other hand, the scatter analysis indicates that the presence of classical bulge is not the only necessary condition. It seems that galaxies need to further have: higher central density (approximately above 1010 M⊙ kpc-2), no bar, and early-type morphologies (meaning no tight and prominent spiral arms).
Future work will explore the cold gas content of the studied systems (Kalinova et al., in prep.) and will give a complementary perspective on the dynamics and mechanisms responsible for the formation of the various quenching stages of the nearby galaxies.
Acknowledgements
We thank the anonymous referee, whose suggestions helped us to improve the quality and presentation of this paper. DC acknowledges support by the Deutsche Forschungsgemeinschaft, DFG project number SFB956A. SFS acknowledge Conacyt projects CB-285080 and FC-2016-01 -1916, and PAPIIT-DGAPA IN100519. RGB and RGD acknowledges financial support from the State Agency for Research of the Spanish MCIU through the “Center of Excellence Severo Ochoa” award to the Instituto de Astrofísica de Andalucía (SEV-2017-0709), and the projects AYA2016-77846-P and PID2019-109067-GB100. ER acknowledges the support of the Natural Sciences and Engineering Research Council of Canada (NSERC), funding reference number RGPIN-2017-03987. K.K. acknowledges deep gratitude to MPIfR in Bonn for the Guest Researchership 2013-2021.
In this study, we made use of the data of the first legacy survey, the Calar Alto Legacy Integral Field Area (CALIFA) survey, based on observations made at the Centro Astronómico Hispano Alemán (CAHA) at Calar Alto, operated jointly by the Max Planck-Institut für Astronomie and the Instituto de Astrofísica de Andalucía (CSIC). This research made use of the open-source python packages as Astropy (Price-Whelan et al. 2018), SciPy (Virtanen et al. 2020), NumPy (Harris et al. 2020), and Matplotlib (Hunter 2007).
References
- Abadi et al. (1999) Abadi, M. G., Moore, B., & Bower, R. G. 1999, MNRAS, 308, 947
- Alam et al. (2015) Alam, S., Albareti, F. D., Allende Prieto, C., et al. 2015, ApJS, 219, 12
- Athanassoula (1992) Athanassoula, E. 1992, MNRAS, 259, 345
- Balogh et al. (2000) Balogh, M. L., Navarro, J. F., & Morris, S. L. 2000, ApJ, 540, 113
- Belfiore et al. (2016) Belfiore, F., Maiolino, R., Maraston, C., et al. 2016, MNRAS, 461, 3111
- Birnboim & Dekel (2003) Birnboim, Y. & Dekel, A. 2003, MNRAS, 345, 349
- Bluck et al. (2020a) Bluck, A. F. L., Maiolino, R., Piotrowska, J. M., et al. 2020a, MNRAS, 499, 230
- Bluck et al. (2020b) Bluck, A. F. L., Maiolino, R., Sánchez, S. F., et al. 2020b, MNRAS, 492, 96
- Cappellari (2008) Cappellari, M. 2008, MNRAS, 390, 71
- Cheung et al. (2012) Cheung, E., Faber, S. M., Koo, D. C., et al. 2012, ApJ, 760, 131
- Colling et al. (2018) Colling, C., Hennebelle, P., Geen, S., Iffrig, O., & Bournaud, F. 2018, A&A, 620, A21
- Colombo et al. (2018) Colombo, D., Kalinova, V., Utomo, D., et al. 2018, MNRAS, 475, 1791
- Colombo et al. (2020) Colombo, D., Sanchez, S. F., Bolatto, A. D., et al. 2020, A&A, 644, A97
- Corcho-Caballero et al. (2021) Corcho-Caballero, P., Casado, J., Ascasibar, Y., & García-Benito, R. 2021, MNRAS, 507, 5477
- Croton et al. (2006) Croton, D. J., Springel, V., White, S. D. M., et al. 2006, MNRAS, 365, 11
- Davis et al. (2014) Davis, T. A., Young, L. M., Crocker, A. F., et al. 2014, MNRAS, 444, 3427
- Di Matteo et al. (2005) Di Matteo, T., Springel, V., & Hernquist, L. 2005, Nature, 433, 604
- Dobbs & Baba (2014) Dobbs, C. & Baba, J. 2014, PASA, 31, e035
- Ellison et al. (2020) Ellison, S. L., Thorp, M. D., Lin, L., et al. 2020, MNRAS, 493, L39
- Emsellem et al. (1994) Emsellem, E., Monnet, G., & Bacon, R. 1994, A&A, 285, 723
- Faber et al. (2007) Faber, S. M., Willmer, C. N. A., Wolf, C., et al. 2007, ApJ, 665, 265
- Falcón-Barroso et al. (2017) Falcón-Barroso, J., Lyubenova, M., van de Ven, G., et al. 2017, A&A, 597, A48
- Farouki & Shapiro (1981) Farouki, R. & Shapiro, S. L. 1981, ApJ, 243, 32
- García-Benito et al. (2015) García-Benito, R., Zibetti, S., Sánchez, S. F., et al. 2015, A&A, 576, A135
- Gensior & Kruijssen (2021) Gensior, J. & Kruijssen, J. M. D. 2021, MNRAS, 500, 2000
- Gensior et al. (2020) Gensior, J., Kruijssen, J. M. D., & Keller, B. W. 2020, MNRAS, 495, 199
- Genzel et al. (2014) Genzel, R., Förster Schreiber, N. M., Lang, P., et al. 2014, ApJ, 785, 75
- Gunn & Gott (1972) Gunn, J. E. & Gott, J. Richard, I. 1972, ApJ, 176, 1
- Harris et al. (2020) Harris, C. R., Millman, K. J., van der Walt, S. J., et al. 2020, Nature, 585, 357
- Hughes et al. (2013) Hughes, A., Meidt, S. E., Colombo, D., et al. 2013, ApJ, 779, 46
- Hunter (2007) Hunter, J. D. 2007, Computing in science & engineering, 9, 90
- Husemann & Harrison (2018) Husemann, B. & Harrison, C. M. 2018, Nature Astronomy, 2, 196
- Husemann et al. (2013) Husemann, B., Jahnke, K., Sánchez, S. F., et al. 2013, A&A, 549, A87
- Kalinova et al. (2017) Kalinova, V., Colombo, D., Rosolowsky, E., et al. 2017, MNRAS, 469, 2539
- Kalinova et al. (2021) Kalinova, V., Colombo, D., Sánchez, S. F., et al. 2021, A&A, 648, A64
- Khoperskov et al. (2018) Khoperskov, S., Haywood, M., Di Matteo, P., Lehnert, M. D., & Combes, F. 2018, A&A, 609, A60
- Kim & Kim (2014) Kim, Y. & Kim, W.-T. 2014, MNRAS, 440, 208
- Kormendy & Bender (2012) Kormendy, J. & Bender, R. 2012, ApJS, 198, 2
- Kormendy & Kennicutt (2004) Kormendy, J. & Kennicutt, Jr., R. C. 2004, ARA&A, 42, 603
- Kowalski (1972) Kowalski, C. J. 1972, Journal of the Royal Statistical Society. Series C (Applied Statistics), 21, 1
- Krumholz & Kruijssen (2015) Krumholz, M. R. & Kruijssen, J. M. D. 2015, MNRAS, 453, 739
- Lacerda et al. (2018) Lacerda, E. A. D., Cid Fernandes, R., Couto, G. S., et al. 2018, MNRAS, 474, 3727
- Lacerda et al. (2020) Lacerda, E. A. D., Sánchez, S. F., Cid Fernandes, R., et al. 2020, MNRAS, 492, 3073
- Larson et al. (1980) Larson, R. B., Tinsley, B. M., & Caldwell, C. N. 1980, ApJ, 237, 692
- Leroy et al. (2017) Leroy, A. K., Schinnerer, E., Hughes, A., et al. 2017, ApJ, 846, 71
- Leroy et al. (2008) Leroy, A. K., Walter, F., Brinks, E., et al. 2008, AJ, 136, 2782
- Liu et al. (2021) Liu, L., Bureau, M., Blitz, L., et al. 2021, MNRAS, 505, 4048
- Luo et al. (2020) Luo, Y., Faber, S. M., Rodríguez-Puebla, A., et al. 2020, MNRAS, 493, 1686
- Martig et al. (2009) Martig, M., Bournaud, F., Teyssier, R., & Dekel, A. 2009, ApJ, 707, 250
- Martig et al. (2013) Martig, M., Crocker, A. F., Bournaud, F., et al. 2013, MNRAS, 432, 1914
- Meidt et al. (2020) Meidt, S. E., Glover, S. C. O., Kruijssen, J. M. D., et al. 2020, ApJ, 892, 73
- Meidt et al. (2018) Meidt, S. E., Leroy, A. K., Rosolowsky, E., et al. 2018, ApJ, 854, 100
- Meidt et al. (2013) Meidt, S. E., Schinnerer, E., García-Burillo, S., et al. 2013, ApJ, 779, 45
- Monnet et al. (1992) Monnet, G., Bacon, R., & Emsellem, E. 1992, A&A, 253, 366
- Moore et al. (1996) Moore, B., Katz, N., Lake, G., Dressler, A., & Oemler, A. 1996, Nature, 379, 613
- Peng et al. (2010) Peng, Y.-j., Lilly, S. J., Kovač, K., et al. 2010, ApJ, 721, 193
- Price-Whelan et al. (2018) Price-Whelan, A. M., Sipőcz, B., Günther, H., et al. 2018, The Astronomical Journal, 156, 123
- Romeo & Fathi (2015) Romeo, A. B. & Fathi, K. 2015, MNRAS, 451, 3107
- Romeo & Fathi (2016) Romeo, A. B. & Fathi, K. 2016, MNRAS, 460, 2360
- Romeo & Mogotsi (2017) Romeo, A. B. & Mogotsi, K. M. 2017, MNRAS, 469, 286
- Saintonge et al. (2017) Saintonge, A., Catinella, B., Tacconi, L. J., et al. 2017, ApJS, 233, 22
- Salpeter (1955) Salpeter, E. E. 1955, A&A, 121, 161
- Sánchez et al. (2016a) Sánchez, S. F., García-Benito, R., Zibetti, S., et al. 2016a, A&A, 594, A36
- Sánchez et al. (2012) Sánchez, S. F., Kennicutt, R. C., Gil de Paz, A., et al. 2012, A&A, 538, A8
- Sánchez et al. (2016b) Sánchez, S. F., Pérez, E., Sánchez-Blázquez, P., et al. 2016b, Rev. Mexicana Astron. Astrofis., 52, 171
- Sánchez et al. (2016c) Sánchez, S. F., Pérez, E., Sánchez-Blázquez, P., et al. 2016c, Rev. Mexicana Astron. Astrofis., 52, 21
- Sánchez et al. (2014) Sánchez, S. F., Rosales-Ortega, F. F., Iglesias-Páramo, J., et al. 2014, A&A, 563, A49
- Savitzky & Golay (1964) Savitzky, A. & Golay, M. J. E. 1964, Analytical Chemistry, 36, 1627
- Singh et al. (2013) Singh, R., van de Ven, G., Jahnke, K., et al. 2013, A&A, 558, A43
- Sormani et al. (2015) Sormani, M. C., Binney, J., & Magorrian, J. 2015, MNRAS, 449, 2421
- Strateva et al. (2001) Strateva, I., Ivezić, Ž., Knapp, G. R., et al. 2001, AJ, 122, 1861
- Toomre (1964) Toomre, A. 1964, ApJ, 139, 1217
- Virtanen et al. (2020) Virtanen, P., Gommers, R., Oliphant, T. E., et al. 2020, Nature Methods, 17, 261
- Walcher et al. (2014) Walcher, C. J., Wisotzki, L., Bekeraité, S., et al. 2014, A&A, 569, A1
- Wang et al. (2020) Wang, J., Athanassoula, E., Yu, S.-Y., et al. 2020, ApJ, 893, 19
- Wang et al. (2012) Wang, J., Kauffmann, G., Overzier, R., et al. 2012, MNRAS, 423, 3486
- Yu et al. (2021) Yu, S.-Y., Ho, L. C., & Wang, J. 2021, ApJ, 917, 88
- Yu et al. (2022) Yu, S.-Y., Xu, D., Ho, L. C., Wang, J., & Kao, W.-B. 2022, A&A, 661, A98
- Zwillinger & Kokoska (1999) Zwillinger, D. & Kokoska, S. 1999, CRC Standard Probability and Statistics Tables and Formulae (CRC Press)
Appendix A Circular velocity curves across quenching stage
In the left panels of Figs. 7 and 8, we show the individual circular velocity curves (CVCs) of the galaxies and the normalised on their asymptotic velocity CVCs per quenching groups, respectively. The right panels of the figures present the median and percentile (25th and 75th) profiles of the CVCs. The median CVCs and their percentile profiles are smoothed through the Savitzky-Golay smoothing filter (Savitzky & Golay 1964) by adopting third degree polynomial and 21-point wide sliding window.
Appendix B Individual and distribution per quenching stage
Figures 9 and 10 present the individual spaxel distribution of the resolved relationships and for each of the sixth quenching stages, respectively. We compared each of these distributions with the global distribution of the relationships, consisting of the spaxels of all quenching stages.
Appendix C Stability of the and and relations
Both resolved relationships and show overall stability after verification with a cross-validation technique. We randomly select a sub-sample of 10 galaxies from each quenching stage group (in order to keep the balance between star-forming and quenched systems) from the original data set, and reconstruct the two relationships via 100 realisations (i.e. 60 galaxies in total for each realisation) as shown in Fig. 11.
Furthermore, we test whether there is a significant contribution from the bulge region to a certain area in the and relations (especially in the quenching regions due to the expected act of the dynamical suppression mechanism). Interestingly, the stability of the spaxel distribution of the relationships is preserved in both cases when the spaxels of the galaxies are taken into account with or without the central regions (i.e., below and above 0.5 Re, respectively) as presented in Fig. 12. This shows that the central spaxels of the galaxies are not necessary contributing to any specific area in the global relationships (neither to a certain quenching areas).