Cohesion and segregation in higher-order networks
Abstract
Looking to overcome the limitations of traditional networks, the network science community has lately given much attention to the so-called higher-order networks, where group interactions are modeled alongside pairwise ones. While degree distribution and clustering are the most important features of traditional network structure, higher-order networks present two additional fundamental properties that are barely addressed: the group size distribution and overlaps. Here, I investigate the impact of these properties on the network structure, focusing on cohesion and segregation (fragmentation and community formation). For that, I create artificial higher-order networks with a version of the configuration model that assigns degree to nodes and size to groups and forms overlaps with a tuning parameter . Counter-intuitively, the results show that a high frequency of overlaps favors both network cohesion and segregation—the network becomes more modular and can even break into several components, but with tightly-knit communities.
Systems of different nature present not only pairwise interactions involving only two elements of the system but also group interactions that involve three or more elements. Traditionally, the latter have been represented as a collection of the former, even though network techniques to explicitly represent group interactions—namely bipartite graphs and hypergraphs—have been around for decades. Nevertheless, the relevance of modeling group interactions in the structure and dynamics of complex systems has only recently become pronounced; the study of these networks picked up pace, and the term higher-order networks was coined. Higher-order networks are, thus, a generalization of traditional networks with which we can model interactions of groups of any size (including size two) Vasques Filho and O’Neale (2020a).
Using either bipartite graphs or hypergraphs depends on the system and the problem to be addressed. We can quickly transform one into the other but must keep in mind that they can provide some different topological information Estrada and Rodríguez-Velázquez (2006). The main distinctions between them, however, lie in the mathematical representations and analytical solutions, while the concepts are mostly translatable.
A bipartite network is a graph , where and are disjoint sets of nodes and is the set of edges connecting nodes of the different sets. We refer to the sets and as the bottom and top node sets, respectively. A hypergraph is a graph , where is the set of nodes and is the set of hyperedges connecting non-empty subsets of . The transformation is simple: the node set can be seen as the same for both cases; , such that each hyperedge corresponds to a top node ; and hyperedge contains node if there exist an edge . From now on, I will use the hypergraph notation.
The main structural properties of higher-order networks are:
-
•
the degree distribution , where is the node degree or the number of hyperedges adjacent to the node,
-
•
the group size distribution , where is the hyperedge size, or the number of nodes the hyperedge connects, and
- •
These three properties determine the neighborhood size of node according to Vasques Filho and O’Neale (2018); Vasques Filho and O’Neale (2020a):
| (1) |
That is, the neighborhood size of a node is equal to or less than the sum of the size (minus the node itself) of all hyperedges adjacent to that node. The equality (the upper bound) happens where there is no overlap in the network that contains node . The higher the number of overlaps containing is, the smaller ’s expected neighborhood is.
The idea of overlaps in networks representing higher-order interactions is not new, especially concerning bipartite networks. They are known as bipartite clustering Lind et al. (2005); Zhang et al. (2008), butterflies Sanei-Mehri et al. (2018); Wang et al. (2019), and four-cycles Wang et al. (2013); Vasques Filho and O’Neale (2020b). Moreover, they are highly frequent in empirical networks Koskinen and Edling (2012); Vasques Filho and O’Neale (2020b); Vasques Filho and O’Neale (2020a). However, despite the much-needed attention that higher-order networks have attracted recently, the effect of overlaps in the network structure is little explored. Neglecting overlaps in these networks is similar to neglecting triangles in traditional networks.
Thus, the goal of this study is to examine how these overlaps, together with and , affect cohesion, and segregation (fragmentation and community formation) in higher-order networks. To do so, I use a version of the configuration model—assigning degree to nodes and size to hyperedges from specific probability distributions—with several combinations of distributions, ranging from peaked to heavy-tailed Vasques Filho and O’Neale (2018). These combinations are also used to explore how the shape of the probability distributions affects the structure of networks with arbitrary degree and group size distributions.
However, the frequency of overlaps in configuration models is negligible when the density of these artificial networks is comparable to that of empirical ones Vasques Filho and O’Neale (2020b); Vasques Filho and O’Neale (2020a). To overcome this issue, I adapt the configuration model to create overlaps according to a tuning parameter Vasques Filho (2020).
The random process starts after assigning degree to nodes and size to hyperedges, without connecting them. The model picks a node (at random) and, with a probability , tries to form an overlap. It does so by checking whether there are hyperedges and nodes with “capacity” to form an overlap, based on the size and degree assigned to them, respectively. If the model finds hyperedges and nodes with such “capacity”, it randomly chooses two of these hyperedges and one of these nodes and connects them to the initial node to form an overlap. Otherwise (i.e., the algorithm does not find nodes and hyperedges with such “capacity”), the model connects the initial node to another (random) node through a (random) hyperedge. The model repeats this process until no further nodes are available.
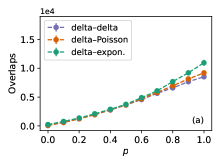
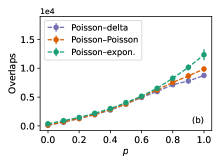
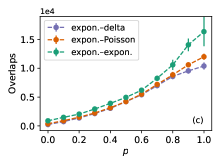
The artificial networks are created following combinations of node degree and hyperedge size distributions using the delta function, Poisson, and exponential distributions, with , and (the values oscillate a little due to the model’s stochasticity). Figure 1 shows the expected number of overlaps for the networks with each combination. Heavy-tailed distributions generate more overlaps for the same due to the higher probability of two nodes being connected by the same hyperedge (Eq. (15) of Ref. Vasques Filho and O’Neale (2020b)).
Then, let us look at how overlaps affect the structure of higher-order networks. To measure the overall cohesion in the network, we will take the mean of the local clustering coefficient according to
| (2) |
where is the number of nodes in the network. The local clustering coefficient is given by
| (3) |
where is the number of existing links between the nodes in the neighborhood of . That is, is the density of . Note that this definition for clustering coefficient is that of traditional networks, introduced in Ref. Watts and Strogatz (1998), and links refer to pairwise relations between nodes. Although many works exist addressing clustering coefficients in hypergraphs Estrada and Rodríguez-Velázquez (2006); Latapy et al. (2008); Blond et al. (2005); Klamt et al. (2009), I argue that we still should rely on the pairwise count of connections between nodes for addressing network cohesion. Thus, we calculate Eq. 3 with a projection of the hypergraph (similarly to the well-known projection of bipartite networks). Counting is equivalent to counting the number of triangles in the neighborhood of , centered in , in the projection.
Alternatively, in a hypergraph, we can walk closed paths of size three (i.e., triangles) following two ways. First, through three different hyperedges, forming the so-called hypertriangles, equivalent to six-cycles in bipartite networks Opsahl (2013); Vasques Filho and O’Neale (2020b); Vasques Filho and O’Neale (2020a). Second, within the same hyperedge of size equal to or larger than three, forming “false” hypertriangles Estrada and Rodríguez-Velázquez (2006). Then, we achieve the same result as in Eq. 3 by counting hypertriangles and “false” hypertriangles centered in in the hypergraph, excluding when the former are embedded in the latter Vasques Filho and O’Neale (2020a). The previous method of calculating clustering as a proxy of cohesion is simpler and more intuitive.
An increasing number of overlaps favors cohesion in the whole network (Fig. 2). The reason for that is actually straightforward: more overlaps result in smaller neighborhood sizes (Eq. (1)) and, consequently, lower values in Eq. 3.
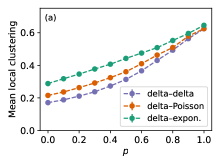
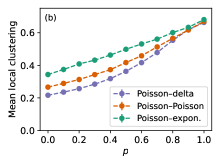
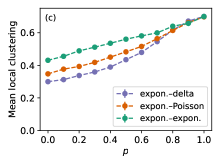
Moreover, note how broader node degree and hyperedge size distributions also favor cohesion in the configuration model, albeit only slightly (compared to the effects of the parameter ). The longer distribution tails increase the probability of pairs of nodes connected through more than one hyperedge, generating some overlaps themselves Vasques Filho and O’Neale (2020b), as Fig. 1 shows. That also explains the less pronounced effects of the distribution tail for high values of , especially concerning degree distributions. The configuration models reach a “saturation” level (with so many overlaps) such that nodes with high degrees (found in heavy-tailed distributions) have neighborhoods of similar size as that of nodes with degrees near the average (as the majority in peaked distributions).
Next, let us look at segregation starting with network fragmentation. For that, we take Borgatti’s measure Borgatti (2006) given by
| (4) |
where is the size of component and , again, is the number of nodes in the network.
The networks start to fragment after a certain value of , which is higher for peaked degree and hyperedge size distributions and lower for broader distributions (Fig. 3). Initially, the fragmentation is very small with a few and small disconnected components. However, it increases fast after in all cases, indicating some transition at that level of overlapping for the artificial higher-order networks with the density we use here.
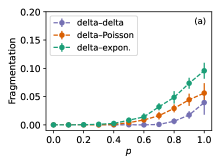
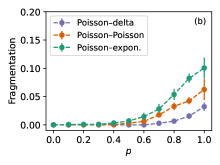
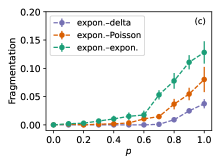
What causes fragmentation is that, as overlapping increases, many edges, that would otherwise connect larger sets of (unique) nodes, repeatedly connect nodes from a smaller set. In other words, overlaps reduce edge availability for bridging the network together. At first glance, this result might seem contradictory to that of the clustering coefficient: with more overlaps, we have concurrent higher cohesion and fragmentation. However, on closer inspection, it becomes evident that, with the same density, more cohesive networks are more segregated, with possible fragmentation. That is, tightly-knit node subsets emerge, developing into communities, with less frequent or absent connections with other subsets.
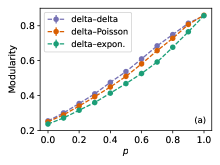
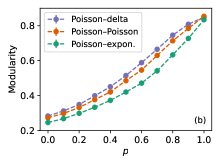
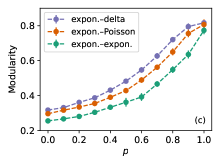
To support this idea, we can also investigate how network modularity behaves as a function of the tuning parameter . For that, let us use the Louvain method to detect communities Blondel et al. (2008), and network modularity Newman and Girvan (2004) to calculate how well defined communities are, which helps illustrate network segregation.
As expected, modularity grows fast with , more so with peaked degree and hyperedge size distributions, especially the latter (Fig. 4). On the other had, broad hyperedge size distributions curb growing modularity because they create large subsets of connected nodes with individual large-sized hyperedges. For that exact reason, they result in networks with higher modularity for . However, with raising overlapping levels, it takes longer for small-sized hyperedges connecting each of these nodes (in large subsets) with nodes from other subsets to start connecting nodes within the large subsets instead.
To conclude, we have seen that the level of overlapping can drastically affect the structure of high-order networks in several ways. In particular, at high levels, it boosts segregation, with the emergence of well-defined community structures and leading to an eventual fragmentation of the network. While it seems counter-intuitive that overlaps increase both cohesion and segregation, the fact is that these two characteristics reinforce each other in networks with the same density. These findings are especially relevant to social systems, where understanding the mechanisms that result in more overlaps—and societal segregation—becomes critical.
References
- Vasques Filho and O’Neale [2020a] D. Vasques Filho and D. R. J. O’Neale. Transitivity and degree assortativity explained: The bipartite structure of social networks. Phys. Rev. E, 101(5):052305, 2020a.
- Estrada and Rodríguez-Velázquez [2006] E. Estrada and J. A. Rodríguez-Velázquez. Subgraph centrality and clustering in complex hyper-networks. Physica A, 364:581–594, 2006.
- Vasques Filho and O’Neale [2018] D. Vasques Filho and D. R. J. O’Neale. Degree distributions of bipartite networks and their projections. Phys. Rev. E, 98(2):022307, 2018.
- Vasques Filho [2019] D. Vasques Filho. Structure and dynamics of social bipartite and projected networks. PhD thesis, The University of Auckland, 2019.
- Lind et al. [2005] P. G. Lind, M. C. González, and H. J. Herrmann. Cycles and clustering in bipartite networks. Phys. Rev. E, 72(5):056127, 2005.
- Zhang et al. [2008] P. Zhang, J. Wang, X. Li, M. Li, Z. Di, and Y. Fan. Clustering coefficient and community structure of bipartite networks. Physica A, 387(27):6869–6875, 2008.
- Sanei-Mehri et al. [2018] S.-V. Sanei-Mehri, A. E. Sariyuce, and S. Tirthapura. Butterfly counting in bipartite networks. In Proceedings of the 24th ACM SIGKDD International Conference on Knowledge Discovery & Data Mining, pages 2150–2159, 2018.
- Wang et al. [2019] K. Wang, X. Lin, L. Qin, W. Zhang, and Y. Zhang. Vertex priority based butterfly counting for large-scale bipartite networks. PVLDB, 2019.
- Wang et al. [2013] P. Wang, P. Pattison, and G. Robins. Exponential random graph model specifications for bipartite networks—a dependence hierarchy. Soc. Networks, 35(2):211–222, 2013.
- Vasques Filho and O’Neale [2020b] D. Vasques Filho and D. R. J. O’Neale. The role of bipartite structure in R&D collaboration networks. Journal of Complex Networks, 8(4):cnaa016, 2020b.
- Koskinen and Edling [2012] J. Koskinen and C. Edling. Modelling the evolution of a bipartite network—peer referral in interlocking directorates. Soc. Networks, 34(3):309–322, 2012.
- Vasques Filho [2020] D. Vasques Filho. Mechanisms and emergent properties of social structure: the duality of actors and social circles. 2020.
- Watts and Strogatz [1998] D. J. Watts and S. H. Strogatz. Collective dynamics of ‘small-world’ networks. Nature, 393(6684):440–442, 1998.
- Latapy et al. [2008] M. Latapy, C. Magnien, and N. Del Vecchio. Basic notions for the analysis of large two-mode networks. Soc. Networks, 30(1):31–48, 2008.
- Blond et al. [2005] S. L. Blond, J.-L. Guillaume, and M. Latapy. Clustering in p2p exchanges and consequences on performances. In International Workshop on Peer-to-Peer Systems, pages 193–204. Springer, 2005.
- Klamt et al. [2009] S. Klamt, U.-U. Haus, and F. Theis. Hypergraphs and cellular networks. PLoS Comput. Biol., 5(5):e1000385, 2009.
- Opsahl [2013] T. Opsahl. Triadic closure in two-mode networks: Redefining the global and local clustering coefficients. Soc. Networks, 35(2):159–167, 2013.
- Borgatti [2006] S. P. Borgatti. Identifying sets of key players in a social network. Comput. Math. Organ. Th., 12(1):21–34, 2006.
- Blondel et al. [2008] V. D. Blondel, J.-L. Guillaume, R. Lambiotte, and E. Lefebvre. Fast unfolding of communities in large networks. J. Stat. Mech-Theory E., 2008(10):P10008, 2008.
- Newman and Girvan [2004] M. E. J. Newman and M. Girvan. Finding and evaluating community structure in networks. Phys. Rev. E, 69(2):026113, 2004.