Investigating the Effects of Mood & Usage Behaviour on Notification Response Time
Abstract.
Notifications are one of the most prevailing mechanisms on smartphones and personal computers to convey timely and important information. Despite these benefits, smartphone notifications demand individuals’ attention and can cause stress and frustration when delivered at inopportune timings. This paper investigates the effect of individuals’ smartphone usage behavior and mood on notification response time. We conduct an in-the-wild study with more than participants for five weeks. Extensive experiment results show that the proposed regression model is able to accurately predict the response time of smartphone notifications using current user’s mood and physiological signals. We explored the effect of different features for each participant to choose the most important user-oriented features in order to to achieve a meaningful and personalised notification response prediction. On average, our regression model achieved over all participants an MAE of ms and RMSE of ms. We also investigate how physiological signals (collected from E4 wristbands) are used as an indicator for mood and discuss the individual differences in application usage and categories of smartphone applications on the response time of notifications. Our research sheds light on the future intelligent notification management system.
1. Introduction
Smartphones, laptops, and desktop computers play an important role in human everyday lives. These devices frequently send people notifications such as emails, messages, news, application update information, etc. Inappropriate interruptions can lead to user annoyance and anxiety (Bailey et al., 2001), decrease productivity (Renaud et al., 2006) and task performance (Bailey et al., 2000), or affect emotional state (Bailey et al., 2001). For instance, Perlow et al. (Perlow, 1999) found that the software engineers in a high technology company had difficulties meeting deadlines due to frequent interruptions. These examples highlight the importance of interruption management as an emerging field of research to reduce distractions.
Human attention is a finite resource. When people perform a task, an interruption can split the attention resource into two interactive tasks (Kim et al., 2015). People need to estimate whether the benefits of the interrupted interaction are high enough to offset the loss of attention in the original task. Different actions can be taken to deal with interruptions, such as ignoring, postponing the processing to a more convenient time, or immediately resolving the interruptions. Different measures may delay resuming the original task and reduce the task performance to varying degrees (Trafton et al., 2003).
Receptivity refers to a user’s reaction to an interruption which may indicate both the level of interruptibility of the user and their experience of the interruption (Fischer et al., 2010). In some cases, even though the notification is interruptive, the user can still be receptive to the notification. Previous studies have shown that users’ receptivity to notifications is influenced by many factors: (1) informational qualities of the notifications, e.g. interest, entertainment, relevance and actionability (Fischer et al., 2010); (2) mobile usage, such as the time of the interruption and the type of app pushing the notification (Shirazi et al., 2014; Fischer et al., 2010) ; (3) demographics, such as personality traits (Yuan et al., 2017); (4) personal dynamics, such as location (Exler et al., 2016), transitions between activities (Ho and Intille, 2005) and social roles (Anderson et al., 2016).
However, we propose a system in a real-world scenario to help manage the automatic pop-up notifications of frequently used smartphone applications, which has not been attempted by other researchers before. Users’ receptivity varies based on physical, psychological, and affective conditions , and the accuracy of existing systems in addressing these conditions is still relatively low (Mehrotra et al., 2016b). The difficulty of including these conditions can be explained by an example : Users may get annoyed (psychological) if an email from their boss suddenly pops up while they are concentrating on writing a paper and are in a state of ’flow’ (physical). However, it is not clear how the user would feel (affect) if this email notifications were postponed. On the one hand, they may be relieved at not being disturbed, but on the other hand, it could cause stress if they were waiting for important information to help them with a problem they are experiencing.
Therefore, in this research, we aim to bridge this gap and conduct an in-the-wild study in a multi-device setting to collect user behaviour along with contextual information, interruptibility, receptivity, mood and social roles from more than participants during five weeks. We have designed two applications, Balance for desktop and Balance for Android, which use ESM (Hektner et al., 2007) to capture users’ interruptibility preferences, user behavior, and mood toward the notifications on smartphones. Meanwhile, participants are asked to wear a wristband to record their physiological signals ( Electrodermal Activity (EDA), Blood Volume Pulse (BVP), and Skin Temperature (ST)). We summarize the main contributions as follows:
-
•
We conduct an in-situ study with participants over a five-week period. In total, we collected 42,270 notifications with 3,236 ESM responses and more than 5,920 hours of physiological signals from Empatica E4 wristbands. To the best of our knowledge, this is the most heterogeneous and diverse data set collected in-the-wild to study the notification response behaviour of users.
-
•
We explore diverse notification response behaviours of different participants and investigate the relationships between multiple factors (e.g. mood and apps) and notification response times. We found a statistically significant correlation between response time and in-use apps.
-
•
We conduct extensive experiments to predict the notification response time for each participant. The experiment results show that the proposed model (Bayeian Rdige Regressor) achieves high prediction performance (MAE = 0.7764 and RMSE = 1.0527). We then derive the most useful features for each participant to achieve a meaningful and personalised prediction of notification.
-
•
We investigate how the mood-related features improve the prediction performance by utilising the ESM responses and physiological signals (e.g. EDA and HR). We further discuss various factors affecting the prediction performance, such as the individual differences and categories of apps.
The investigation of mood, physiological signals, and usage behaviour on users’ receptivity to notifications on the smartphone leads to new sights to the future notification management system. The remainder of the paper is as follows. Section 2 introduces related works of interruptibility management, receptivity and popular mood sensing approaches. Section 3 describes the data collection procedures, including participant recruitment, applications designed for data collection, Experience Sampling Method (ESM) questionnaires, and collected data types. Then we introduce the pre-processing techniques and extracted features in Section 4. In Section 5, we analyze notification response behaviours across different participants in various scenarios. Section 6 shows the experimental results for predicting the notification response time, and Section 7 lists the limitations and implications of this research. Finally, we summarize our findings in Section 8 and indicate the potential directions in future research.
2. Background
2.1. Interruptibility Management
We considered the current state of the art regarding response times. In this paper, we define response time as the time that elapses between receiving a notification and opening the corresponding app.
Okoshi et al. (Okoshi et al., 2019) presented a system to detect opportune moments for interruptions based on click rate gain using mobile sensing and ML methods. They calculated the user’s click response times by measuring the time between a notification’s arrival and the response to the notification, i.e. click on the notification. This data was logged along with contextual information from the smartphone and the data were evaluated. A trained linear regression model then identified whether a moment in time was an opportune moment to display a notification based on the extracted features. The adaptive notification component then delayed the presentation of notifications to the user until an opportune moment was detected. This breakpoint-based notification scheduling system resulted in increased click rates and quicker responses from users.
Saikia et al. (Saikia et al., 2017), developed an optimization process to reduce the reaction time and increase the opening rate of notifications for a mobile news application. Like Okoshi et al. (Okoshi et al., 2019) they defined the response time as the time between receiving and opening notification and gathered additional context data (such as the category of notification, time of the day, location, etc.). Also, the notification opening rate, which is similar to the click rate (Okoshi et al., 2019), was used, to optimize the opening rate and minimize the response time. With their framework, Saikia et al. reached a decreased reaction time by 13,3% and improved the opening rates by 65.24%.
Westermann et al. (Westermann et al., 2016) have studied the significance of the context factor time, regarding the time of the day and weekdays, on receptivity to notifications based on android smartphones. For this, they sent advertisement notifications about popular brochures. The response time was set as the time between receiving a notification and opening the app. Results exhibit notable variations in response times and notification-triggered app launch numbers for weekdays and different time slots.
The authors (Visuri et al., 2019) developed an application to log self-reported data on the significance of notification contents, notification source, and delivered context to analyze the relationship between notification interaction choices and content importance. They also collected data such as contextual information, notification content, time of delivery, and whether the user clicked on the notification or dismissed it. Based on user ratings of past notifications, contextual data, and semantic analysis, a predictive Machine Learning model is created to predict whether future notifications are useful or not. The results showed that considering only interactions like click or dismiss ratios does not suffice to classify the importance of notification as users mostly tend to ignore notifications irrespective of their importance. Using semantic analysis of notification content enhances the accuracy of the prediction model.
The paper by Fortin et al.(Fortin et al., 2019) highlights the correlation between skin conductance response (SCR) and the prediction of the perception of smartphone notifications. To study the impact of user activity on the determined signals, the participants were asked to perform an inactive (watch a wildlife documentary) and active (solve paper mazes) task during the measurement. They were then directed to note the stimulus (sound or vibration of the phone) that made them perceive the notification and press the corresponding buttons on a Pebble smartwatch placed next to them. The experiments showed that notifications perceived because of their tactile properties (vibration) stimulated larger skin conductance responses and SCR with higher amplitudes compared to those perceived through auditory properties (sound). A logistic regression model was trained to examine if a perception prediction method using skin conductance could aid notifications, including the smartphone’s ringer mode as a predictor variable. This model successfully identified perception in 75% of true cases when participants perceived the notification and 38% of missed notifications.
2.2. Receptivity
In (Mehrotra et al., 2016b), Mehrotra et al. study the effects of cognitive and physical contextual information on individuals’ receptivity towards notifications. Lee et al. (Lee et al., 2019) investigate the correlation of individuals’ relationships to contacts and contextual descriptors on the receptivity to mobile instant-messaging notifications. The authors find that contextual descriptors such as the engagement in activities are more descriptive than the relationship to contacts when predicting receptivity.
In this study (Mehrotra et al., 2016a), the authors have investigated the factors that make a smartphone notification disruptive and its impact on the response time. An Android app called ”my phone and me” was created. The application uses Android’s Notification Listener Service to access notifications and Google’s Activity Recognition API and ESSensorManager to receive context info. Apart from this, the app also triggers questionnaires every 4 hours between 8 am and 8 pm. Reaction time is considered as the time from the notification arrival till the time it was reacted upon. The modes of identifying notification (ringer or vibration) and the user’s personality traits were also noted. The results showed that high-priority notifications were responded much faster, whereas those from less frequent contacts were responded too late. Also, notifications are considered highly disruptive, when the user was performing a task and least disruptive before starting a new task or being idle.
Züger et al. (Züger et al., 2018) predicted the interruptibility of 13 software developers on computer interaction, heart-, sleep-, and physical activity-related data. They found that the interaction with a computer gives more information about interruptibility than biometric data. However, using both data outperformed the results ahead.
2.3. Mood Sensing Approaches
Before we turn to papers in the area of Attention Management, let us give a definition of the term mood, which is frequently used in this paper. Mood is a diffuse affective state that describes an individual’s subjective feeling over a long time. Unlike emotions, mood lasts over hours or days, and the intensity is usually low. Most of the time, we cannot assign a specific trigger to our mood, or to name a reason. Nonetheless, mood influences our behavior and experiences (Scherer, 2005).
Changes in activities, moods and behavior of users provide valuable insights on providing context-aware services and minimizing unwanted interruptions. According to recent researches in psychology frequency of changes or the rate of instability in different characteristics can affect the interruptability of users (Couffe and Michael, 2017). In the field of Attention Management, different consequences were investigated. Among others, the influence of interruptions on our mood. Zijlstra (Zijlstra et al., 1999), for example, identified interruptions resulting in negative emotions. The counterpart is our mood as an internal stimulus, which results from our insights, and influences our interruptibility (Miyata and Norman, 1986; Dabbish et al., 2011). Therefore, emotions and stress are not only consequences of interruptions but also influencing our interruptibility.
Yuan et al. (Yuan et al., 2017) proposed not only using personality traits to group similar users, but they also considered different contextual information such as location, changes in the state of the user, time, transition state, current activity, and mood to predict reactions to interrupts and also interruptibility intensity. Kaur et al. (Kaur et al., 2020) developed a real-time system recommending during opportune moments transitions and breaks while not disrupting people during their focused states. They evaluated their system with a combination of emotions (classified user’s facial expression), productivity (daily task list), and self-reports. Using personalized models, they achieved an accuracy of 86% and 77% for predicting opportune moments for transitions and breaks, respectively.
Khan et al. (Khan et al., 2021) propose a new approach for Automated Mood Recognition (AMR) in a smart office environment, which reduces computational requirements by requiring fewer mood models. This is done by clustering physiological signals by groups of people who sense emotions in the same way. They used machine learning models for classification and regression, which are trained based on the extracted features of users in common perception clusters recognizing the mood. Eight different categories of moods are recognized, each with three different levels denoting low, medium, and high intensities. The proposed approach seems to be a trade-off between the requirement of a large number of personalized mood models and the insufficient performance of generalized models for AMR. Results show respective average F1 scores of 0.76 and 0.79 for perception clusters and personalized-based AMR.
2.4. Relevance to our approach
Current approaches in the field of attention management already concentrate on notifications and their consequences on human behavior and well-being. It is already known that receiving notifications can negatively impact on our mood and trigger stress. Likewise, the reverse case had shown that our mood influences our behavior towards notifications and our interruptibility. We want to go one step further and look at the effects of our mood on the response time to notifications. For this purpose, we extend the current state of research by adding physiological signals to the moods captured via ESM. We want to identify whether the mood directly affects the response time. Using individual regression models, we predict the receptivity of each user.
3. Data Collection
In this section, we describe the design and data collection of our in-the-wild study. First, we give a general overview. Further, we provide some insights about the participants we measured, before we explain the applications and collected data in detail.
3.1. Overview
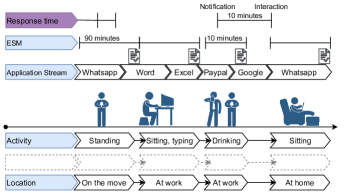
We performed an in-the-wild study to gather user behavior regarding smartphone notification arrival, response time, combined with contextual information and mood via Android smartphones, desktop computers, and physiological signals. By advertising our study on our websites and networks, we acquired participants for our field study. The data collection began at the end of January 2020 and continued for five weeks. The participants were asked, to install the applications Balance for Android (see Figure 2(a)) and Balance for desktop (see Figure LABEL:fig:desktop_app) on their smartphones and desktop computers, respectively. Both applications facilitate continuous background sensing, as well as Experience Sampling Methods (ESMs) (Hektner et al., 2007). The participants were free to additionally choose to have their physiological signals measured via an E4 wristband. This part of the measurement was coordinated and supervised by a contact person from the respective country of origin. By installing the applications or putting the E4 wristband on, the participants received information about the study and the data collected. After that, privacy protection measures and the rights of the participants were introduced (e.g., erasing their collected data on request). Before the participants were guided by a short tutorial on using the corresponding applications and handling E4, they had to give their informed consent. Our privacy department and ethics committee approved the consent forms and data collection procedures. Our study design (see Figure 1) called for most contextual information to be recorded in the background without the participant’s input, such as running applications, physical activities, or locations. Another part of our mixed-method approach was to present scheduled questionnaires every minutes. We asked the participants about their mood, social role, interruptibility, and the kind of task they were working on in the last minutes. Additionally, we implemented an event-based approach to show the questionnaire, which was activated after the participant interacted more than 10 minutes with their phones. These scheduled questionnaires were limited to the time between 7am and 10pm and the event-based ones had a minimum time of minutes between each other. Preventative we implemented the same limitation not to push a questionnaire after the participant received a periodic one. With these restrictions, we addressed the strain of responding to questionnaires and ensuring the quality of data (van Berkel et al., 2017; van Berkel et al., 2019). All used approaches are well-known in ESM based studies to capture contextual information in-situ (van Berkel et al., 2017). Figure 1 depicts the design of the study, explained above.
3.2. Participants
In our experiments, we focus on response time regarding smartphone notifications. Because of that, we took of all measured participants into account ( male, female, diverse). The remaining had to be removed because they had not used a smartphone, we had not sufficient answers from them on the ESM questionnaires, or some technical problems affected the data collected by them. Our participants were between and years old (mean = and std= years) and could be acquired from five different countries on three continents, e.g. Asia, Oceania, and Europe. All participants came from a university domain comprising junior and senior scientists and technical staff members. We found Android, Windows, and macOS users in our measurement. participants installed both, the smartphone and the desktop application, and of them wore an E4 wristband additionally (see Table 1). The data was regularly transmitted to a server hosted at our university and stored in an internal database. The upload, as well as the data, were encrypted. Compared to other ESM-based studies within the field of interruptibility, the overall answering rate () is comparable to similar studies (Pejovic and Musolesi, 2014). So to say, out of questionnaires were answered.
| gender | ||||
|---|---|---|---|---|
| device | female | male | not specified | |
| Smartphone only | 0 | 2 | 1 | |
| Smartphone and desktop | 0 | 3 | 0 | |
| Smartphone, desktop, and E4 wristband | 2 | 10 | 0 | |
3.3. Collected data
In this section, we introduce the two applications Balance for Android and Balance for desktop (see Figure 2), which we implemented to capture user behavior on desktop computers and Android smartphones. The technical details and used concepts for gathering background data and experience sampling will be given. First, we focus on the implementation of the multi-platform application for Windows and macOS. Afterward, we will explain the Balance for Android.


3.3.1. Balance for Windows & macOS
We decided to use a multi-platform application to cover the broadest possible range of users, either using Windows or macOS as an operating system. The access to foreground applications, the information given in their title bars, as well as keyboard and mouse events were provided by the libraries pywin32111See: https://pypi.org/project/pywin32/ and the pyobjc222See: https://pypi.org/project/pyobjc/ on Windows and macOS, respectively. Both libraries are wrappers to low-level native operating system interfaces that allow direct access to system information, peripheral devices, and functions. Another two libraries our applications relied on are the psutil333See: https://pypi.org/project/psutil/ and subprocess32444See: https://pypi.org/project/subprocess32/ libraries. We used the cross-platform library Psutil to abstract information about system load and access to running processes. This includes, among other things, retrieving battery information such as the remaining charge and power states. With the subprocess32 library and native system calls, we parsed and scanned nearby Wi-Fi networks.
3.3.2. Balance for Android
The functionalities of the Balance for Android are very similar to the Balance for desktop computers. Analog to the desktop application, the Balance for Android also regularly uploads the recorded data encrypted to the university server. The main focus of the design was the low battery consumption, the limited resources, and the seamlessly recording of the data in the background. With the background services, we kept track of interactions with applications and notifications, location updates, and the phone’s state (e.g., screen status, ringer-modes). The phone’s last known location was processed by a Fused Location Provider 555See: https://developers.google.com/location-context/fused-location-provider/, an API to estimate location information. It manages the Wi-Fi, mobile communication services, and GPS while improving battery performance and resource consumption. Besides, we gathered information on physical activities by using the Google Recognition API666See: https://developers.google.com/location-context/activity-recognition/. This API offers to report recognized physical activities and besides optimizing the battery performance. The optimized battery performance is achieved by reducing updates when the device is idle and using low-power sensors until the activity is reported.
Applications & Notifications. Accessibility Services777See: https://developer.android.com/reference/android/accessibilityservice/AccessibilityService or Notification Listeners888See: https://developer.android.com/reference/android/service/notification/NotificationListenerService are common methods to gather data on applications and notifications using Android, in the field of interruption management (Visuri et al., 2019; Weber et al., 2019). We used the Accessibility Service to gather the name and the package identifier of the used application, running in the foreground, from the smartphone. This record always happens when the window or its state changes. Another Service integrated was the Notification Listener. It intercepts the reception and removal of notifications and accesses their underlying representation. This helps us to get information like the time of arrival of the notification, the contact and group names the notification came from, or the length of the notification’s content. To extract the contacts and group names, we set some applications on a white-list to process their notifications on the smartphone directly. As we were only interested in contacts, we set only popular messaging applications, like Whatsapp, Outlook, Twitter, Facebook, Microsoft Teams, Slack, or Telegram, on the list.
In order to infer the responsibility of the user and to distinguish between the notifications we asked the user about the relationship to the sender. The user could choose between the relationships family, friend, work, and none, whereby multiple naming was possible. As the senders were transmitted pseudonymized for data protection reasons, it could not be detected if a sender was named differently in different messengers or was part of a group chat. Therefore, we could not avoid sending multiple relationship questionnaires over one sender with different names. So that this additional questionnaire does not negatively influence the response rate, a minimum of correspondences with this sender was assumed before this questionnaire was triggered.
3.3.3. Physiological data
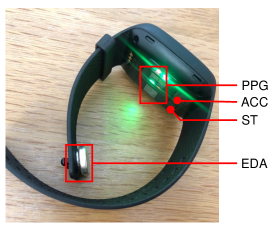
During the data collection, participants were asked to wear Empatica E4 999Empatica E4 wristband: https://www.empatica.com/en-int/research/e4/ wristband as shown in Figure 3. E4 wristband is first proposed in (Garbarino et al., 2014) and has multiple sensors: Electrodermal Activity (EDA) sensor, 3-axis Accelerometer (ACC), Photoplethysmography (PPG) sensor, and optical thermometer. EDA has also been known as galvanic skin response (GSR) or skin conductance, which measures the continuous variation in skin electrical characteristics at 4 Hz. ACC records the acceleration in three axes at 32 Hz in the range of [-2g, 2g], which captures the physical activity of users. PPG is an optically obtained plethysmogram that can be used to measure the Blood Volume Pulse BVP at 64 Hz. The Heart Rate (HR) and inter-beat interval (IBI) are derived from BVP signals by the wristband. The optical thermometer measures the peripheral skin temperature (ST) at 4 Hz. Overall, the E4 wristband is light-weight and comfortable, which is particularly suitable for continuous and unobtrusive monitoring of participants in our research. It was shown very early on that emotions are related to the autonomic nervous system and that this is accompanied by changes in physiological signals (Levenson, 1988; Kreibig, 2010). By measuring a person’s physiological signals, changes can be recognized, and emotions can be assigned. We use the correlation between mood and physiological signals by extracting features from these signals and incorporating them into our regression models.
3.3.4. ESM questionnaire
In this study, the participants were asked to rate their mood regarding the last hour (see Figure 2(b)). We used the Self-Assessment Manikin (SAM) from Bradley and Lang (BRADLEY and LANG, 1994) to gather the arousal and valence state. The arousal scale ranges from relaxed to excited, while the valence ranges from positive to negative. Furthermore, we gathered the dominant social role the person has been in for the last 15 minutes. In (Ashforth et al., 2000) the authors describes a social role as a mental construct, which individuals maintain to organize their surroundings. Thus, we investigate work and private as domains with their labelled social roles as a characterization of different behaviour. Contrary to prior work (Nippert-Eng, 1996; Ozenc and Farnham, 2011), we decided not to be more granular regarding the different roles, although family, work, and social are reported as the most universal social behaviours. The focus of our study lay on the work-life balance, and the distinction between social and family seemed redundant, especially since the relationship to contacts covers it. Finally, we asked the participants for whom they are interruptible - contacts from the work or private domain, nobody (none), or everybody (both domains).
4. Methodology
| Feature | Description | Contextual Information |
| Smartphone Data | ||
| topk_x_unique | Top k applications in the last minutes. | Foreground application |
| phone_apps_X | Number of used smartphone applications in the last minutes, extracted from the name and the package identifier of the current foreground application | Foreground application |
| physical_activity_X | Number of unique physical activities reported by the Google Recognition API | Physical activity |
| place_top_x, place_other | Top three () frequently visited places and all other places. Category of the location according to Google’s Geocoding API. | Location (Android) |
| screen_on, screen_off, screen | The current state of the screen. | Screen state |
| notification_length | Length of the text within the notification. | Notification content |
| Monday, Tuesday, Wednesday, Thursday, Friday, Saturday, Sunday | Day of the week. | Notification arrival time |
| morning, afternoon, evening, midnight | Time of the day: morning (from 6 a.m. to 12 p.m.), afternoon (from 12 p.m. to6 p.m.), evening(from 6 p.m. to 0 a.m.), and midnight (from 0 a.m. to 6 a.m.) | Notification arrival time |
| is_weekend | Binary value describing, whether it is weekend or not. | Notification arrival time |
| loc_8, loc_10 | Longitude and latitude information of the device as Plus Code | Location |
| relation_x | The participant’s relationship to the extracted contact and/or group. Participants could choose between family, friend, work, and none. Multiple selections are possible (e.g., work and friend). | Relationship |
| contact | Hashed contact and/or group name extracted from notification titles | Contact |
| Experience Sampling Method Data | ||
| valence, arousal | The affective state of the last minutes | Mood |
| private, work, both, none | Interruptibility preferences of the last minutes. | Interruptibility |
| private, work, both | Social role of the person in the last minutes. | Social role |
| Physiological Signals | ||
| Mean, Variance, Standard Deviation | EDA, SCR, SCL, BVP, HR, IBI, ST | |
| min, max | Min and max value | EDA, SCL, SCR, BVP, HR, ST |
| rms | Root mean square | HR |
| The absolute value of the slope of the linear regression line | EDA, SCL, HR, ST | |
| The square root of the absolute values of the slope of the linear regression line | EDA, SCL, HR, ST | |
| The square root of the absolute value of the intercept of the linear regression line | EDA, SCL, HR, ST | |
| The third power of the square root of the absolute value of the intercept of the linear regression line | EDA, SCL, HR, ST | |
| nni_50/20, pnni_50/20, nni_20, pnni_20 | Number,and percentage of interval differences of successive RR-intervals greater than 50ms and 20 ms, respectively | IBI |
| vlsf, lf, hf, lf_hf_ratio | Power in HRV in the very low/low/high frequency. Power of lf/hf | IBI |
| sdsd, range_nni | The standard deviation of differences between adjacent RR-intervals. Difference between the maximum and minimum nn_interval | IBI |
| cvsd, cvnni | Coefficient of variation, of successive differences (cvsd), equal to the ratio of rmssd / sdnn divided by mean_nni. | IBI |
| triangular_index | The HRV triangular index measurement is the integral of the density distribution divided by the maximum of the density distribution. | IBI |
4.1. Pre-processing approaches
In the first part of the machine learning, cleaning up the data is necessary to get rid of noise and homogenize it. This preparation helps to process the data in all further steps. One of those preparations was to harmonize the applications’ names through all considered platforms (windows, macOS, and android), e.g. mapping microsoft-powerpoint to PowerPoint, or by removing system-specific endings by regular expressions. Furthermore, we opted for parsing the google play store websites according to the mobile applications used by our participants to extract the suited applications category.
The Google Recognition API returns all recognized physical activities and their corresponding confidence ratings. Reducing the data, we chose the activities with the highest confidence rating and forwarded the last known activity for all following events. An upsampling was also be done for other data like the ringer mode, features regarding the last known locations, and screen status. The software package used to extract more valuable place information was Plus Codes from google Plus Codes101010See: https://maps.google.com/pluscodes/. The code gives us a description of a rectangular area, including the given longitude and latitude information. Depending on how long the plus code used is, the accuracy of the location information differs.
4.2. Extracted features
We prepared the data according to our needs for the regression model. It was decided that the best method for this investigation was to calculate the features on the data before the notification arrived. All extracted features are shown in Table 2.
4.2.1. Features extracted from Smartphone Data
We first examined the current context of the user. On the one hand, it can be deduced from this whether the user is currently interruptible and, accordingly, whether the user will react immediately to an incoming notification or not. For this purpose, we analyzed the apps used in the last 5 to 30 minutes until the notification arrived. We discovered the top k smartphone applications by counting the appearance of the application per user. Assume user has an app set , where the app is sorted according to the number of receiving notifications from the training dataset. Namely, app receives most notifications and receives least notifications. In this research, we only study the top-k apps , where the is set to be 10. We will explain the in detail in Section 5.1.
One indicator of whether the person would respond immediately to a notification is whether the smartphone is currently in use. For this, we asked whether the screen was on or not. We also took into account the length of the notification and from whom the message came from. If the contact was known, we included the relationship to this contact as well. The sender-recipient relationship is closely related to the response rate of the notification (Mehrotra et al., 2015; Mehrotra et al., 2016a). Mehrotra et al. have reported that the sensed interruption depends on the sender of a notification and that chat notifications from a family member or relative have shown the highest acceptance rates. As described earlier, we used the Android Google API to record the current physical activities of the participants. Breakpoints in physical activities have been proven to mark opportune moments for interruptions. Okoshi et al. (Okoshi et al., 2015a, b, 2017) examined breakpoints within physical activities and application usage. The authors find that notifications delivered at breakpoints denoted as transitions between applications and physical activities can lower the individuals’ mental burden. Ho and Intille (Ho and Intille, 2005) also suggest that notifications delivered during activity transitions produce more favorable outcomes than those delivered randomly. The number of different activities detected was also used as a feature in the first stage classification. As another feature, we used the Plus Codes representing the location where the user is currently staying. The most frequently visited locations of each subject were also set as features. For this purpose, we first determined the three locations of each subject visited most frequently by him during the measurement process. These three locations represent our top 3 locations. All other Plus Codes were assigned to the category other. After that, it was determined where the participant has been before receiving the notification by setting one of the top 3 locations, or the category other true.
Furthermore, we used the day of the week, whether it was a weekend, and the time of day as features representing time. To set a time of the day, we split the day into four parts, midnight (from 0 a.m. to 6 a.m.), morning (from 6 a.m. to 12 p.m.), afternoon (from 12 p.m. to 6 p.m.), and evening (from 6 p.m. to 0 a.m.). Several previous studies have investigated the relationship between times of the day and notification response (Okoshi et al., 2017; Okoshi et al., 2019; Saikia et al., 2017). Okoshi et al. and Saikia et al. have found that by sending out notifications at opportune times of the day, the response time is greatly decreased.
4.2.2. Features from ESM Data
Additionally to the other features, we used the ESM questionnaire data, describing the mood, the interruptibility preferences and the current social role. The mood was measured in two scales: valence and arousal (see Section 3.3.4). They represent different kinds of feelings: from unhappy to happy (represented as 1-5) and from calm to excited (represented as 1-5), respectively. In Section 5 we used the features containing the contextual information of interruptibility and social role. We applied one-hot-encoding to represent this nominal data.
4.2.3. Features for Physiological Signals
We decided to extract statistical features on all given physiological signals, which are common to be used for mood recognition. Furthermore, we followed Heinisch et al. (Heinisch et al., 2019), adding features based on the linear regression line. These features have been shown to be robust to the influence factor of physical activity. Since we also conducted an in-the-wild study, we fell back on this type of feature.
The EDA signal can be divided into two components, the skin conductance response (SCR) and the skin conductance level (SCL). SCR contains the high-frequency components of the signal, reflecting the rapid changes in the signal in response to a stimulus. In contrast stand SCL, which contains the low-frequency components of the EDA and thus represents the long-term or baseline conductance. Splitting the EDA signal into these two components, the python tool of Greco et al. (Greco et al., 2016) was used.
| Min | Max | Median | Mean | |||
| Number of apps | 18 | 47 | 26 | 30 | ||
| Number of notifications | 363 | 6213 | 1914 | 2362 | ||
|
84.67% | 99.57% | 94.88% | 94.30% | ||
|
65.56% | 97.90% | 84.17% | 83.33% |
5. Understanding the Mood, Usage Behaviours and Notification Response Time of Participants
In total, we have received 3236 ESM responses from participants during the data collection. First, we explore the notification response patterns of different participants. Second, we investigate the relationship between users’ mood and their notification response time. Finally, we explore how mobile usage behaviours are related to notification response time.
5.1. Understanding Notification Response Times for Different Participants
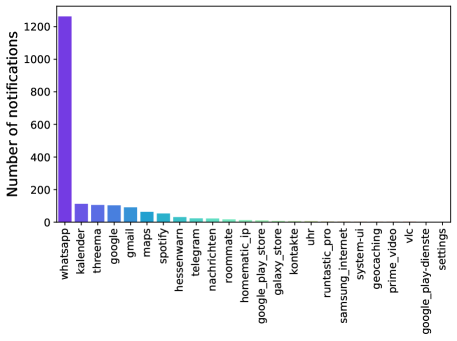
We explore the notification response time from top- apps where = 10 because on average, the top ten apps sent 94.30% of the notifications (out of 2,362 notifications), while the other apps only sent 5.70% of the notifications (see Table 3). If we only study the top five apps, we would miss 16.67% of the notifications, which is almost three times the number of missed notifications from studying the top ten apps. For instance, Figure 4 displays the number of notifications across all the apps for one participant P10 during the data collection. We find that P10 received 96.04% notifications from top ten apps and 86.16% from top five apps. Therefore, in this research, we did not consider the apps receiving only a few notifications ( ¿ 10) because the relatively small dataset would not offer a robust representation of the notification response times for modelling. In real-world scenarios, can be set to any values based on the categories of apps being explored.
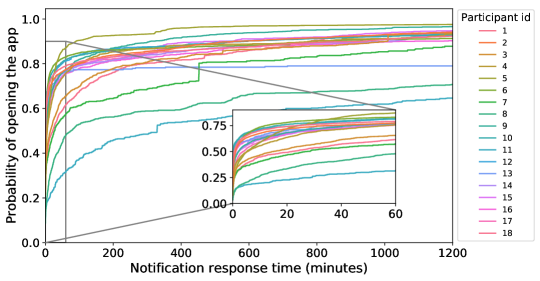
To understand the notification response time for all participants, we show the cumulative distribution of notification response times from top ten apps for each participant in Figure 5. It is obvious that response time to most notifications is short, but the response time of some notifications are long. Specifically, out of 40,290 notifications received by 18 participants, the response time was within five minutes for 54.32% of the notifications, within one hour for 75.86% of the notifications, within one day for 93.90% of the notifications. However, if we look at the response times for different participants, we find that each participant has their own patterns and trends for responding to notifications. For instance, participant P5 responded to 49.37% of their notifications within five minutes and 86.96% within one hour, while participant P11 responded to notifications much more slowly, only responding to 18.46% within five minutes and 32.36% within one hour. Hence, studying the participant-wise notification response time is necessary, as the general model may be inaccurate due to individual differences.
5.2. App Categories and Response Time
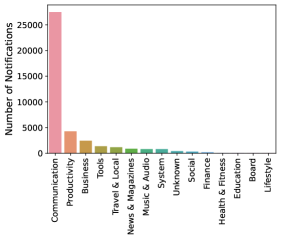
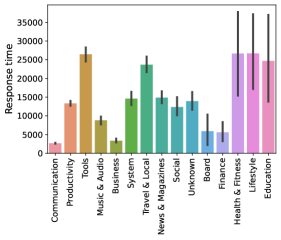
Figure 6(a) displays the number of notifications across the app categories, showing that the communication apps receive much more notifications than all the other app categories. In total, communication apps receives six times more notifications than the app category that was ranked second (i.e. Productivity apps). Figure 6(b) shows the average response times for each app category (black vertical line indicates the error bar, with a 95% confidence interval). Since 93.90% of the notifications from all participants are responded in one day, we focus on analysing those notifications and have removed the notifications with a response time of more than one day. Messages that have not been responded more than 24 hours may be due to various reasons, such as the user forgot, or has already responded on other platforms. We believe that it is more meaningful to focus on the notifications that users reply in a timely manner, and the small number of notifications unanwsered for a long time will be explored in our future research. We find that the response times varied significantly between the app categories. If we aim to predict response time across all categories, the prediction performance would be unreliable due to the extreme variations in the number of notifications and the average notification response time between app categories. Therefore, in this research, we focus on predicting users’ response behaviours for communication apps.
5.3. The Mood of Users and Notification Response time
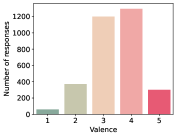
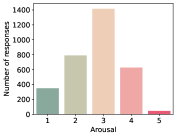
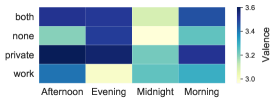
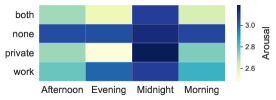
We calculate the overall distribution of mood in Figure 7, where 1 to 5 indicates a low to high value of valence/arousal. Generally, participants usually reported positive valence (mean = 3.44) and low arousal (mean = 2.77), meaning that they were relaxed, clam, and comfortable (Russell, 1980) most of the time. We also explore how the mood is related to factors such as daytime and interruptibility. As shown in Figure 8(a) and Figure 8(b), participants usually experienced the highest valence (mean = 3.56) and lowest arousal (mean = 2.58) in the evening (6pm - 12am). In contrast, they usually experienced the lowest valence (mean = 3.28) and highest arousal (mean = 2.97) in the midnight (12am-6am). We also found that when the participants did not want to be interrupted by either work or private affairs (i.e. interruptibility was ’none’), they were usually experiencing lowest valence (mean = 3.21) and highest arousal(mean = 3.03). Interestingly, when the participants experienced positive mood (high valence), they were more likely to be amenable to interruptions relating to private, or private and work (i.e. both) affairs. In general, the participants experienced varying mood with different levels of interruptiblity at different times.
We also investigate how the mood changed based on social roles and the day of the week (see Figure 9(a) and Figure 9(b)). We found that participants usually experienced high valence (mean = 3.55) and low arousal (mean = 2.67) when they were busy with private issues and tended to experience low valence (mean = 3.31) and high arousal (mean = 2.88) when they were at work. Our participants had the highest valence in the private role on Friday (mean=3.66) and Sunday (mean=3.66) and the lowest valence values (mean=3.25) at work on Saturday. Saturday and Sunday were also different in the arousal scale, as the social roles ’both’ (mean=3.08) and ’work’ (mean=3.22) had the highest values, respectively. Interestingly enough, being in the role of private or both made our participants feel the lowest arousal (mean=2.5) on Sunday.
Mehrotra et al. (Mehrotra et al., 2017) investigated the causal links between users’ emotions and their interactions with mobile phones. They found users’ emotions had a causal impact on mobile phone interactions. In this research, we investigated the relationship between the participants arousal/valence and their notification response times to understand whether human affect (in our case mood) can be used as a proxy for user response behaviours. We computed the Spearman Rank Correlation (de Winter et al., 2016) because the results from the Shapiro-Wilk Test (Razali et al., 2011) and D’Agostino’s Test (d’Agostino, 1971) revealed that none of the samples were normally distributed (p 0.05). We found that both the valence and arousal were significantly correlated with the notification response time: Valence was negatively correlated (r = -0.04, p 0.001) and arousal was positively correlated (r = 0.02, p = 0.012). These results indicate that people usually took longer time to respond to notifications when they are distressed, frustrated or angry (low valence and high arousal). Therefore, we will take into account the influence of valence and arousal in modelling the notification response times in Section 6.


5.4. Impact of Applications on Notification Response Times
We already know that each participant has their own patterns for responding to notifications. However, we also investigate whether each participant respond to different apps in different ways. Here we explore the influence of apps on notification response times. Figure 10 shows the cumulative distribution of the notification response times for five popular apps for participant P10. It clearly shows that even for the same participant, the notification response times vary from app to app. For example, this participant usually responded quickly to whatsapp, gmail and telegram but much more slowly to threema. Specifically, within five minutes, this participant responded to 83.53% of notifications from whatsapp but 53.33% from threema. Therefore, it is necessary to consider the impact of the apps to meaningfully model the notification response times.
6. Experiment
As introduced in Section 3.2, we will only focus on predicting the response times of 18 participants who installed the smartphone app. In this research, we built the regression model for predicting the users’ response time to notifications. Firstly, we introduce the experiment settings and prediction pipeline. Then we show the overall prediction results and study the impact of mood-related features. Lastly, we investigate how individual differences or categories of applications influence the response time.
6.1. Prediction Pipeline
We adopted the regression model for predicting notification response times. The prediction pipeline is described below.
Regressors. In the prediction model, we adopted several commonly used regressors such as Standard Linear Regressor (Seber and Lee, 2012), Support Vector Regressor (SVR) (Cawley and Talbot, 2004), Gradient Booting Regressor (GBR), Randome Forest Regressor (Liaw et al., 2002) and Bayesian Ridge Regressor (Tipping, 2001). Linear regressor is one of the most widely used regression models. The Support Vector Machine (SVM) in regression problems is usually known as SVR, which is one of the most commonly used regression models. The GBR model is a powerful prediction model, and it is an ensemble method combining a set of weak predictors to achieve reliable and accurate predictions. Random Forest Regressor follows the idea of the random forest, and it can estimate the importance of various features in a model. Bayesian Ridge Regressor conducts linear regression using probability distributors rather than point estimates, which provides a natural mechanism to create predictive models when data is insufficient or poorly distributed.
Validation. Cross-validation is a common practice for training and testing prediction models and is used to estimate the unbiased generalisation performance of models. However, cross-validation may lead to the optimistically biased evaluation of prediction performance when the same cross-validation process is chosen to both tune and select the model. Similar to previous ubiquitous computational studies (Gao et al., 2020; Di Lascio et al., 2018), we adopted nested cross-validation (Müller and Guido, 2016), which performs two iterations over the data. The outer loop is used to evaluate the performance of the regressors, and the inner loop is used for optimisation of hyper-parameters and feature selection. After performing this cross-validation, we then applied k-fold cross-validation (k = 5) on both loops for each participant. In the outer loop, once the training set and testing set were defined, we standardised features by removing the mean and scaling the data to unit variance. In the inner loop, we optimised the hyper-parameters using a grid search. We then selected features according to the K highest scores based on f-regression (Pedregosa et al., 2011) (f-value between the label/feature for regression tasks). The top eight features were selected as the input features for each regression model because we found that the this resulted in the lowest prediction error.
Baselines. In human-centred research, it is usually difficult to compare the prediction results with state-of-art baselines. The main reason is that the types of data collected, the demographics of participants and the natural environment vary widely across studies, it is not fair or applicable to compare the prediction performance between different studies. Additionally, to our knowledge, we have not found any research that attempts to predict the notification response time for mobile users. As a result, similar to previous human-centred studies (Gao et al., 2020; Wang et al., 2018), we have adopted simple baselines to compare the modelling performance. In particular, we compare the proposed models with two baselines: Mean baseline and Median baseline. As one of the most widely used simple baselines to compare with other regressors, Mean baseline always predicts the mean of the training set. Median baseline always predicts the median of the training set. The reason why we choose Median baseline is that the distribution of notification response time is highly skewed (see Figure 5), whereas the Median baseline is most informative for skewed distributions or distributions with outliers.
Evaluation Metrics. To evaluate the performance of notification response time, the Mean Absolute Error (MAE) and Root Mean Squared Error (RMSE) metrics are applied for evaluating the prediction performance. The MAE = and RMSE = , where indicates the number of samples, means the actual notification response time and means the predicted response time. The MAE and RMSE describe the goodness of predictions compared with the ground truth of notification response time. The closer the MAE and RMSE are to 0, the better the performance of the prediction model.
6.2. Prediction Result with Mobile Data
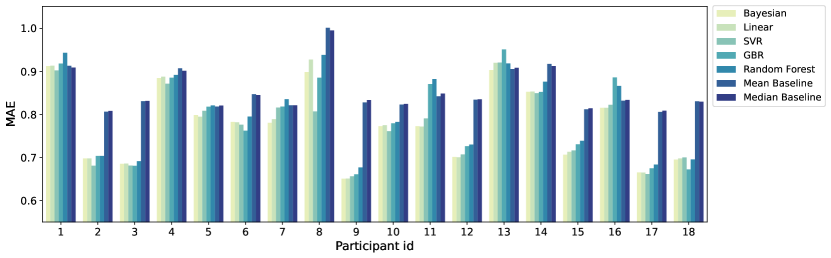
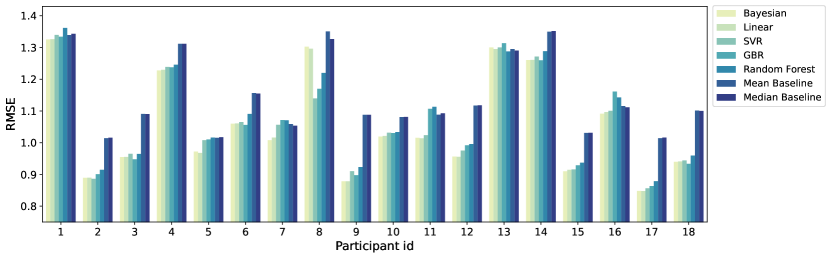
As discussed in Section 5.1, the notification response behaviours were very different between the participants (see Figure 5). Therefore, in the experiment, we built participant-wise regression models instead of a general model for all participants. Figure 11(a) and Figure 11(b) show the MAE and RMSE results across different regressors for each participant. We found that the regression models achieved much better predictive performance than both baselines for most participants (i.e., P2, P3, P9, P12, P17 and P18). For example, for participant P9, the Bayesian regression model had the best predictive performance (MAE = 0.6505 and RMSE = 0.8779), with 0.1828 (21.94%) of MAE and 0.2101 (19.31%) of RMSE lower than the Median baseline model.
However, for some particular participants (e.g., P1 and P13), only a small number of regressors achieved lower MAE and RMSE than the baseline models. The possible reasons why some regressors did not work well on a small number of participants are twofold: (1) The notification response behaviours of these participants were more random and changeable than others, which makes them difficult to predict. These individual differences in mobile usage behaviours have been discussed in prior research (Cassitas Hino and Cunha, 2019). (2) These participants had very different notification response behaviours when using different apps, which is difficult to represent in one regression model. However, it was not practical to build a predictive model for each app due to the limited number of notifications.
Next, we calculated the overall prediction performance for all participants by averaging the MAE and RMSE values from the participant-wise models. Table 4 shows the overall prediction result for all participants. It shows that all regression models had better prediction performance than the two baseline models in terms of MAE and RMSE, demonstrating the models’ potential for predicting notification response time for the ordinary people. The Bayesian model achieved the best prediction performance of all the regression models and obtained the 0.7764 of MAE and 1.0527 of RMSE, which was 0.078 (9.10%) and 0.093 (8.09%) lower than the mean baseline, respectively. Although the overall prediction performance does not sounds particularly good, the prediction performance was very high for most individuals (see Figure 11).
| Bayesian. | Linear. | SVR. | GBR. | R. Forest. | Mean Baseline | Median Baseline | |
|---|---|---|---|---|---|---|---|
| MAE | missing0.7764 | 0.7797 | 0.7770 | 0.7797 | 0.8014 | 0.8541 | 0.8544 |
| RMSE | missing1.0527 | 1.0533 | 1.0601 | 1.066 | 1.0798 | 1.1454 | 1.1441 |
Figure 12 shows the feature importance for each participant, which was calculated using f-regression score in the scikit-learn python package. Higher values indicate more important features. Understanding the importance of a feature is significant in helping us better understand a problem and can lead to better prediction performance through feature selection. In Figure 12, we can see obvious individual differences in feature importance for predicting notification response times. For example, the response time for some participants (e.g., P3, P5 and P15) was significantly affected by location, while some participants’ (e.g., P12 and P13) were not affected by location. Many participants’ response time were influenced by the daytime, workday or not, screen status, relationship with senders or the number of apps used in the past 5, 10, 15, 20, 25, 30 minutes. The above phenomena are in line with our daily experience and may be due to the various personalities or usage habits of mobile users (Westermann et al., 2015; Gao et al., 2019).

6.3. Impact of Mood-related Features
We also explored the impact of mood-related features on predicting notification response times. The mood-related features were divided into two groups: ESM features and E4 features. For ESM features, we mainly focused on the perceived arousal and valence, based on ESM questionnaires. For E4 features, we mainly focused on the features extracted from physiological signals (i.e., EDA, HRV and ACC) from the E4 wristbands.
ESM features. We built regression models with two different sets of features: (1) mobile features and ESM features; (2) mobile features only. Since we only had limited number of ESM responses, we removed the data instances without corresponding arousal and valence values. To achieve a fair comparison, we used the exact same rows of data (8408 data instances) in each of the above two different models. The results of the experiment showed that all the regression models using the second set of features had higher MAE and RMSE values than those using the first set of features, where the MAE/RMSE of baseline models are exactly the same. The findings indicated that the ESM features improved the prediction performance of the model for notification response times.
E4 features. To study the impact of the E4 features, we built regression models with two different sets of features: (1) mobile features and E4 features; (2) mobile features only. After removing the NaN values in the whole dataset, 1491 rows of data instances remained, which were used to build the regression models using the two sets of features, as mentioned above. The results of the experiment showed that most of the regression models (except Bayesian regressor) achieved better prediction performance with the first set of features, i.e. mobile features and E4 features. A possible reason may be the small number of E4 data instances, e.g. participant P11 only had 19 rows of data instances and P9 only had 27 rows of data instances, which makes it difficult to make meaningful predictions.
7. Implications and Limitations
7.1. Implications
This research addressed the relationship between mood and interruptiblity and investigated the possibility of automatically predicting notification response times and actions based on users’ moods. Our research also provides opportunities for the future design of intelligent notification management systems for the mobile or desktop devices, which could benefit the wellbeing and productivity of users. In our paper, we analysed the impact of mood, as measured by ESM questionnaires, and physiological data, as measured by E4 wristbands, on notification response times. We found that affective data can help to improve regression models to assist in the handling of smartphone notifications.
7.2. Limitations
ESM data: One limitation of our study is that some data, such as mood, was gathered using an ESM questionnaire pushed either every 90 minutes or after the user had been using their smartphone usage for 10 min. This kind of questionnaire must be seen as an interruption itself. In addition, the questionnaire popped up on, the smartphone as a notification, which may have caused the participants to interact with their smartphones more often than they would normally have. However, this method of data collection is very common in the field of interruption management, and as the data were used to develop the individual regression models, we believe that these initial results are valuable for further research. We are aware that a follow-up in-the-wild study is needed to validate the models developed.
Mood: Another limitation is the use of the ESM questionnaire to capture the participant’s mood. It is important to note that many people struggle to identify or name their moods correctly (Kreibig, 2010), and the reliability of self-report data can be influenced by various response biases (Gao et al., 2021). To compensate for this weakness, we added physiological signals to the SAM data, which also conveys information about human affective states. Even though these are not free of external influences (e.g. external temperature and physical movement), they form a basis for the research in combination with the ESM data.
Data Distribution: There was minimal diversity in terms of age and gender, and there were only a small number of participants. In particular, the number of participants wearing the E4 wristband needs to be increased in future research to reduce the bias. Additionally, no application for iPhones or other Smartphone OS-Systems than Android was implemented. Likewise, the data were very unbalanced because of the number of different apps used by each participant and the number of notifications (see Figure ). There was significant variation in how the subjects behaved and the apps that they used. Some users interacted frequently with many apps, while some users frequently interacted with a few apps and rarely with many other apps. These factors mainly influenced the results of the regression analysis, making it almost impossible to create a generalised model. After pre-processing, we also recognised that for some participants the quantity of data recorded was very low. This problem can be addressed in future work by measuring more participants and data. First, the users could be clustered according to their app usage behavior patterns. After that, response time prediction models created for the different behavior patterns could follow. This process would also enable a cold start for new users.
8. Conclusion
Understanding the notification response behaviour of users is of vital importance for developing the next-generation mobile management system to improve users’ productivity and well-being in daily lives. In this research, we predict notification response time by understanding people’s mobile usage behaviours, mood, and physiological patterns. We have conducted an in-the-wild study of more than participants with mobile devices and wearables in a five-week data collection. We develop multiple regression models to predict the notification response time for each participant. The experimental results show that the proposed model achieves higher prediction performance than all the baselines. We find that the use of mood data in the form of ESM and physiological signals (e.g., EDA and HRV) improves the prediction significantly. In addition, we identify the most significant features affecting the prediction of notification response time for each participant. Further, we discuss various factors affecting the prediction performance such as the individual differences and categories of applications. Overall, our research showed that the notification response time can be predicted accurately using smartphone data (such as location, application usage,etc.), and the prediction performance can be significantly improved by utilizing mood-related features from ESM data or physiological signals. This result is a significant step toward achieving an attention management system that combines human well-being and behavior.
Acknowledgements.
This research was partly conducted as part of RoboTrust, a project of the Centre Responsible Digitality.References
- (1)
- Anderson et al. (2016) Christoph Anderson, Clara Heissler, Sandra Ohly, and Klaus David. 2016. Assessment of Social Roles for Interruption Management: A New Concept in the Field of Interruptibility. In Proceedings of the 2016 ACM International Joint Conference on Pervasive and Ubiquitous Computing: Adjunct (Heidelberg, Germany) (UbiComp ’16). Association for Computing Machinery, New York, NY, USA, 1530–1535. https://doi.org/10.1145/2968219.2968544
- Ashforth et al. (2000) Blake E. Ashforth, Glen E. Kreiner, and Mel Fugate. 2000. All in a day’s work: Boundaries and micro role transitions. Academy of Management Review 25, 3 (July 2000), 472–491. https://doi.org/10.5465/AMR.2000.3363315
- Bailey et al. (2000) Brian P Bailey, Joseph A Konstan, and John V Carlis. 2000. Measuring the effects of interruptions on task performance in the user interface. In Smc 2000 conference proceedings. 2000 ieee international conference on systems, man and cybernetics.’cybernetics evolving to systems, humans, organizations, and their complex interactions’(cat. no. 0, Vol. 2. IEEE, 757–762.
- Bailey et al. (2001) Brian P Bailey, Joseph A Konstan, and John V Carlis. 2001. The Effects of Interruptions on Task Performance, Annoyance, and Anxiety in the User Interface.. In Interact, Vol. 1. 593–601.
- BRADLEY and LANG (1994) MM BRADLEY and PJ LANG. 1994. Measuring emotion: the Self-Assessment Manikin and the Semantic Differential. Journal of behavior therapy and experimental psychiatry 25, 1 (1994), 49–59.
- Cassitas Hino and Cunha (2019) Marcia Cassitas Hino and Maria Alexandra Cunha. 2019. Study of Individual Differences in the Behavior of Mobile Technology Users in the Context of Urban Mobility. In Proceedings of the 52nd Hawaii International Conference on System Sciences.
- Cawley and Talbot (2004) Gavin C Cawley and Nicola LC Talbot. 2004. Fast exact leave-one-out cross-validation of sparse least-squares support vector machines. Neural networks 17, 10 (2004), 1467–1475.
- Couffe and Michael (2017) Cyril Couffe and George A Michael. 2017. Failures due to interruptions or distractions: A review and a new framework. American journal of psychology 130, 2 (2017), 163–181.
- Dabbish et al. (2011) Laura Dabbish, Gloria Mark, and Víctor M. González. 2011. Why Do I Keep Interrupting Myself?: Environment, Habit and Self-interruption. In Proceedings of the SIGCHI Conference on Human Factors in Computing Systems (CHI ’11). ACM, New York, NY, USA, 3127–3130. https://doi.org/10.1145/1978942.1979405
- d’Agostino (1971) Ralph B d’Agostino. 1971. An omnibus test of normality for moderate and large size samples. Biometrika 58, 2 (1971), 341–348.
- de Winter et al. (2016) Joost CF de Winter, Samuel D Gosling, and Jeff Potter. 2016. Comparing the Pearson and Spearman correlation coefficients across distributions and sample sizes: A tutorial using simulations and empirical data. Psychological methods 21, 3 (2016), 273.
- Di Lascio et al. (2018) Elena Di Lascio, Shkurta Gashi, and Silvia Santini. 2018. Unobtrusive assessment of students’ emotional engagement during lectures using electrodermal activity sensors. Proceedings of the ACM on Interactive, Mobile, Wearable and Ubiquitous Technologies 2, 3 (2018), 1–21.
- Exler et al. (2016) Anja Exler, Marcel Braith, Andrea Schankin, and Michael Beigl. 2016. Preliminary investigations about interruptibility of smartphone users at specific place types. In Proceedings of the 2016 ACM international joint conference on pervasive and ubiquitous computing: Adjunct. 1590–1595.
- Fischer et al. (2010) J. E. Fischer, N. Yee, V. Bellotti, N. Good, S. Benford, and C. Greenhalgh. 2010. Effects of Content and Time of Delivery on Receptivity to Mobile Interruptions. In Proceedings of the 12th International Conference on Human Computer Interaction with Mobile Devices and Services (MobileHCI ’10). ACM, New York, NY, USA, 103–112. https://doi.org/10.1145/1851600.1851620
- Fortin et al. (2019) Pascal E. Fortin, Elisabeth Sulmont, and Jeremy Cooperstock. 2019. Detecting Perception of Smartphone Notifications Using Skin Conductance Responses. In Proceedings of the 2019 CHI Conference on Human Factors in Computing Systems (Glasgow, Scotland Uk) (CHI ’19). Association for Computing Machinery, New York, NY, USA, 1–9. https://doi.org/10.1145/3290605.3300420
- Gao et al. (2021) Nan Gao, Mohammad Saiedur Rahaman, Wei Shao, and Flora D Salim. 2021. Investigating the Reliability of Self-report Data in the Wild: The Quest for Ground Truth. In Adjunct Proceedings of the 2021 ACM International Joint Conference on Pervasive and Ubiquitous Computing and Proceedings of the 2021 ACM International Symposium on Wearable Computers. 237–242.
- Gao et al. (2020) Nan Gao, Wei Shao, Mohammad Saiedur Rahaman, and Flora D Salim. 2020. n-Gage: Predicting in-class Emotional, Behavioural and Cognitive Engagement in the Wild. Proceedings of the ACM on Interactive, Mobile, Wearable and Ubiquitous Technologies 4, 3 (2020), 1–26.
- Gao et al. (2019) Nan Gao, Wei Shao, and Flora D Salim. 2019. Predicting personality traits from physical activity intensity. Computer 52, 7 (2019), 47–56.
- Garbarino et al. (2014) Maurizio Garbarino, Matteo Lai, Dan Bender, Rosalind W Picard, and Simone Tognetti. 2014. Empatica E3—A wearable wireless multi-sensor device for real-time computerized biofeedback and data acquisition. In 2014 4th International Conference on Wireless Mobile Communication and Healthcare-Transforming Healthcare Through Innovations in Mobile and Wireless Technologies (MOBIHEALTH). IEEE, 39–42.
- Greco et al. (2016) Alberto Greco, Gaetano Valenza, Antonio Lanata, Enzo Scilingo, and Luca Citi. 2016. cvxEDA: a Convex Optimization Approach to Electrodermal Activity Processing. IEEE Transactions on Biomedical Engineering (2016), 1–1. https://doi.org/10.1109/TBME.2015.2474131
- Heinisch et al. (2019) Judith Heinisch, Christoph Anderson, and Klaus David. 2019. Angry or Climbing Stairs? Towards Physiological Emotion Recognition in the Wild. In Proceedings of the 2019 IEEE International Conference on Pervasive Computing and Communications Workshops. IEEE, Kyoto, Japan.
- Hektner et al. (2007) Joel Hektner, Jennifer Schmidt, and Mihaly Csikszentmihalyi. 2007. Experience Sampling Method. SAGE Publications, Inc., Thousand Oaks, CA, USA. https://doi.org/10.4135/9781412984201
- Ho and Intille (2005) Joyce Ho and Stephen S. Intille. 2005. Using Context-aware Computing to Reduce the Perceived Burden of Interruptions from Mobile Devices. In Proceedings of the SIGCHI Conference on Human Factors in Computing Systems (CHI ’05). ACM, New York, NY, USA, 909–918. https://doi.org/10.1145/1054972.1055100
- Kaur et al. (2020) Harmanpreet Kaur, Alex C. Williams, Daniel McDuff, Mary Czerwinski, Jaime Teevan, and Shamsi T. Iqbal. 2020. Optimizing for Happiness and Productivity: Modeling Opportune Moments for Transitions and Breaks at Work. In Proceedings of the 2020 CHI Conference on Human Factors in Computing Systems (CHI ’20). Association for Computing Machinery, New York, NY, USA, 1–15. https://doi.org/10.1145/3313831.3376817
- Khan et al. (2021) Aftab Khan, Alexandros Zenonos, Georgios Kalogridis, Yaowei Wang, Stefanos Vatsikas, and Mahesh Sooriyabandara. 2021. Perception Clusters: Automated Mood Recognition Using a Novel Cluster-Driven Modelling System. ACM Transactions on Computing for Healthcare 2, 1 (Jan. 2021), 1–16. https://doi.org/10.1145/3422819
- Kim et al. (2015) SeungJun Kim, Jaemin Chun, and Anind K Dey. 2015. Sensors know when to interrupt you in the car: Detecting driver interruptibility through monitoring of peripheral interactions. In Proceedings of the 33rd Annual ACM Conference on Human Factors in Computing Systems. 487–496.
- Kreibig (2010) Sylvia D. Kreibig. 2010. Autonomic nervous system activity in emotion: A review. Biological Psychology 84, 3 (July 2010), 394–421. https://doi.org/10.1016/j.biopsycho.2010.03.010
- Lee et al. (2019) Hao-Ping Lee, Kuan-Yin Chen, Chih-Heng Lin, Chia-Yu Chen, Yu-Lin Chung, Yung-Ju Chang, and Chien-Ru Sun. 2019. Does Who Matter?: Studying the Impact of Relationship Characteristics on Receptivity to Mobile IM Messages. In Proceedings of the 2019 CHI Conference on Human Factors in Computing Systems (CHI ’19). ACM, New York, NY, USA, 526:1–526:12. https://doi.org/10.1145/3290605.3300756 event-place: Glasgow, Scotland Uk.
- Levenson (1988) Robert W Levenson. 1988. Emotion and the autonomic nervous system: A prospectus for research on autonomic specificity. Social psychophysiology: Theory and clinical applications (1988), 17–42.
- Liaw et al. (2002) Andy Liaw, Matthew Wiener, et al. 2002. Classification and regression by randomForest. R news 2, 3 (2002), 18–22.
- Mehrotra et al. (2016a) Abhinav Mehrotra, Robert Hendley, and Mirco Musolesi. 2016a. PrefMiner: Mining User’s Preferences for Intelligent Mobile Notification Management. In Proceedings of the 2016 ACM International Joint Conference on Pervasive and Ubiquitous Computing (UbiComp ’16). ACM, New York, NY, USA, 1223–1234. https://doi.org/10.1145/2971648.2971747
- Mehrotra et al. (2015) Abhinav Mehrotra, Mirco Musolesi, Robert Hendley, and Veljko Pejovic. 2015. Designing Content-driven Intelligent Notification Mechanisms for Mobile Applications. In Proceedings of the 2015 ACM International Joint Conference on Pervasive and Ubiquitous Computing (UbiComp ’15). ACM, New York, NY, USA, 813–824. https://doi.org/10.1145/2750858.2807544
- Mehrotra et al. (2016b) Abhinav Mehrotra, Veljko Pejovic, Jo Vermeulen, Robert Hendley, and Mirco Musolesi. 2016b. My Phone and Me: Understanding People’s Receptivity to Mobile Notifications. In Proceedings of the 2016 CHI Conference on Human Factors in Computing Systems (CHI ’16). ACM, New York, NY, USA, 1021–1032. https://doi.org/10.1145/2858036.2858566
- Mehrotra et al. (2017) Abhinav Mehrotra, Fani Tsapeli, Robert Hendley, and Mirco Musolesi. 2017. MyTraces: Investigating correlation and causation between users’ emotional states and mobile phone interaction. Proceedings of the ACM on Interactive, Mobile, Wearable and Ubiquitous Technologies 1, 3 (2017), 1–21.
- Miyata and Norman (1986) Yoshiro Miyata and Donald A. Norman. 1986. Psychological issues in support of multiple activities. In User centered system design: New perspectives on human-computer interaction, Donald A. Norman and S. W. Draper (Eds.). Lawrence Erlbaum, Hillsdale, N.J. USA, 265–284.
- Müller and Guido (2016) Andreas C Müller and Sarah Guido. 2016. Introduction to machine learning with Python: a guide for data scientists. ” O’Reilly Media, Inc.”.
- Nippert-Eng (1996) Christena E. Nippert-Eng. 1996. Home and Work: Negotiating Boundaries through Everyday Life. University of Chicago Press, 60th Street, Chicago, IL, USA.
- Okoshi et al. (2015a) Tadashi Okoshi, Julian Ramos, H. Nozaki, Jin Nakazawa, Anind K. Dey, and Hideyuki Tokuda. 2015a. Attelia: Reducing User’s Cognitive Load due to Interruptive Notifications on Smart Phones. In 2015 IEEE International Conference on Pervasive Computing and Communications. IEEE, St. Louis, MO, USA, 96–104. https://doi.org/10.1109/PERCOM.2015.7146515
- Okoshi et al. (2015b) Tadashi Okoshi, Julian Ramos, H. Nozaki, Jin Nakazawa, Anind K. Dey, and Hideyuki Tokuda. 2015b. Reducing Users’ Perceived Mental Effort Due to Interruptive Notifications in Multi-device Mobile Environments. In Proceedings of the 2015 ACM International Joint Conference on Pervasive and Ubiquitous Computing (UbiComp ’15). ACM, New York, NY, USA, 475–486. https://doi.org/10.1145/2750858.2807517
- Okoshi et al. (2017) Tadashi Okoshi, Kota Tsubouchi, Masaya Taji, Takanori Ichikawa, and Hideyuki Tokuda. 2017. Attention and Engagement-Awareness in the Wild: A Large-Scale Study with Adaptive Notifications. In 2017 IEEE International Conference on Pervasive Computing and Communications (PerCom). IEEE, Big Island, HI, USA, 100–110. https://doi.org/10.1109/PERCOM.2017.7917856
- Okoshi et al. (2019) Tadashi Okoshi, Kota Tsubouchi, and Hideyuki Tokuda. 2019. Real-World Product Deployment of Adaptive Push Notification Scheduling on Smartphones. In Proceedings of the 25th ACM SIGKDD International Conference on Knowledge Discovery & Data Mining (KDD ’19). ACM, Anchorage AK USA, 2792–2800. https://doi.org/10.1145/3292500.3330732
- Ozenc and Farnham (2011) Fatih Kursat Ozenc and Shelly D. Farnham. 2011. Life ”Modes” in Social Media. In Proceedings of the SIGCHI Conference on Human Factors in Computing Systems (Vancouver, BC, Canada) (CHI ’11). Association for Computing Machinery, New York, NY, USA, 561–570. https://doi.org/10.1145/1978942.1979022
- Pedregosa et al. (2011) Fabian Pedregosa, Gaël Varoquaux, Alexandre Gramfort, Vincent Michel, Bertrand Thirion, Olivier Grisel, Mathieu Blondel, Peter Prettenhofer, Ron Weiss, Vincent Dubourg, et al. 2011. Scikit-learn: Machine learning in Python. the Journal of machine Learning research 12 (2011), 2825–2830.
- Pejovic and Musolesi (2014) Veljko Pejovic and Mirco Musolesi. 2014. InterruptMe: Designing Intelligent Prompting Mechanisms for Pervasive Applications. In Proceedings of the 2014 ACM International Joint Conference on Pervasive and Ubiquitous Computing (UbiComp ’14). ACM, New York, NY, USA, 897–908. https://doi.org/10.1145/2632048.2632062
- Perlow (1999) Leslie A Perlow. 1999. The time famine: Toward a sociology of work time. Administrative science quarterly 44, 1 (1999), 57–81.
- Razali et al. (2011) Nornadiah Mohd Razali, Yap Bee Wah, et al. 2011. Power comparisons of shapiro-wilk, kolmogorov-smirnov, lilliefors and anderson-darling tests. Journal of statistical modeling and analytics 2, 1 (2011), 21–33.
- Renaud et al. (2006) Karen Renaud, Judith Ramsay, and Mario Hair. 2006. ” You’ve got e-mail!”… shall I deal with it now? Electronic mail from the recipient’s perspective. International Journal of Human-Computer Interaction 21, 3 (2006), 313–332.
- Russell (1980) James A Russell. 1980. A circumplex model of affect. Journal of personality and social psychology 39, 6 (1980), 1161.
- Saikia et al. (2017) Prasanta Saikia, Ming Cheung, James She, and Soochang Park. 2017. Effectiveness of Mobile Notification Delivery. In 2017 18th IEEE International Conference on Mobile Data Management (MDM). IEEE, Daejeon, South Korea, 21–29. https://doi.org/10.1109/MDM.2017.14
- Scherer (2005) Klaus R Scherer. 2005. What are emotions? And how can they be measured? Social science information 44, 4 (2005), 695–729.
- Seber and Lee (2012) George AF Seber and Alan J Lee. 2012. Linear regression analysis. Vol. 329. John Wiley & Sons.
- Shirazi et al. (2014) Alireza Sahami Shirazi, Niels Henze, Tilman Dingler, Martin Pielot, Dominik Weber, and Albrecht Schmidt. 2014. Large-scale Assessment of Mobile Notifications. In Proceedings of the SIGCHI Conference on Human Factors in Computing Systems (CHI ’14). ACM, Toronto, Ontario, Canada, 3055–3064. https://doi.org/10.1145/2556288.2557189
- Tipping (2001) Michael E Tipping. 2001. Sparse Bayesian learning and the relevance vector machine. Journal of machine learning research 1, Jun (2001), 211–244.
- Trafton et al. (2003) J Gregory Trafton, Erik M Altmann, Derek P Brock, and Farilee E Mintz. 2003. Preparing to resume an interrupted task: Effects of prospective goal encoding and retrospective rehearsal. International Journal of Human-Computer Studies 58, 5 (2003), 583–603.
- van Berkel et al. (2017) Niels van Berkel, Denzil Ferreira, and Vassilis Kostakos. 2017. The Experience Sampling Method on Mobile Devices. ACM Comput. Surv. 50, 6, Article 93 (Dec. 2017), 40 pages. https://doi.org/10.1145/3123988
- van Berkel et al. (2019) Niels van Berkel, Jorge Goncalves, Lauri Lovén, Denzil Ferreira, Simo Hosio, and Vassilis Kostakos. 2019. Effect of experience sampling schedules on response rate and recall accuracy of objective self-reports. International Journal of Human-Computer Studies 125 (2019), 118 – 128. https://doi.org/10.1016/j.ijhcs.2018.12.002
- Visuri et al. (2019) Aku Visuri, Niels van Berkel, Tadashi Okoshi, Jorge Goncalves, and Vassilis Kostakos. 2019. Understanding smartphone notifications’ user interactions and content importance. International Journal of Human-Computer Studies 128 (Aug. 2019), 72–85. https://doi.org/10.1016/j.ijhcs.2019.03.001
- Wang et al. (2018) Weichen Wang, Gabriella M Harari, Rui Wang, Sandrine R Müller, Shayan Mirjafari, Kizito Masaba, and Andrew T Campbell. 2018. Sensing behavioral change over time: Using within-person variability features from mobile sensing to predict personality traits. Proceedings of the ACM on Interactive, Mobile, Wearable and Ubiquitous Technologies 2, 3 (2018), 1–21.
- Weber et al. (2019) Dominik Weber, Alexandra Voit, and Niels Henze. 2019. Clear All: A Large-Scale Observational Study on Mobile Notification Drawers. In Proceedings of Mensch und Computer 2019 (MuC’19). Association for Computing Machinery, Hamburg, Germany, 361–372. https://doi.org/10.1145/3340764.3340765
- Westermann et al. (2015) Tilo Westermann, Sebastian Möller, and Ina Wechsung. 2015. Assessing the relationship between technical affinity, stress and notifications on smartphones. In proceedings of the 17th international conference on human-computer interaction with mobile devices and services adjunct. 652–659.
- Westermann et al. (2016) Tilo Westermann, Ina Wechsung, and Sebastian Möller. 2016. Smartphone Notifications in Context: a Case Study on Receptivity by the Example of an Advertising Service. In Proceedings of the 2016 CHI Conference Extended Abstracts on Human Factors in Computing Systems. ACM, San Jose California USA, 2355–2361. https://doi.org/10.1145/2851581.2892383
- Yuan et al. (2017) Fengpeng Yuan, Xianyi Gao, and Janne Lindqvist. 2017. How Busy Are You?: Predicting the Interruptibility Intensity of Mobile Users. In Proceedings of the 2017 CHI Conference on Human Factors in Computing Systems (CHI ’17). ACM, Denver, Colorado, USA, 5346–5360. https://doi.org/10.1145/3025453.3025946
- Zijlstra et al. (1999) Fred R. H. Zijlstra, Robert A. Roe, Anna B. Leonora, and Irene Krediet. 1999. Temporal factors in mental work: Effects of interrupted activities. Journal of Occupational and Organizational Psychology 72, 2 (1999), 163–185. https://doi.org/10.1348/096317999166581
- Züger et al. (2018) Manuela Züger, Sebastian C. Müller, André N. Meyer, and Thomas Fritz. 2018. Sensing Interruptibility in the Office: A Field Study on the Use of Biometric and Computer Interaction Sensors. In Proceedings of the 2018 CHI Conference on Human Factors in Computing Systems (CHI ’18). ACM, New York, NY, USA, 591:1–591:14. https://doi.org/10.1145/3173574.3174165