Bayesian Modeling of Language-Evoked Event-Related Potentials
Abstract
Bayesian hierarchical models are well-suited to analyzing the often noisy data from electroencephalography experiments in cognitive neuroscience: these models provide an intuitive framework to account for structures and correlations in the data, and they allow a straightforward handling of uncertainty. In a typical neurolinguistic experiment, event-related potentials show only very small effect sizes and frequentist approaches to data analysis fail to establish the significance of some of these effects. Here, we present a Bayesian approach to analyzing event-related potentials using as an example data from an experiment which relates word surprisal and neural response. Our model is able to estimate the effect of word surprisal on most components of the event-related potential and provides a richer description of the data. The Bayesian framework also allows easier comparison between estimates based on surprisal values calculated using different language models.
Keywords: Natural language processing; Neurolinguistics; Bayesian modeling; ERP; EEG; Hierarchical models
Introduction
Electroencephalography (EEG) is a non-invasive technique used to investigate the cognitive processes underlying language comprehension. In neurolinguistics, it is common to work with event-related potentials (ERP), which are time-locked brain responses measured for a specific stimulus, such as a word. As an example, in a study of the response to the information conveyed by words Dambacher \BOthers. (\APACyear2006), it was observed that particularly surprising words affect the N400 component, the negative potential deflection peaking around 400 ms post-stimulus onset.
ERP data are usually analyzed using frequentist methods, such as traditional Broderick \BOthers. (\APACyear2018) or mixed-effect Frank \BOthers. (\APACyear2015) linear models, or using neural networks Schwartz \BBA Mitchell (\APACyear2019). Although these approaches are well-established and efficient, it is difficult to include prior beliefs for effect magnitudes or correlation structures, uncertainty is not explicitly quantified and they tie statistical modeling to an often intricate or misleading hypothesis-testing framework.
Here, we propose a Bayesian analysis of ERP data, using the data described in \citeAFrank2015 as an example. We show that a full Bayesian treatment not only replicates results from traditional statistics in a more elegant and data-efficient way, but it also supports the inclusion of insights from neurolinguistics and the structure of the experiment itself. Previous work employing Bayesian approaches focused on the relationship between cloze probability and just one component, the N400 Nicenboim \BOthers. (\APACyear2022).
Methodology
In this example, we used openly available data previously described in \citeAFrank2015. ERPs were estimated from EEG recordings from 24 participants reading 205 sentences, corresponding to 1931 words; these stimulus sentences are orthographically and grammatically correct. Words were tagged for their part-of-speech (POS) using the Universal Tagset Petrov \BOthers. (\APACyear2012) and divided in content (nouns, verbs, adjectives, adverbs) and function (any other POS tag) words. The six ERP components investigated in this study are ELAN, LAN, P600, generally considered markers of syntactic processing, and EPNP, PNP, N400, well-known markers of semantic processing. N or P indicate negativity or positivity with respect to the pre-stimulus onset baseline.
Surprisal to the information conveyed by a word given the preceding words is
| (1) |
The surprisal values can be estimated using any probabilistic language model (LM) for . We used surprisal values from -grams, as computed by \citeAFrank2015 with ; we also calculated surprisal estimates from an LSTM and a transformer. The LSTM Hochreiter \BBA Schmidhuber (\APACyear1997) had two hidden layers and was trained on the WikiText-2 Corpus Merity \BOthers. (\APACyear2016) with an LM objective. The transformer was the causal LM GPT-2 Radford \BOthers. (\APACyear2018), pre-trained by processing input left-to-right.
| A | B | C |
|
|
|
We modeled ERP data with a hierarchical Bayesian model. Unlike \citeAFrank2015, data from all the ERP components were analyzed together in a single model. The analysis was treated as a regression problem, with standardized surprisal as the predictor and ERP amplitude as the response variable. The likelihood was given a normal distribution, centered at a mean estimated using a varying-coefficient linear model:
| (2) | ||||
where is an item index, , and map from item to participant, word type and ERP component and is the regression error, which has a weakly informative half-Cauchy prior. By-subject, by-word-type and by-ERP-component random effects were given multivariate normal (MVN) priors, with a correlation structure across regression coefficients. An LKJ prior was chosen for their covariance matrices. The same effects could have been included into a frequentist mixed-effect model. However, a Bayesian analysis allows the formulation of priors informed by domain knowledge: for example, the effect means were given tight normal priors centered at zero that reflect the expected small amplitudes of these contributions.
The posterior was sampled with the No-U-Turn Sampler Hoffman \BBA Gelman (\APACyear2014), using the probabilistic library PyMC v.4b Salvatier \BOthers. (\APACyear2015) in Python 3.9. We sampled four chains for samples and used a non-centered parameterization for the MVN priors.
Results
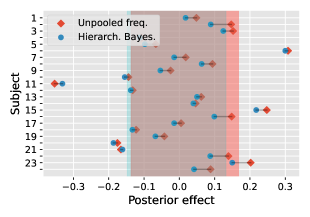
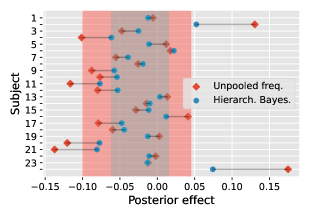
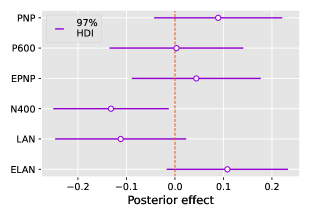
The posterior distributions for the model fitted on -gram surprisal values are illustrated in Fig. 1. One of the immediate effects of using a hierarchical model is that estimates are closer to the population mean than estimates from an unpooled model: this is evident for by-subject effects in Fig. 1A. Shrinkage is a desirable feature when working with noisy data, as it makes the model more robust to outliers.
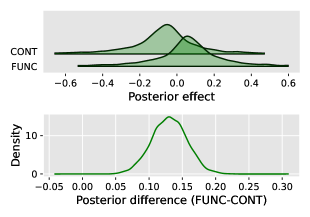
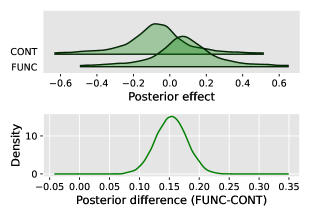
By including by-word-type effects, it is easy to see that there is a difference in the response for content and function words, as shown in Fig. 1B. This is evident without the need to refit the model on each of the two word types individually, as done by \citeAFrank2015. The response to content words is negative, consistent with a N400 effect.
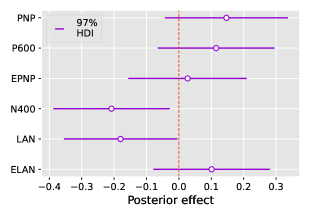
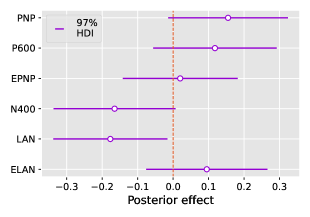
Our model estimates non-zero amplitudes for the N400, LAN and, with less certainty, the PNP, P600 and ELAN components, as illustrated in Fig. 1C. Our average coefficients for the N400 are comparable to those reported in \citeAFrank2015, which are and for -grams and a recurrent LM respectively. The polarity of the components is respected by all the models, with the exception of ELAN, which is estimated to be a positive component. The difficulty in estimating the amplitude of ELAN may be due to the absence of syntactic violations in the stimuli Friederici (\APACyear2011). The model fitted on GPT-2 surprisal values gives even more density to ELAN being a positive component, but it favors a near-zero amplitude for P600.
Models fitted on the surprisal values from the three LMs were evaluated using leave-one-out (LOO) cross-validation with Pareto smoothing Vehtari \BOthers. (\APACyear2017). The comparison revealed that, taking into account the uncertainty in LOO estimation, no LM’s surprisal outperforms the others: this may indicate that even simpler LMs can be used to estimate word information values. Moreover, they all lead to similar results as those illustrated in Fig. 1. All the models converge satisfactorily, with an upper-bound for R-hat of .
Discussion
We presented a Bayesian approach to modeling ERP data from neurolinguistics experiments, using data reported in \citeAFrank2015 as motivation. Our model estimates the amplitudes of more ERP components than the original study, that could only predict the N400, and it also describes the data at different levels. Additional experiments, not included here, confirm that our approach can establish the same results with a subset of the subjects or words.
The main limitation of the outlined approach is the increased computational time: sampling the posterior took around six hours on four CPUs with GPU acceleration. This could be partly improved by better investigating the geometry of the posterior and using alternative parametrizations. Additional prior predictive checks could also be beneficial. In future, we aim to extend the model so that it estimates the event-related EEG directly, rather than individual components which have been calculated by binning and averaging across electrodes: this would allow us to capture information at electrode level. This approach can be extended to other word properties and sources of data, such as magnetoencephalography.
Acknowledgments
We thank Cian O’Donnell and Sydney Dimmock for useful feedback. DT is funded by an EPSRC Centre of Doctoral Training grant (EP/S022937/1) and CH is a Leverhulme Research Fellow (RF-2021-533). This work was carried out using the HPC facilities of the ACRC, University of Bristol.
References
- Broderick \BOthers. (\APACyear2018) \APACinsertmetastarBroderick2018{APACrefauthors}Broderick, M\BPBIP., Anderson, A\BPBIJ., Liberto, G\BPBIM\BPBID., Crosse, M\BPBIJ.\BCBL \BBA Lalor, E\BPBIC. \APACrefYearMonthDay20183. \BBOQ\APACrefatitleElectrophysiological Correlates of Semantic Dissimilarity Reflect the Comprehension of Natural, Narrative Speech Electrophysiological correlates of semantic dissimilarity reflect the comprehension of natural, narrative speech.\BBCQ \APACjournalVolNumPagesCurrent Biology28803-809.e3. {APACrefDOI} \doi10.1016/J.CUB.2018.01.080 \PrintBackRefs\CurrentBib
- Dambacher \BOthers. (\APACyear2006) \APACinsertmetastarDAMBACHER200689{APACrefauthors}Dambacher, M., Kliegl, R., Hofmann, M.\BCBL \BBA Jacobs, A\BPBIM. \APACrefYearMonthDay2006. \BBOQ\APACrefatitleFrequency and predictability effects on event-related potentials during reading Frequency and predictability effects on event-related potentials during reading.\BBCQ \APACjournalVolNumPagesBrain Research1084189-103. {APACrefDOI} \doihttps://doi.org/10.1016/j.brainres.2006.02.010 \PrintBackRefs\CurrentBib
- Frank \BOthers. (\APACyear2015) \APACinsertmetastarFrank2015{APACrefauthors}Frank, S\BPBIL., Otten, L\BPBIJ., Galli, G.\BCBL \BBA Vigliocco, G. \APACrefYearMonthDay20151. \BBOQ\APACrefatitleThe ERP response to the amount of information conveyed by words in sentences The ERP response to the amount of information conveyed by words in sentences.\BBCQ \APACjournalVolNumPagesBrain and Language1401-11. {APACrefDOI} \doi10.1016/J.BANDL.2014.10.006 \PrintBackRefs\CurrentBib
- Friederici (\APACyear2011) \APACinsertmetastarFriederici2011{APACrefauthors}Friederici, A\BPBID. \APACrefYearMonthDay201110. \BBOQ\APACrefatitleThe brain basis of language processing: From structure to function The brain basis of language processing: From structure to function.\BBCQ \APACjournalVolNumPagesPhysiological Reviews911357-1392. {APACrefDOI} \doi10.1152/physrev.00006.2011 \PrintBackRefs\CurrentBib
- Hochreiter \BBA Schmidhuber (\APACyear1997) \APACinsertmetastarHochreiter1997{APACrefauthors}Hochreiter, S.\BCBT \BBA Schmidhuber, J. \APACrefYearMonthDay199711. \BBOQ\APACrefatitleLong Short-Term Memory Long Short-Term Memory.\BBCQ \APACjournalVolNumPagesNeural Computation91735-1780. {APACrefDOI} \doi10.1162/NECO.1997.9.8.1735 \PrintBackRefs\CurrentBib
- Hoffman \BBA Gelman (\APACyear2014) \APACinsertmetastarHoffman2014{APACrefauthors}Hoffman, M\BPBID.\BCBT \BBA Gelman, A. \APACrefYearMonthDay2014. \BBOQ\APACrefatitleThe No-U-Turn Sampler: Adaptively Setting Path Lengths in Hamiltonian Monte Carlo The No-U-Turn Sampler: Adaptively setting path lengths in Hamiltonian Monte Carlo.\BBCQ \APACjournalVolNumPagesJournal of Machine Learning Research151593-1623. \PrintBackRefs\CurrentBib
- McElreath (\APACyear2020) \APACinsertmetastarMcElreath2020{APACrefauthors}McElreath, R. \APACrefYear2020. \APACrefbtitleStatistical Rethinking. A Bayesian Course with Examples in R and Stan. Second Edition. Statistical Rethinking. A Bayesian Course with Examples in R and Stan. Second Edition. \APACaddressPublisherCRC Press. \PrintBackRefs\CurrentBib
- Merity \BOthers. (\APACyear2016) \APACinsertmetastarMerity2016{APACrefauthors}Merity, S., Xiong, C., Bradbury, J.\BCBL \BBA Socher, R. \APACrefYearMonthDay20169. \BBOQ\APACrefatitlePointer Sentinel Mixture Models Pointer sentinel mixture models.\BBCQ \APACjournalVolNumPages5th International Conference on Learning Representations, ICLR 2017 - Conference Track Proceedings. {APACrefDOI} \doi10.48550/arxiv.1609.07843 \PrintBackRefs\CurrentBib
- Nicenboim \BOthers. (\APACyear2022) \APACinsertmetastarNicenboim2022{APACrefauthors}Nicenboim, B., Shad, D.\BCBL \BBA Vasishth, S. \APACrefYearMonthDay2022. \BBOQ\APACrefatitleAn Introduction to Bayesian Data Analysis for Cognitive Science An introduction to Bayesian data analysis for cognitive science.\BBCQ. {APACrefURL} \urlhttps://vasishth.github.io/bayescogsci/book/ \PrintBackRefs\CurrentBib
- Petrov \BOthers. (\APACyear2012) \APACinsertmetastarpetrov-etal-2012-universal{APACrefauthors}Petrov, S., Das, D.\BCBL \BBA McDonald, R. \APACrefYearMonthDay2012\APACmonth05. \BBOQ\APACrefatitleA Universal Part-of-Speech Tagset A universal part-of-speech tagset.\BBCQ \BIn \APACrefbtitleProceedings of the Eighth International Conference on Language Resources and Evaluation (LREC’12) Proceedings of the eighth international conference on language resources and evaluation (LREC’12) (\BPGS 2089–2096). \APACaddressPublisherIstanbul, TurkeyEuropean Language Resources Association (ELRA). \PrintBackRefs\CurrentBib
- Radford \BOthers. (\APACyear2018) \APACinsertmetastarRadford2018{APACrefauthors}Radford, A., Wu, J., Child, R., Luan, D., Amodei, D.\BCBL \BBA Sutskever, I. \APACrefYearMonthDay2018. \APACrefbtitleLanguage Models are Unsupervised Multitask Learners. Language models are unsupervised multitask learners. {APACrefURL} \urlhttps://github.com/openai/gpt-2 \PrintBackRefs\CurrentBib
- Salvatier \BOthers. (\APACyear2015) \APACinsertmetastarSalvatier2015{APACrefauthors}Salvatier, J., Wiecki, T\BPBIV.\BCBL \BBA Fonnesbeck, C. \APACrefYearMonthDay20157. \BBOQ\APACrefatitleProbabilistic Programming in Python using PyMC Probabilistic programming in Python using PyMC.\BBCQ \APACjournalVolNumPagesPeerJ Computer Science2016. {APACrefDOI} \doi10.48550/arxiv.1507.08050 \PrintBackRefs\CurrentBib
- Schwartz \BBA Mitchell (\APACyear2019) \APACinsertmetastarSchwartz2019{APACrefauthors}Schwartz, D.\BCBT \BBA Mitchell, T. \APACrefYearMonthDay20194. \BBOQ\APACrefatitleUnderstanding language-elicited EEG data by predicting it from a fine-tuned language model Understanding language-elicited EEG data by predicting it from a fine-tuned language model.\BBCQ \APACjournalVolNumPagesNAACL HLT 2019 - 2019 Conference of the North American Chapter of the Association for Computational Linguistics: Human Language Technologies - Proceedings of the Conference143-57. {APACrefDOI} \doi10.18653/v1/N19-1005 \PrintBackRefs\CurrentBib
- van de Schoot \BOthers. (\APACyear2021) \APACinsertmetastarPrimer{APACrefauthors}van de Schoot, R., Depaoli, S., King, R., Kramer, B., Märtens, K., Tadesse, M\BPBIG.\BDBLYau, C. \APACrefYearMonthDay20211. \BBOQ\APACrefatitleBayesian statistics and modelling Bayesian statistics and modelling.\BBCQ \APACjournalVolNumPagesNature Reviews Methods Primers 2021 1:111-26. {APACrefDOI} \doi10.1038/s43586-020-00001-2 \PrintBackRefs\CurrentBib
- Vehtari \BOthers. (\APACyear2017) \APACinsertmetastarVehtari2017{APACrefauthors}Vehtari, A., Gelman, A.\BCBL \BBA Gabry, J. \APACrefYearMonthDay20179. \BBOQ\APACrefatitlePractical Bayesian model evaluation using leave-one-out cross-validation and WAIC Practical Bayesian model evaluation using leave-one-out cross-validation and WAIC.\BBCQ \APACjournalVolNumPagesStatistics and Computing271413-1432. {APACrefDOI} \doi10.1007/S11222-016-9696-4/FIGURES/12 \PrintBackRefs\CurrentBib
Appendix A Supplementary material111Not included in the version of the paper accepted at CCN 2022.
Data and Code Availability
The EEG and ERP data, as well as the -gram surprisal values, were taken from \citeAFrank2015 and are openly available333\urlhttps://ars.els-cdn.com/content/image/1-s2.0-S0093934X15001182-mmc1.zip. The code for performing the Bayesian analysis and reproducing the images on this paper is also available on GitHub444\urlhttps://github.com/davideturco/BayesERPs.
Additional Results
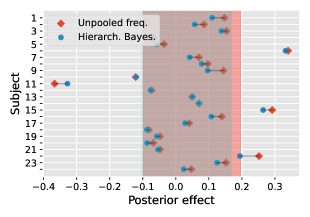
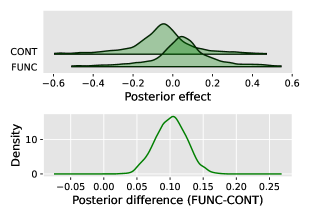
The posterior distributions for the models fitted on LSTM and GPT-2 surprisal values are illustrated in Fig. 2 and 3 respectively. Overall, results are similar to -gram effects shown in Fig. 1, although smaller in magnitude for the model fitted on GPT-2 surprisal values. Moreover, by looking at the by-ERP-component posterior effect estimates for this LM (Fig. 3F), it appears that the model may be unable to distinguish between the negativities N400 and LAN, as well as the positivities P600 and EPNP.
| A | B | C |
|
|
|
| D | E | F |
|
|
|
Diagnostics and Model Comparison
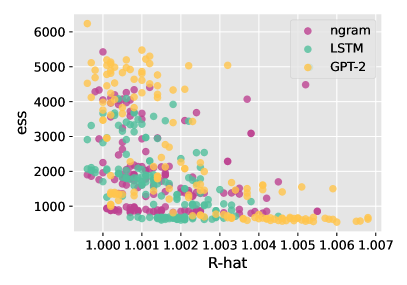
The quality of sampling is evaluated with two common diagnostic criteria: R-hat and effective sample size (ess). The former is a measure of convergence of the chains to a stationary distribution, whereas the latter corresponds to the effective number of samples in terms of autocorrelation McElreath (\APACyear2020); van de Schoot \BOthers. (\APACyear2021). Usually, convergence and sampling are deemed satisfactory when R-hat is below and ess above of the number of samples drawn. As shown in Fig. 4, the model successfully converges when fitted on the surprisal values from all the three LMs investigated.
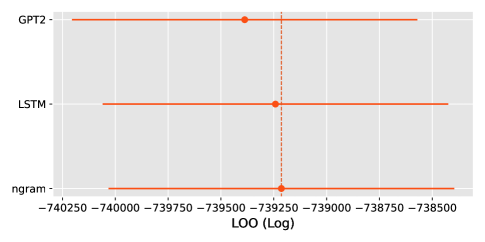
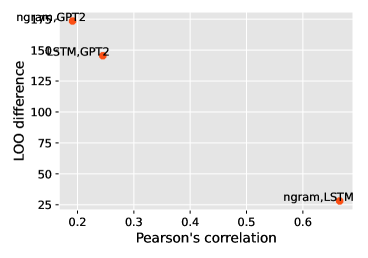
Although this work concerns statistical inference on effect magnitudes, for reference we include results of model comparison analysis based on LOO cross-validation with Pareto smoothing. Comparison results are illustrated in Fig. 5A: the model fitted on the three LMs show almost identical out-of-sample predictive performances. Moreover, Fig. 5B shows that small differences in LOO between the model fitted on different surprisal values are inversely proportional to the Pearson’s correlation between the surprisal values from the three LMs, as expected.
| A | B |
|
|