Boosting the interpretability of clinical risk scores with intervention predictions
Abstract.
Machine learning systems show significant promise for forecasting patient adverse events via risk scores. However, these risk scores implicitly encode assumptions about future interventions that the patient is likely to receive, based on the intervention policy present in the training data. Without this important context, predictions from such systems are less interpretable for clinicians. We propose a joint model of intervention policy and adverse event risk as a means to explicitly communicate the model’s assumptions about future interventions. We develop such an intervention policy model on MIMIC-III, a real world de-identified ICU dataset, and discuss some use cases that highlight the utility of this approach. We show how combining typical risk scores, such as the likelihood of mortality, with future intervention probability scores leads to more interpretable clinical predictions.
1. Introduction
The digitization of medical data has created many opportunities for machine learning systems to empower clinicians and improve medical care (Ghassemi et al., 2020). One key area of interest is the use of predictive models to quantify risk of mortality or deterioration, broadly referred to as acuity. Most established patient acuity scores depend on a small number of physiological risk factors determined through consensus of various medical bodies, e.g. APACHE (Knaus et al., 1991), SOFA (Vincent et al., 1996), and SAPS II (Le Gall et al., 1993). In recent years, deep learning-based frameworks have improved upon the accuracy of these scores by replacing simple risk factors with a wider breadth of patterns that are not as easily detectable by human clinicians (Shickel et al., 2017).
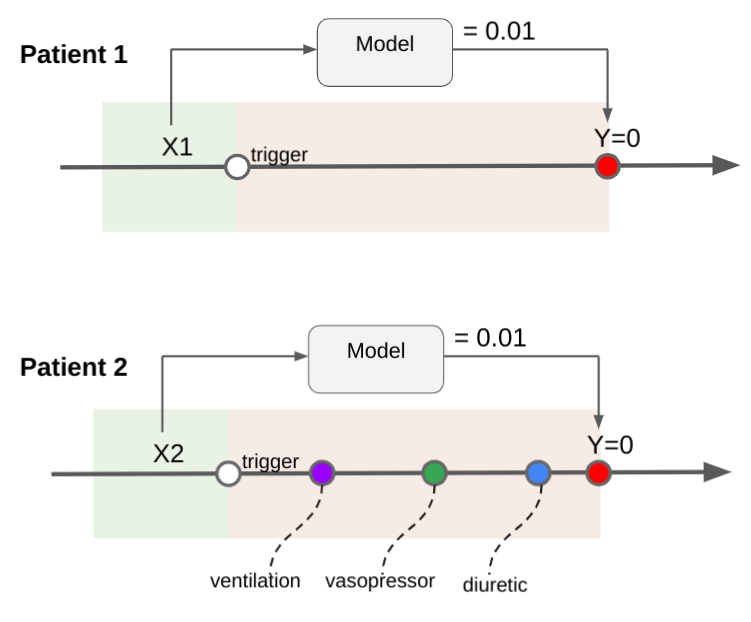
While more powerful risk scores are promising, critical deployment challenges remain, including interpretability (Kelly et al., 2019). Most clinical interpretability methods are aimed at explaining how input features influence model predictions, but these explanations fail to communicate an important piece of clinical context: the model’s implicit, learned assumptions about likely future interventions given a patient’s current state. Fig. 1 visualizes the problem of two equivalently low risk predictions being predicated upon completely different presumed intervention trajectories, which cannot be communicated in a standalone acuity score. Such implicit assumptions have been shown to negatively impact model behavior in real-world deployment scenarios. For example, (Caruana et al., 2015) discusses a case in which a model trained to produce mortality risk scores for pneumonia patients learns to ascribe lower risk to patients with asthma, when in fact the opposite should be true. This behavior is explained by the fact that asthma patients receive more aggressive and effective interventions than other patients. This case highlights the need for interpretability beyond simple feature attribution, in which the assumptions about future interventions are made clearer.
In this work, we demonstrate that communicating intervention assumptions in addition to the patient’s future risk has the potential to improve interpretability and increase trust among end users considering said risk scores in care planning. In order to demonstrate the utility of this risk score contextualization, we develop a recurrent multitask neural network which simultaneously predicts the likelihood of both mortality and a collection of relevant clinical interventions. We evaluate this approach on the MIMIC-III dataset and highlight examples in which the additional context of future intervention probabilities can enable a machine learning system to produce more interpretable predictions for clinicians.
2. Related Work
It is well known that patient risk is highly dependent on intervention. (Lenert et al., 2019) simulated adverse event label drift in response to changing intervention, and recommend incorporating intervention predictions as a solution, which we explore further in this work. (van Geloven et al., 2019) formally defined a unified endpoint combining adverse events and interventions after baseline. Rather than change the definition of the risk being predicted, we seek to use predictions of future interventions to better contextualize this risk.
We are by no means the first to propose the prediction of multiple clinical interventions. (Ghassemi et al., 2019) employed a switching state space model to represent patient states and evaluated the performance of learned states in prediction of five ICU treatments. (Suresh et al., 2017) integrated multiple EHR data sources and used the learned representation to predict onset and weaning of five interventions. (Wang et al., 2020) built a pipeline to extract continuous intervention signals for ventilators, vassopressors, and fluid therapies. We extend upon previous intervention prediction tasks (i.e., to thirteen interventions) and specifically demonstrate how such predictions can be used to increase the interpretability of patient acuity scores.
There have been many efforts to improve the interpretability of clinical machine learning systems. (Payrovnaziri et al., 2020) provide a comprehensive overview of previous work. Most of these techniques focus on attributing model outputs to individual features, or to clinical concepts (e.g. (Mincu et al., 2021)). We diverge from this work by communicating the model’s implicit assumptions about future events that may have a causal relationship with the predicted endpoint.
3. Data and Label Description
Data We used MIMIC-III (Johnson et al., 2016) for our experiments. MIMIC-III is a publicly available dataset that includes the de-identified electronic health records (EHRs) of 53,423 patients admitted to critical care units at the Beth Israel Deaconess Medical Center from 2001 to 2012. We selected the study cohort based on three inclusion criteria: (1) the patient was at least 15 years old at the time of admission; (2) following (Wang et al., 2020), we only considered each patient’s first ICU stay to prevent possible information leakage; (3) the total duration of the ICU stay was between 2 and 14 days. The final cohort included 18,335 ICU stays and was randomly split into training (80%), validation (10%), and test (10%). Table C.3 describes the cohort demographics.
Label description We focused on the early prediction of interventions as auxiliary tasks, jointly trained with in-ICU mortality prediction. All predictions are binary classification tasks that use all historical information up to and including the first 24 hours of a patient’s first ICU stay, and a prediction horizon that extends to the end of that same ICU stay. We targeted 13 commonly used interventions in ICU, including ICU medications (e.g., vasopressors), fluid boluses (e.g., crystalloid bolus), transfusions (e.g., RBC transfusion), and mechanical ventilation. To the best of our knowledge, no other work has included as many simultaneous intervention prediction tasks. Definitions of interventions were based on the SQL queries available in the MIMIC-III codebase (Johnson et al., 2018) and the item IDs of corresponding concepts were reviewed and modified with clinical guidance where appropriate (see Appdx. A for detailed definitions). The in-ICU mortality label was derived using the “DEATHTIME” included in the MIMIC-III “ADMISSION” table. A half-hour tolerance period was added to the “OUTTIME” in the “ICUSTAYS” table to account for patients who died within the 30 minutes of ICU discharge. Table C.4 shows the prevalence of in-ICU mortality as well as all the intervention labels split by train, validation, and test data sets.
4. Methodology
4.1. Baseline Models
We built two logistic regression models based on features used in SOFA and SAPS-II, respectively. The SOFA baseline model included six predictors that measure the rates of failure of six organ systems. The SAPS-II baseline model included seventeen variables, including routine physiological measurements, comorbidity, and admission status. Both SOFA and SAPS-II scores are commonly used to estimate the probability of mortality for ICU patients. In this study, we investigate their effectiveness in proposed prediction tasks, including both mortality and intervention predictions.
4.2. LSTM-based multi-label learning model
We extended an open-source implementation111https://github.com/google/ehr-predictions of the LSTM-based mortality predictive model from (Tomašev et al., 2021) to incorporate multi-label intervention prediction tasks as defined in Sec. 3. The model used a version of MIMIC-III mapped to the Fast Healthcare Interoperability Resource (FHIR) standard as described in (Rajkomar et al., 2018). Every patient’s record was represented as a collection of timestamped events with an associated clinical code and, where applicable, a value. We obtained the feature representation from FHIR resources as described in (Roy et al., 2021).
Loss Function We employed a multi-label learning approach to train the model . A patient’s input tensor is fed through a sparse embedding layer followed by an LSTM (Hochreiter and Schmidhuber, 1997) module parameterized by . The output vector of the LSTM (i.e., hidden patient representation) is then shared across fourteen different classification heads, each of which is parameterized by . We used binary cross-entropy as the loss function for each classification task and minimize their sum to train the entire network. The complete loss function is:
where is the number of training samples and is the total number of classification tasks. In our experiments, which includes one in-ICU mortality prediction task and thirteen intervention prediction tasks. For implementation details, we refer the reader to Appdx. B.
5. Experiments and Results
We first present quantitative results, then show both aggregate and individual use cases that demonstrate the benefits of pairing mortality prediction with intervention predictions. All experimental results are based on the held out test set.
5.1. Model Results and Comparison
| Task | AUROC | AUPRC | ||||
|---|---|---|---|---|---|---|
| SOFA | SAPS II | LSTM | SOFA | SAPS II | LSTM | |
| In-ICU Mortality | ||||||
| Vasopressors | ||||||
| Inotropes | ||||||
| Sedation | ||||||
| Analgesic | ||||||
| Anticoagulation | ||||||
| Diuretic | ||||||
| Paralytic | ||||||
| Colloid Bolus | ||||||
| Crystalloid Bolus | ||||||
| FFP Transfusion | ||||||
| RBC Transfusion | ||||||
| Ventilation | ||||||
| Antibiotic |
We evaluated the model using AUROC and AUPRC scores and present the values in Tab. 1. We find that, compared to the baseline models using severity score features, the LSTM-based model yields improvements on most intervention predictions, except for two (paralytic, FFP transfusion) with very low label prevalence. We also find that compared to the prediction of in-ICU mortality, four intervention predictions have higher AUROC scores and eight have higher AUPRC scores, suggesting that these predictions can offer more specific and reliable signals for predicting patient needs than a mortality risk score.
| Interventions | Precision at | ||
|---|---|---|---|
| SOFA | SAPS II | LSTM | |
We evaluated the model’s capability of ranking the most relevant interventions for each patient. We grouped patients by the number of interventions (denoted as ) that they received and evaluated our model with Precision@ metrics, which is the proportion of top predicted interventions that are in the patient’s recorded intervention set. Tab. 2 shows that our LSTM-based model yields fairly high retrieval precision, with mean values , at all levels, and compares favorably to baseline models.
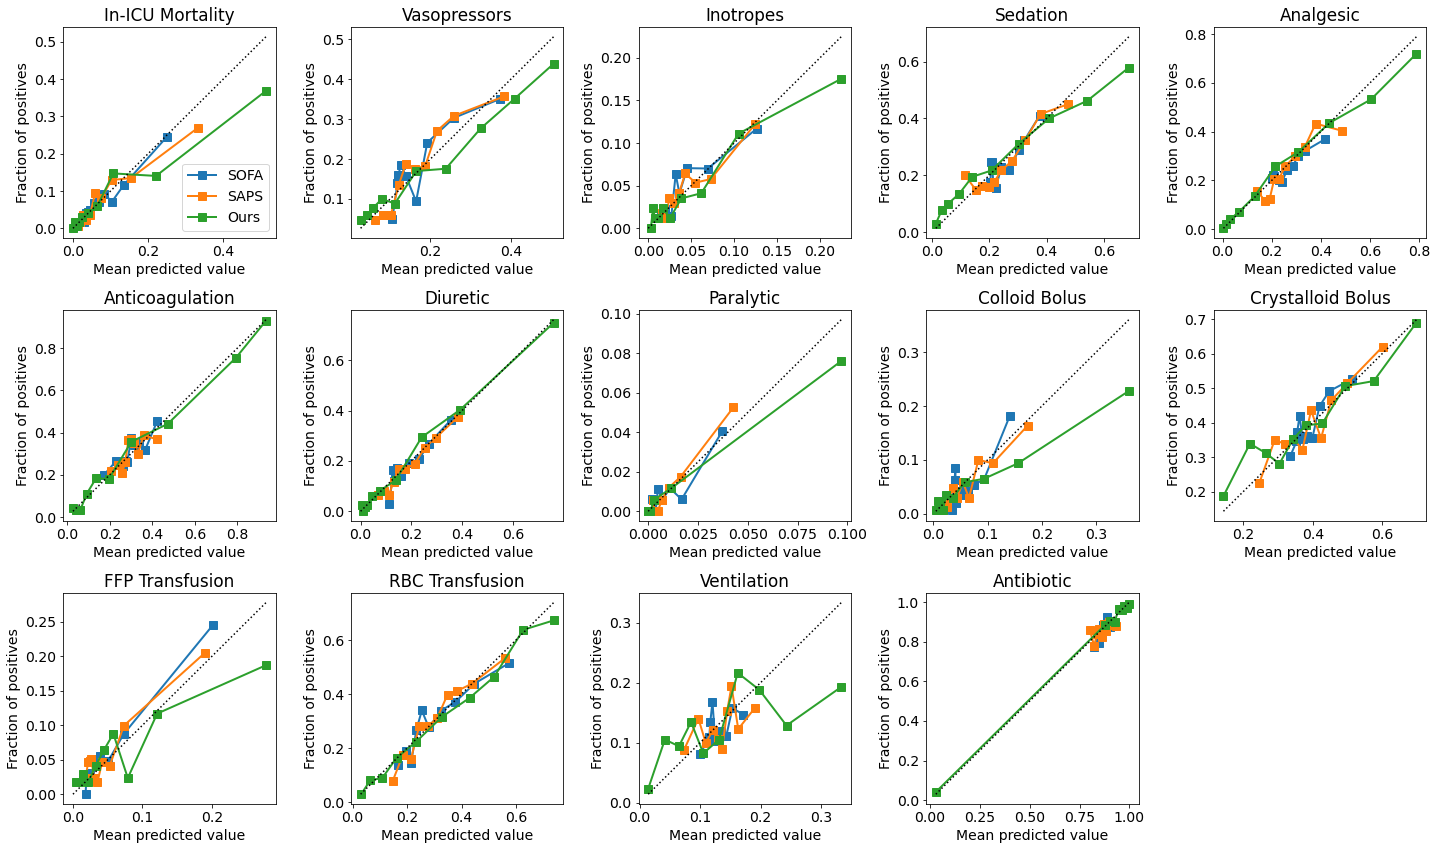
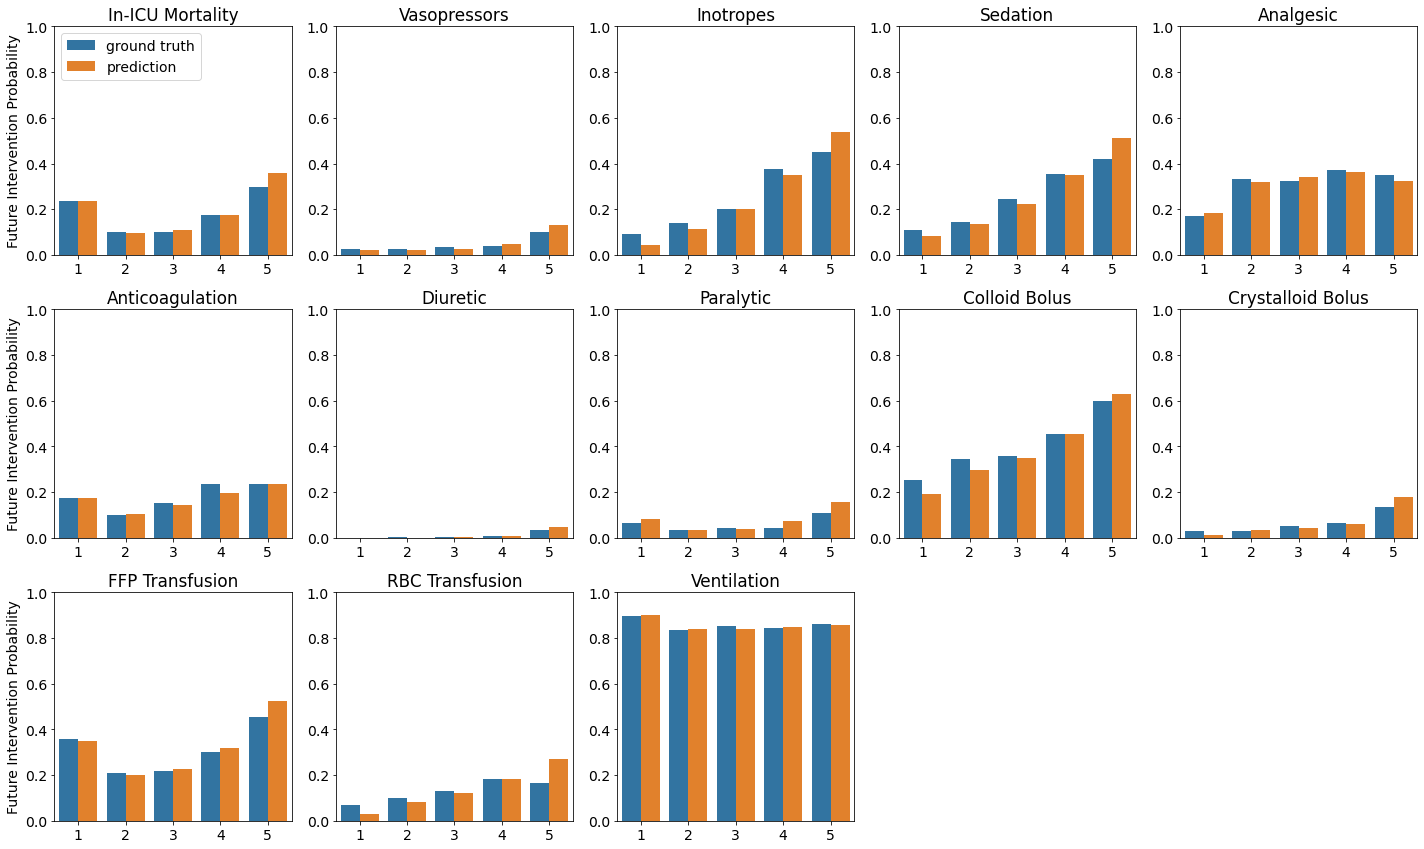
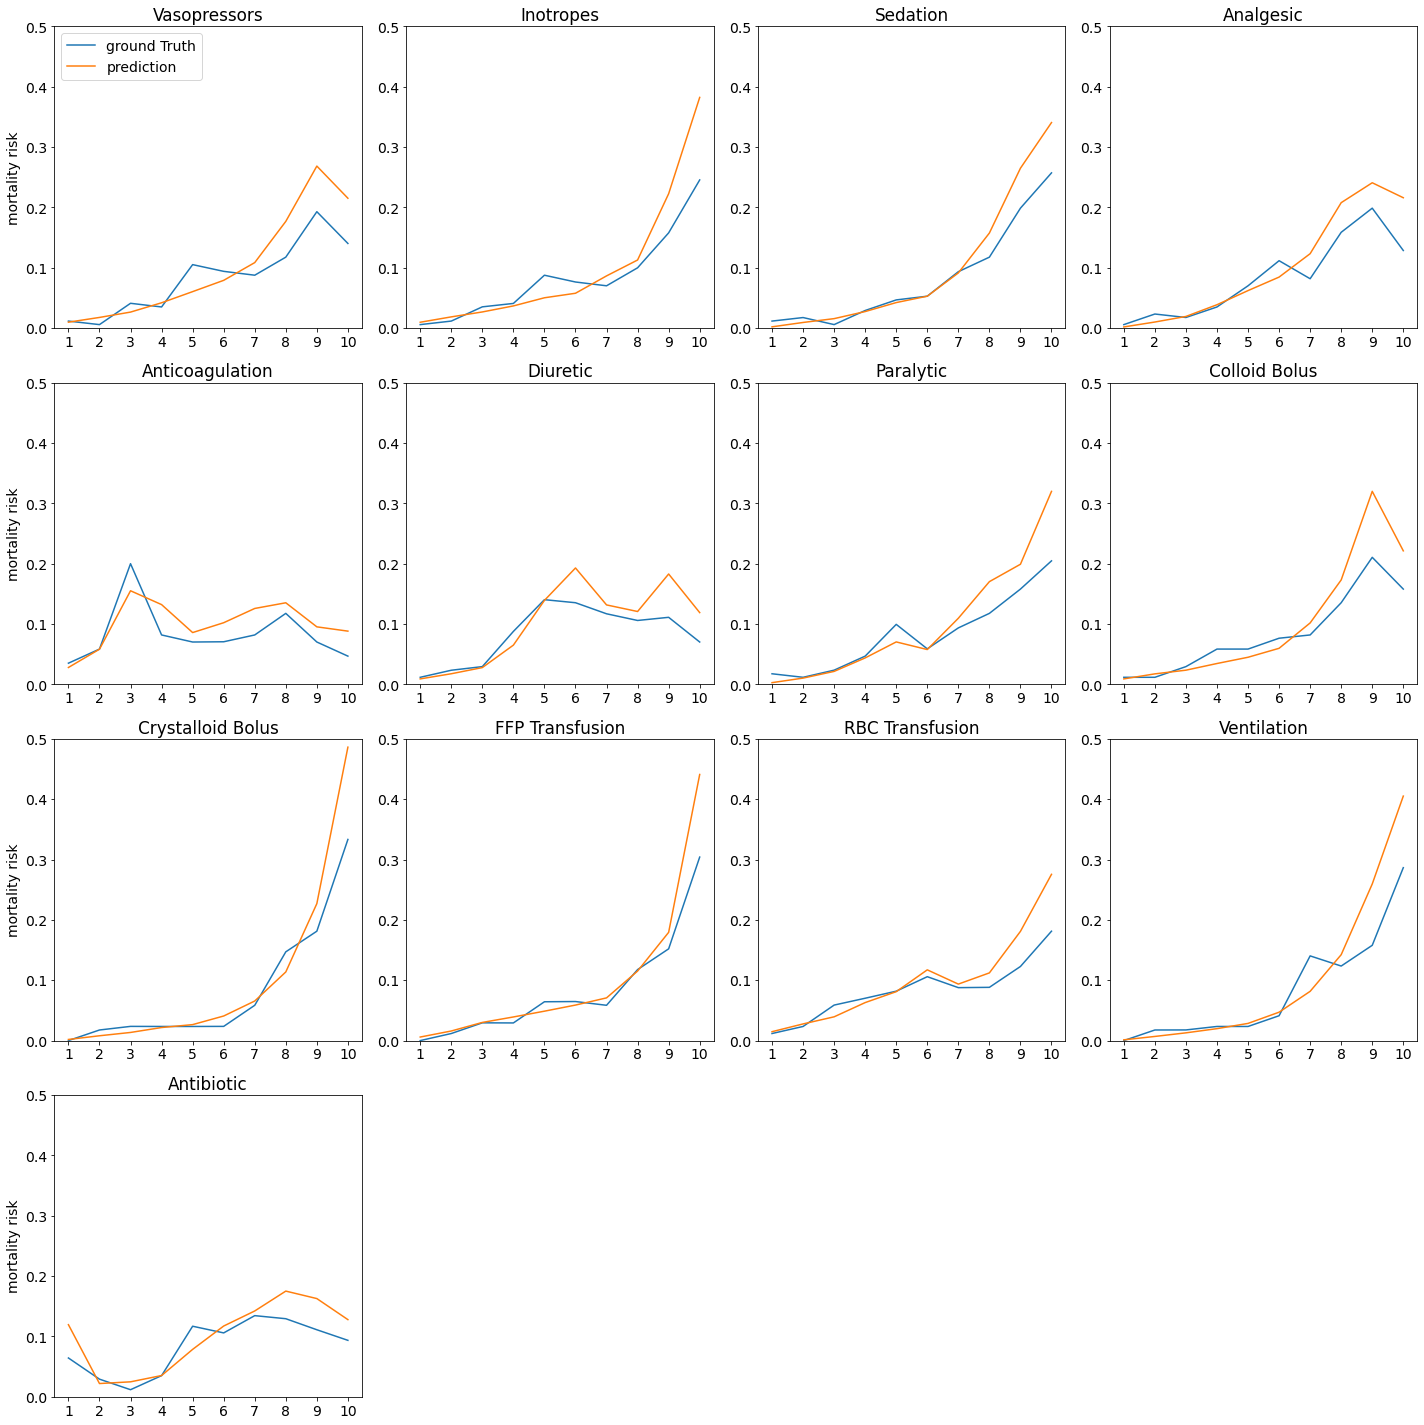
We also evaluated the models for calibration performance and for the relationship between in-ICU mortality prediction and intervention predictions. We present these results in Appdx. D.
5.2. Use Cases
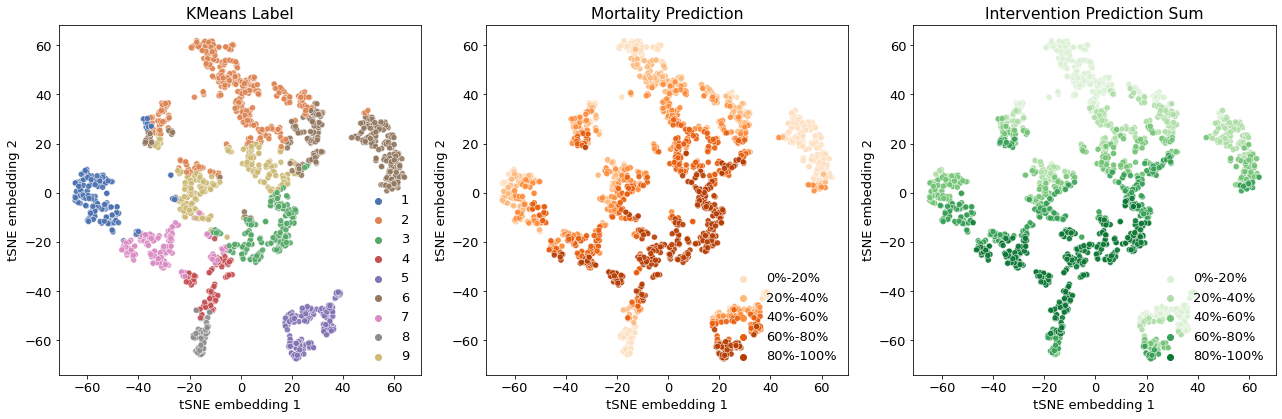
Cluster analysis: We created a t-SNE (Laurens and Hinton, 2008) plot using the thirteen intervention predictions of the LSTM-based model as inputs to obtain the 2D t-SNE embedding. Fig. 2 shows the same t-SNE plot labeled by three different categorical variables: K-means cluster assignment using the entire future intervention probability vector, quantile group of predicted mortality risk, and quantile group of total predicted intervention score.
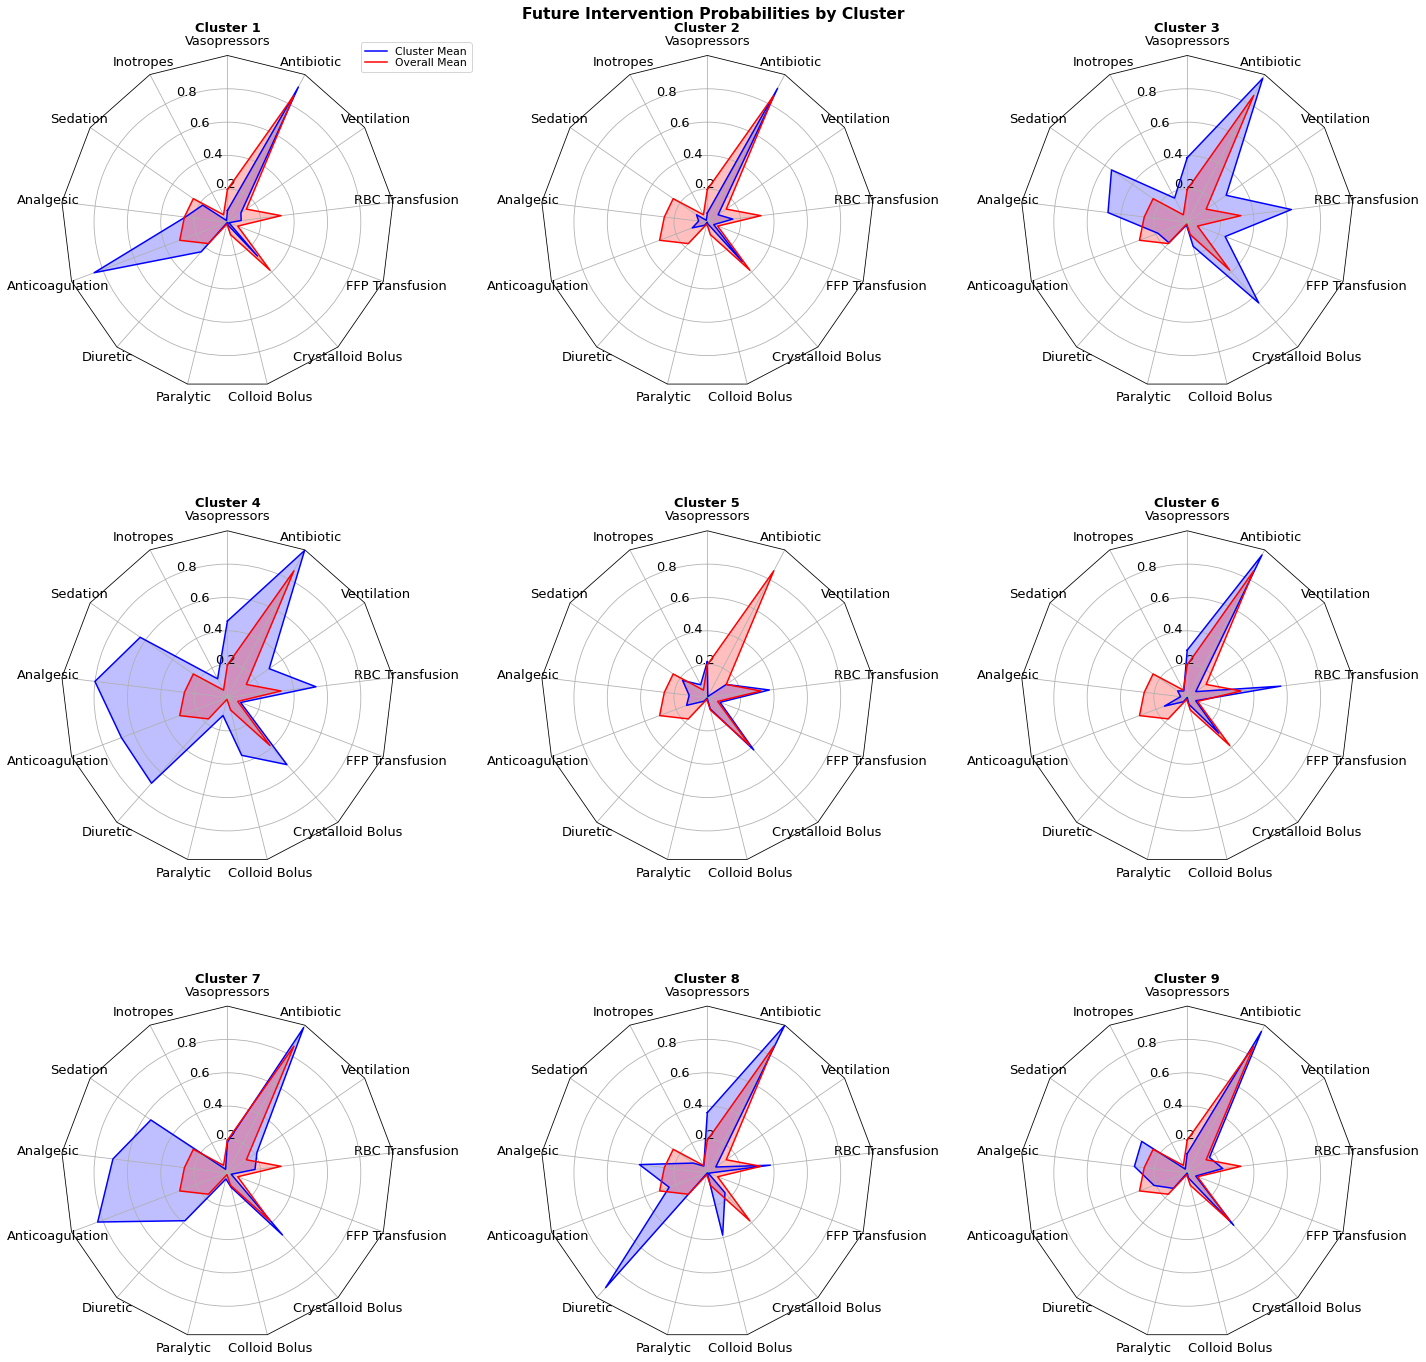
Cluster 8 (left panel, grey points at bottom) in Fig. 2 represents a set of patients who have low predicted mortality risk (center panel, light red) but require extensive medical interventions (right panel, dark green). Upon clinical review, we identified these patients as cardiothoracic surgery patients (coronary artery bypass grafts (CABG), valve replacements, etc.) receiving post-surgical care. Fig. D.7 shows that patients in cluster 8 were more likely to receive diuretics to prevent fluid overload and antibiotics to manage post-surgical infection, but were less likely to be sedated or ventilated in the ICU. These predictions indicate to the clinician that the patient risk score they are viewing is already predicated on this future post-surgical trajectory, without which, risk may have been much higher.
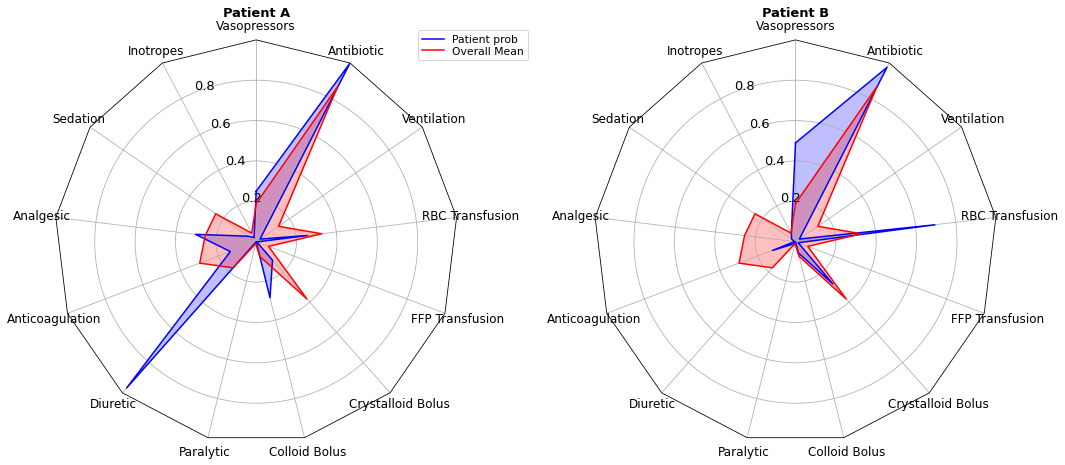
Patient trajectories: To illustrate the potential of intervention forecasting to boost interpretability at the patient level, we selected two patients (A and B) with similar risk scores but differing intervention predictions. Both were 80-85 year old males admitted to the ICU after multi-vessel CABG; both were extubated on day 1 post-operatively with 24h risk scores in the bottom tenth percentile. Fig. 3 shows that despite similar risk, Patient A had a higher probability of receiving diuretics, whereas Patient B had a significantly higher probability of requiring transfusion, crystalloid bolus and vasopressors. This forecast matches the differing ICU trajectories of these patients. While patient A’s admission was complicated by tachycardia and hypertension, patient B had a more complicated admission requiring a post-op transfusion, vasopressors after a hypotensive episode, chemical cardioversion and anticoagulation for new atrial fibrillation, and intravenous antibiotics for phlebitis. These additional signals indicate to the clinician that the very similar risk scores for these two similar patients are actually predicated on distinct clinical trajectories.
6. Conclusion and Future Work
In this work, we demonstrate ways in which modeling intervention policy can improve the interpretability of clinical risk scores. Providing this context has the potential to increase confidence and trust as well as improve inter-provider variability in practice through personalized patient forecasts. This interpretability technique is applicable to any prediction task in which the predictions depend on future actions which may have a causal relationship with the target endpoint. It is especially critical to communicate these assumptions when the consumer of the predictions is also implicated in these future actions.
In future work, we hope to expand upon the findings presented here by applying our policy model to health environments beyond the ICU, such as in general inpatient hospital wards or in the outpatient setting. The heterogeneity of care trajectories is wider in these settings, and so the potential ambiguity regarding patient risk forecasts is amplified. In addition to expanding to new datasets, we would like to explore a number of improvements to the quality and granularity of our intervention policy models, such as shifting to continuous predictions and increasing the number and sophistication of intervention patterns forecasted. It will also be imperative to conduct user testing with clinicians to determine clinical benefit and potential for integration into real-world workflows.
References
- (1)
- Caruana et al. (2015) Rich Caruana, Yin Lou, Johannes Gehrke, Paul Koch, Marc Sturm, and Noemie Elhadad. 2015. Intelligible Models for HealthCare: Predicting Pneumonia Risk and Hospital 30-Day Readmission. In Proceedings of the 21th ACM SIGKDD International Conference on Knowledge Discovery and Data Mining (KDD ’15). Association for Computing Machinery, New York, NY, USA, 1721–1730. https://doi.org/10.1145/2783258.2788613
- Cho et al. (2014) Kyunghyun Cho, Bart van Merrienboer, Caglar Gulcehre, Dzmitry Bahdanau, Fethi Bougares, Holger Schwenk, and Yoshua Bengio. 2014. Learning Phrase Representations using RNN Encoder-Decoder for Statistical Machine Translation. EMNLP (2014), 1724–1734.
- Gal and Ghahramani (2016) Yarin Gal and Zoubin Ghahramani. 2016. A Theoretically Grounded Application of Dropout in Recurrent Neural Networks. arXiv preprint arXiv:1512.05287 (2016).
- Ghassemi et al. (2020) Marzyeh Ghassemi, Tristan Naumann, Peter Schulam, Andrew Beam, Irene Chen, and Rajesh Ranganath. 2020. A Review of Challenges and Opportunities in Machine Learning for Health. AMIA Joint Summits on Translational Science (2020), 191–200.
- Ghassemi et al. (2019) Marzyeh Ghassemi, Mike Wu, Michael Hughes, Peter Szolovits, and Finale Doshi-Velez. 2019. Predicting intervention onset in the ICU with switching state space models. AMIA Joint Summits on Translational Science (2019), 82–91.
- Glorot and Bengio (2010) Xavier Glorot and Yoshua Bengio. 2010. Understanding the difficulty of training deep feedforward neural networks. In Proceedings of the thirteenth international conference on artificial intelligence and statistics. JMLR Workshop and Conference Proceedings, 249–256.
- Hochreiter and Schmidhuber (1997) Sepp Hochreiter and Jürgen Schmidhuber. 1997. Long short-term memory. Neural computation 9, 8 (1997), 1735–1780.
- Johnson et al. (2016) Alistair EW Johnson, Tom J Pollard, Lu Shen, H Lehman Li-Wei, Mengling Feng, Mohammad Ghassemi, Benjamin Moody, Peter Szolovits, Leo Anthony Celi, and Roger G Mark. 2016. MIMIC-III, a freely accessible critical care database. Scientific data 3, 1 (2016), 1–9.
- Johnson et al. (2018) Alistair EW Johnson, David J Stone, Leo A Celi, and Tom J Pollard. 2018. The MIMIC Code Repository: enabling reproducibility in critical care research. Journal of the American Medical Informatics Association 25, 1 (2018), 32–39.
- Kelly et al. (2019) Christopher Kelly, Alan Karthikesalingam, Mustafa Suleyman, Greg Corrado, and Dominic King. 2019. Key challenges for delivering clinical impact with artificial intelligence. BMC Med 17 (2019), 195.
- Kingma and Ba (2014) Diederik P Kingma and Jimmy Ba. 2014. Adam: A method for stochastic optimization. arXiv preprint arXiv:1412.6980 (2014).
- Knaus et al. (1991) W. A. Knaus, D. Wagner, E. Draper, and J. Zimmerman. 1991. The APACHE III prognostic system. risk prediction of hospital mortality for critically ill hospitalized adults. Chest 100, 6 (1991), 1619–1636.
- Laurens and Hinton (2008) Van Der Maaten Laurens and GJJoMLR Hinton. 2008. Visualizing data using t-SNE. Journal of Machine Learning Research 9, 2605 (2008), 2579–2605.
- Le Gall et al. (1993) Jean-Roger Le Gall, Stanley Lemeshow, and Fabienne Saulnier. 1993. A new simplified acute physiology score (SAPS II) based on a European/North American multicenter study. Jama 270, 24 (1993), 2957–2963.
- Lenert et al. (2019) Matthew Lenert, Matheny Michael, and Walsh Colin. 2019. Prognostic models will be victims of their own success, unless… Journal of the American Medical Informatics Association (2019), 1645–1650.
- Mincu et al. (2021) Diana Mincu, Eric Loreaux, Shaobo Hou, Sebastien Baur, Ivan Protsyuk, Martin G Seneviratne, Anne Mottram, Nenad Tomasev, Alan Karthikesanlingam, and Jessica Schrouff. 2021. Concept-based model explanations for Electronic Health Records. In Proceedings of the Conference on Health, Inference, and Learning. ACM CHIL.
- Payrovnaziri et al. (2020) Seyedeh Neelufar Payrovnaziri, Zhaoyi Chen, Pablo Rengifo-Moreno, Tim Miller, Jiang Bian, Jonathan H Chen, Xiuwen Liu, and Zhe He. 2020. Explainable artificial intelligence models using real-world electronic health record data: a systematic scoping review. Journal of the American Medical Informatics Association (2020). https://doi.org/10.1093/jamia/ocaa053
- Rajkomar et al. (2018) Alvin Rajkomar, Eyal Oren, Kai Chen, Andrew M Dai, Nissan Hajaj, Michaela Hardt, Peter J Liu, Xiaobing Liu, Jake Marcus, Mimi Sun, et al. 2018. Scalable and accurate deep learning with electronic health records. NPJ Digital Medicine 1, 1 (2018), 1–10.
- Roy et al. (2021) Subhrajit Roy, Diana Mincu, Eric Loreaux, Anne Mottram, Ivan Protsyuk, Natalie Harris, Emily Xue, Jessica Schrouff, Hugh Montgomery, Ali Connell, Nenad Tomašev, Alan Karthikesalingam, and Martin Seneviratne. 2021. Multi-task prediction of organ dysfunction in the ICU using sequential sub-network routing. Journal of the American Medical Informatics Association (JAMIA) (2021). https://academic.oup.com/jamia/advance-article/doi/10.1093/jamia/ocab101/6307184
- Shickel et al. (2017) Benjamin Shickel, Patrick James Tighe, Azra Bihorac, and Parisa Rashidi. 2017. Deep EHR: a survey of recent advances in deep learning techniques for electronic health record (EHR) analysis. IEEE journal of biomedical and health informatics 22, 5 (2017), 1589–1604.
- Suresh et al. (2017) Harini Suresh, Nathan Hunt, Alistair Johnson, Leo Anthony Celi, Peter Szolovits, and Marzyeh Ghassemi. 2017. Clinical intervention prediction and understanding with deep neural networks. In Machine Learning for Healthcare Conference. PMLR, 322–337.
- Tao et al. (2018) Lei Tao, Zhang Yu, Sida I. Wang, Dai Hui, and Artzi Yoav. 2018. Simple Recurrent Units for Highly Parallelizable Recurrence. EMNLP (2018), 4470–4481.
- Tomašev et al. (2021) Nenad Tomašev, Natalie Harris, Sebastien Baur, Anne Mottram, Xavier Glorot, Jack W Rae, Michal Zielinski, Harry Askham, Andre Saraiva, Valerio Magliulo, et al. 2021. Use of deep learning to develop continuous-risk models for adverse event prediction from electronic health records. Nature Protocols 16, 6 (2021), 2765–2787.
- van Geloven et al. (2019) Nan van Geloven, Sonja Swanson, Chava Ramspek, Kim Luijken, Merel van Diepen, Tim Morris, Rolf Groenwold, Hans van Houwelingen, Hein Putter, and Saskia le Cessie. 2019. Prediction meets causal inference: the role of treatment in clinical prediction models. Journal of the American Medical Informatics Association (2019), 1645–1650.
- Vincent et al. (1996) J-L Vincent, Rui Moreno, Jukka Takala, Sheila Willatts, Arnaldo De Mendonça, Hajo Bruining, CK Reinhart, PeterM Suter, and Lambertius G Thijs. 1996. The SOFA (Sepsis-related Organ Failure Assessment) score to describe organ dysfunction/failure.
- Wang et al. (2020) Shirly Wang, Matthew BA McDermott, Geeticka Chauhan, Marzyeh Ghassemi, Michael C Hughes, and Tristan Naumann. 2020. Mimic-extract: A data extraction, preprocessing, and representation pipeline for mimic-iii. In Proceedings of the ACM Conference on Health, Inference, and Learning. 222–235.
Appendix A Intervention Label Definition
-
•
Vasopressors: Vasopressors are a group of medications used to treat severely low blood pressures by constricting blood vessels. The vasopressors label was defined as the onset of any of the following 7 drugs: levophed, neosynephrine, phenylephrine, norepinephrine, vasopressin, dopamine, or epinephrine.
-
•
Inotropes: Inotropes are medications that change the force of patients’ hearts’ contractions. In ICU, inotropes are used to stabilise patients’ circulation and optimise oxygen supply. The inotropes label was defined as the onset of any of the following 3 drugs: dopamine, dobutamine, or milrinone.
-
•
Sedation: Sedative drugs are primarily used for the treatment of agitation and anxiety caused by many different conditions, such as dyspnea, mechanical ventilation, and untreated pain. The sedation label was defined as the onset of any of the following 7 drugs: propofol, midazolam, ativan, dexmedetomidine, diazepam, ketamine or pentobarbitol.
-
•
Analgesic: Analgesics are used for pain control. The analgesic label was defined as the onset of any of the following 3 drugs: fentanyl, morphine sulfate, or hydromorphone.
-
•
Anticoagulation: Anticoagulation is used for the management of venous thromboembolism (VTE), atrial fibrillation (AF), mechanical heart valves, and idiopathic pulmonary arterial hypertension (IPAH). The anticoagulation label was defined as the onset of any of the following 7 drugs: heparin, integrelin, argatroban, lepirudin, aggrastat, reopro, or bivalirudin.
-
•
Diuretic: Diuretics are a mainstay of treatment for managing fluid overload in ICU. The diuretic label was defined as the onset of either of the following 2 drugs: furosemide or natrecor.
-
•
Paralytic: Paralytics, or neuromuscular blocking agents (NMBAS), paralyze skeletal muscles by blocking the transmission of nerve impulses at the myoneural junction. They are often deployed in the sickest patients in ICU when usual care fails. The paralytic label was defined as the onset of any of the following 3 drugs: cisatracurium, vecuronium, or atracurium.
-
•
Colloid Bolus: Colloids are gelatinous solutions that maintain a high osmotic pressure in the blood. Colloid boluses are used to improve cardiovascular function and organ perfusion and are often considered as less aggressive alternatives to vasopressors. The colloid bolus label was derived from the presence of item IDs defined in the SQL query colloid_bolus.sql provided on the MIMIC Github repository222https://github.com/MIT-LCP/mimic-code/tree/main/mimic-iii.
-
•
Crystalloid Bolus: Crystalloids, another type of fluid bolus, are defined as solutions of ions that are capable of passing through semipermeable membranes. The crystalloid bolus label was derived from the presence of item IDs defined in the SQL query crystalloid_bolus.sql provided on the MIMIC Github repository.
-
•
FFP Transfusion: Fresh frozen plasma (FFP) transfusions are widely used in ICU patients to correct deficiency of coagulation factors or increased risk of developing acute lung injury. The FFP transfusion label was derived from the presence of item IDs defined in the SQL query ffp_transfusion.sql provided on the MIMIC Github repository.
-
•
RBC Transfusion: Red blood cell (RBC) transfusions are commonly used in ICU patients with increased mortality risk. The RBC transfusion label was derived from the presence of item IDs defined in the SQL query rbc_transfusion.sql provided on the MIMIC Github repository.
-
•
Ventilation: Mechanical ventilation is commonly used when an ICU patient requires assistance for breathing. The ventilation label was based on the SQL query ventilation_durations.sql provided on the MIMIC Github repository, and was defined as the onset of a new mechanical ventilation event.
-
•
Antibiotic: The antibiotic label was based on the SQL query antibiotic.sql provided on the MIMIC Github repository, with the following modifications: (1) we only included drugs prescribed to be given through an intravenous (IV) line, and (2) we ensured that there was a input event or chart event associated with vancomycin if there was a prescription order of vancomycin.
Appendix B Implementation Details
We report the optimal hyperparameter configuration on the validation data set. We trained a recurrent neural network with 3 layers of LSTM cells of size 200 with batch size 128. For the feature embedding, we used a sparse lookup table embedding with an embedding dimension of 300. We used Xavier initialization (Glorot and Bengio, 2010), Adam optimization (Kingma and Ba, 2014), and learning rate 0.0001 with exponential decay 0.85 per 12,000 steps. We trained for a total of 200,000 steps on an NVIDIA Tesla V100 GPU. For regularization, we implemented L1 regularization on the sparse lookup embeddings with a strength of 0.0005, and also input, output, and variational recurrent dropout (Gal and Ghahramani, 2016) on all of our LSTM cells with a dropout probability of 0.4.
We also explored the use of two additional recurrent cell architectures: the gated recurrent unit (GRU) (Cho et al., 2014) and the simple recurrent unit (SRU) (Tao et al., 2018), as well as two additional sparse lookup embedding sizes (200, 400) and one additional initial learning rate (0.001). While we found the LSTM to be the best performing architecture, we saw very little difference across the two learning rates and three embedding dimensions.
Appendix C Data Summary Statistics
| Gender | Total | |||
| F | M | |||
| Ethnicity | Asian | |||
| Hispanic | ||||
| Black | ||||
| Other | ||||
| White | ||||
| Age | ||||
| 31-50 | ||||
| 51-70 | ||||
| Insurance Type | Self Pay | |||
| Government | ||||
| Medicaid | ||||
| Private | ||||
| Medicare | ||||
| Admission Type | Urgent | |||
| Elective | ||||
| Emergency | ||||
| First Careunit | TSICU | |||
| CCU | ||||
| SICU | ||||
| CSRU | ||||
| MICU | ||||
| Total |
| Training | Validation | Test | |
|---|---|---|---|
| In-ICU Mortality | |||
| Vasopressors | |||
| Inotropes | |||
| Sedation | |||
| Analgesic | |||
| Anticoagulation | |||
| Diuretic | |||
| Paralytic | |||
| Colloid Bolus | |||
| Crystalloid Bolus | |||
| FFP Transfusion | |||
| RBC Transfusion | |||
| Ventilation | |||
| Antibiotic | |||
| Total |
Appendix D Supplementary Experimental Results and Details