Perfusion imaging in deep prostate cancer detection from mp-MRI: can we take advantage of it?
Abstract
To our knowledge, all deep computer-aided detection and diagnosis (CAD) systems for prostate cancer (PCa) detection consider bi-parametric magnetic resonance imaging (bp-MRI) only, including T2w and ADC sequences while excluding the 4D perfusion sequence, which is however part of standard clinical protocols for this diagnostic task. In this paper, we question strategies to integrate information from perfusion imaging in deep neural architectures. To do so, we evaluate several ways to encode the perfusion information in a U-Net like architecture, also considering early versus mid fusion strategies. We compare performance of multiparametric MRI (mp-MRI) models with the baseline bp-MRI model based on a private dataset of 219 mp-MRI exams. Perfusion maps derived from dynamic contrast enhanced MR exams are shown to positively impact segmentation and grading performance of PCa lesions, especially the 3D MR volume corresponding to the maximum slope of the wash-in curve as well as Tmax perfusion maps. The latter mp-MRI models indeed outperform the bp-MRI one whatever the fusion strategy, with Cohen’s kappa score of for the bp-MRI model and for the model including the maximum slope with a mid fusion strategy, also achieving competitive Cohen’s kappa score compared to state of the art.
Index Terms— prostate cancer, mp-MRI, dynamic MRI, segmentation, CNN.
1 Introduction
Deep learning has become the state-of-the-art approach for the processing and analysis of many medical imaging problems, including detection and segmentation tasks. Many CAD systems for prostate cancer (PCa) detection and segmentation from MRI are based on convolutional neural networks (CNN) [1]. However, deep models render difficult the inclusion of high dimensional input data, such as 4-dimensional (4D) perfusion MR.In addition, the impact of this MR dynamic contrast enhanced (DCE) modality in PCa detection is controversial [2, 3, 4, 5]. As a consequence, as far as we know, all deep PCa segmentation models using original MR images as input (thus excluding the radiomics-based approaches) only include T2 weighted (T2w) and diffusion weighted imaging (DWI) sequences, leading to bi-parametric (bp) models. In this paper, we question the contribution of the dynamic sequence in the context of the challenging task of segmentation and grading of PCa in mp-MRI, addressed in few studies [6, 7, 8, 9]. We evaluate several ways to encode the perfusion information in 3D and compare performance of mp-MRI models with the baseline bp-MRI model.
2 Materials and methods
2.1 Perfusion maps


Several types of perfusion maps were derived from the time series of 3D dynamic contrast enhanced (DCE) image stacks acquired for each patient after the bolus injection of gadolinium contrast agent. These maps consist either in specific 3D MR volumes extracted at specific time points from the time series or from semi-quantitative parametric maps extracted from the processing of kinetic curves at voxel level, as illustrated in Figure 1.
Tmax
Tmax maps are parametric maps, where each voxel value corresponds to the time where the maximum value of the time intensity curve was observed.
The unit is arbitrary since dynamic MR shows variable temporal resolution.
Wash-in
The wash-in period corresponds to the period of the time intensity curve ranging from the onset to the time of peak intensity, where the onset is defined as the time corresponding to the maximum acceleration on the time-intensity curve. The wash-in maps are derived by computing the slope observed in the time-intensity curve during the wash-in period at voxel level.
The higher the wash-in slope, the faster the wash-in speed, that is a suspicious sign of cancer tissue.
Wash-out Similarly to the wash-in map, the wash-out map contains the voxel-based slope values observed in the time-intensity curve during the wash-out time period ranging from Tmax until the end of the acquisition.
Maximum slope time volume
This 3D map is the 3D MR volume of the DCE times series corresponding to the volume where the maximum slope (or signal enhancement) was observed in the signal intensity curve.
Maximum percentage of enhancement maps
This 3D map reflects the percentage enhancement from the signal intensity changes between the first image and the images obtained during the wash-in period,
regardless of the time when the maximal enhancement appears. Those maps were described in [10].
Quantitative pharmacokinetic maps derived from compartmental modeling such as , , and were not considered because of their high dependence to the arterial input function and variability depending on the MR scanner acquisition parameters [11].
2.2 Data description
The private dataset used in this study consists of a series of axial T2w, apparent diffusion coefficient (ADC) and DCE MR images from 219 patients, acquired in clinical practice at our partner clinical center. Imaging was performed on three different scanners from different constructors and magnetic field strengths: 67 exams on a 1.5T Symphony scanner (Siemens Medical Systems), 126 on a 3T scanner Discovery scanner (General Electric) and 26 on a 3T Ingenia scanner (Philips Healthcare). For DCE imaging, an intravenous injection of 0.2ml/kg of gadoterate meglumine was performed at 3 ml/s. Temporal resolution was adapted to the field strength and depends on the scanner. All patients underwent a radical prostatectomy. After correlation with the whole-mount specimens, the uroradiologists outlined reported 338 prostate lesions as well as all prostate contours. Their distribution according to the Gleason score (GS) group is detailed in Table 1, where GS 3+3 and GS 8 represent the less and most aggressive cancers, respectively. The detailed protocol and acquisition parameters can be found in [12].
| GS 3+3 | GS 3+4 | GS 4+3 | GS 8 | Total |
|---|---|---|---|---|
| 104 | 126 | 56 | 52 | 338 |
2.3 Multiclass deep segmentation of PCa
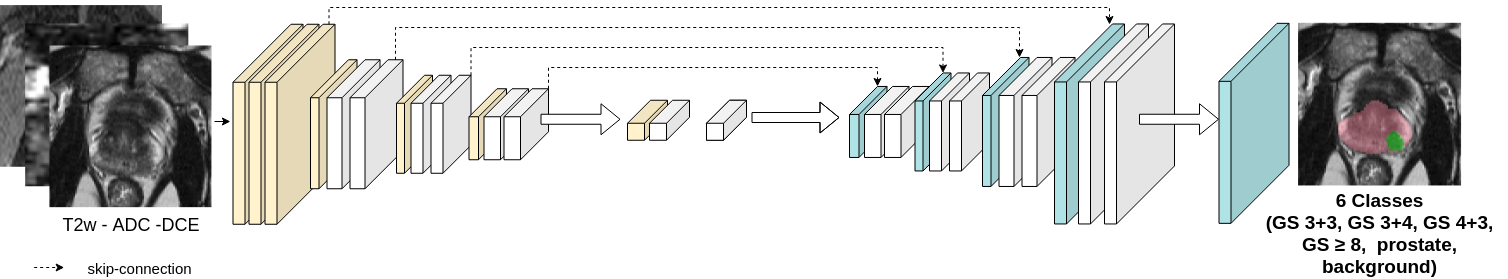
The model used in this work is based on a standard four blocks U-Net [13], with batch normalization layers to reduce over-fitting and leaky ReLu activations.
It produces a 6-channels segmentation maps, corresponding to 6 class labels for the background, the overall prostate area, GS 6, GS 3+4, GS 4+3 and GS lesions. This standard U-Net architecture was shown efficient for the detection and grading of PCa with bp-MRI [7, 9].
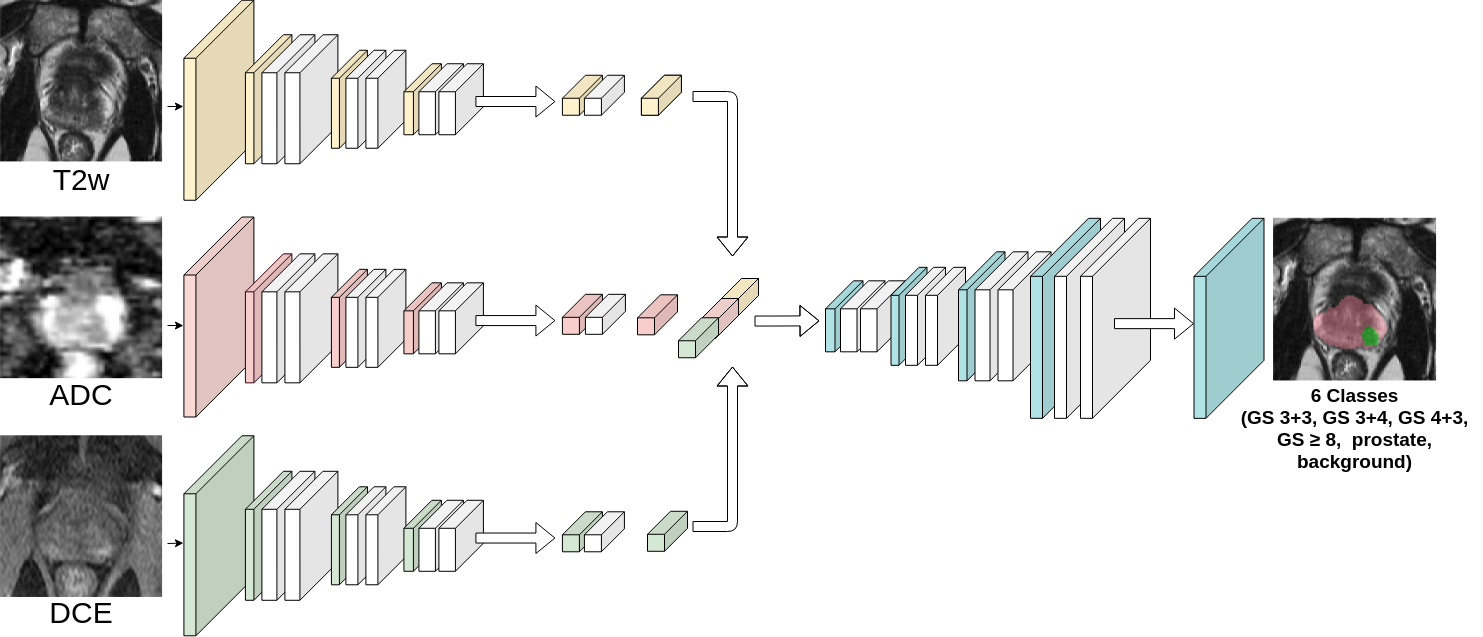
Two different fusion strategies of the different modalities were considered in this work as depicted on Figure 2 :
-
•
early fusion, where all considered modalities are stacked in a multichannel input;
-
•
mid fusion, where each modality is encoded independently into distinct convolutional branches of the U-Net, sharing the same decoding branch. Feature maps from each encoding branch are concatenated in the latent space after the encoders (after the 10th convolutional layer).
For each fusion strategy, we considered one baseline bi-parametric model including T2w and ADC maps as well as different multiparametric models accounting for one of the perfusion maps listed above in addition to the T2w and ADC maps.
2.4 Experiments
Each model was trained and validated using a 5-fold cross-validation, with 4 replicates for each cross-validation experiment for more representative results. Multichannel input MR images were resampled to a mm3 voxel size and automatically cropped to a pixels region on the image’s center. Intensity was linearly normalized into [0, 1] by volume. Data augmentation was applied during the training phase to reduce overfitting and batch size was set to 32. All models were trained using a combination of the dice loss and cross entropy, with Adam optimizer and a L2 weight regularization with . The initial learning rate was set to with a 0.5 decay after 25 epochs without validation loss improvement. The pipeline was implemented with the Keras-Tensorflow 2.4 library.
Lesion detection performance was evaluated through free-response receiver operating characteristics (FROC) analysis, first considering the performance of each model to discriminate clinically significant (CS) lesions (GS 6), then its ability to discriminate lesions of each GS group. Cohen’s quadratic weighted kappa coefficient was also computed at the lesion level as described in [9].
3 Results
| Model | Kappa | Sensi at 1FP | Sensi at 2FP | Sensi max | Max FP | Dice prostate |
|---|---|---|---|---|---|---|
| Early fusion | ||||||
| baseline : bp-MRI | ||||||
| bp-MRI + max slope | ||||||
| bp-MRI + % enhancement | ||||||
| bp-MRI + Tmax | ||||||
| bp-MRI + wash-in | ||||||
| bp-MRI + wash-out | ||||||
| Mid fusion | ||||||
| baseline : bp-MRI | ||||||
| bp-MRI + max slope | ||||||
| bp-MRI + Tmax | ||||||
| GS | GS 4+3 | GS 3+4 | GS 3+3 | |||||
| Model | 1.5 FP | 1 FP | 1.5 FP | 1 FP | 1.5 FP | 1 FP | 1.5 FP | 1 FP |
| Early fusion | ||||||||
| baseline : bp-MRI | ||||||||
| bp-MRI + max slope | ||||||||
| bp-MRI + % enhan. | ||||||||
| bp-MRI + Tmax | ||||||||
| bp-MRI + wash-in | ||||||||
| bp-MRI + wash-out | ||||||||
| Mid fusion | ||||||||
| baseline : bp-MRI | ||||||||
| bp-MRI + max slope | ||||||||
| bp-MRI + Tmax | ||||||||
Table 2 shows detection and segmentation performance of CS (GS 6) lesions for each perfusion map and each fusion strategy in comparison with the baseline bp-MRI model. Considering the early fusion strategy, the addition of the max slope volume, Tmax or wash-out map to the T2 and ADC maps is shown to boost the model performance compared to the baseline. For the max slope and the Tmax maps, we observe a sensitivity gain of 5.4% and 4.1% respectively at 1 false positive (FP), 2.6% and 3.3% at 2FP and the maximum sensitivity increased by 5.8% and 5.9%. For those 2 models, the maximal number of FP is also reduced by 0.152 for the max slope and 0.172 for the Tmax. % enhancement and wash-in maps are not shown to bring discriminant information for this task. Considering the Cohen’s kappa coefficient, the best value of is obtained with the wash-out model, that outperforms the baseline ().
Performance achieved with the two best performing parametric maps (Tmax and max slope volume) of the early fusion scenario were compared to that achieved with the same perfusion maps in the mid-fusion strategy. This approach does not show a clear impact : at 1FP, sensitivities of these 3 models (second part of Table 2) are lower than with the early fusion strategy, but at 2FP, the max slope and Tmax sensitivies are higher than with the early fusion strategy.
Table 3 allows a finer analysis of the sensitivity for each Gleason Score (GS) group. It reflects the model ability to both localize lesions and assign their correct GS. Regarding the early fusion strategy, here again, models trained with Tmax perfusion map or max slope volume outperform the baseline, except for the GS 3+4 (class with the highest number of lesions in the dataset, see Table 1) where sensitivities of all models are very close and for the GS 3+3 for Tmax. The wash-out is also shown to perform well and outperform the baseline for each GS but the GS 3+4 at 1.5FP. The mid fusion strategy seems to outperform the early fusion, in particular when accounting for Tmax perfusion map.
4 Conclusions
This study demonstrates that perfusion maps derived from DCE MR exams positively impact the performance of deep multiclass segmentation models of PCa. Reported performance are in par with the state of the art and outperform the reported kappa of [8] with a bp-MRI ordinal regression model on the ProstateX-2 challenge dataset. Performance gain was shown to depend on the considered perfusion maps and fusion strategy. Although no strict guidelines could be driven from this study, we showed that, globally, the Tmax, and max slope volume improved detection sensitivity of CS and GS PCa lesions. This is concordant with other studies where the Tmax was found to have a significant impact on the detection of PCa lesions [14]. The mid fusion strategy seems to be beneficial both in terms of detection sensitivity and prostate segmentation. The concatenation of each sequence data at a higher representation level is likely to allow extracting more discriminant features from each MR sequence. This fusion strategy might also be less sensitive to small misalignment between sequences.
Our study does not demonstrate the positive impact of wash-in maps unlike some other standard radiomic studies [15, 16]. This might be explained by the way we extracted wash-in maps : the end of the wash-in period was indeed defined at the time where the brightest intensity was observed in the voxel, that might be reached at the end of the acquisition. In addition, the intensity normalisation was performed after the volume slices were cropped to a size, so it doesn’t consider the external iliac vein and artery, where a high signal is observed at the arrival time. This might induce high inter-variability of the wash-in maps impairing the impact of this perfusion map.
Perspectives would be to further evaluate the impact of the perfusion map normalisation as well as include together the three perfusion maps (Tmax, max slope, wash-out) in addition to the T2w and ADC maps in the U-Net based PCa segmentation model, in a early or mid fusion strategy.
5 Compliance with ethical standards
This study was performed in line with the principles of the Declaration of Helsinki. Approval was granted by the appropriate national administrative authorities (Comité de Protection des Personnes, reference L 09-04 and Commission Nationale de l’Informatique et des Libertés, treatment n∘ 08-06) and patients gave written informed consent for researchers to use their MR imaging and pathologic data.
6 Acknowledgments
This work was supported by the RHU PERFUSE (ANR-17-RHUS-0006) of Université Claude Bernard Lyon 1 (UCBL), within the program “Investissements d’Avenir” operated by the French National Research Agency (ANR).
References
- [1] Rogier R. Wildeboer, Ruud J. G. van Sloun, Hessel Wijkstra, and Massimo Mischi, “Artificial intelligence in multiparametric prostate cancer imaging with focus on deep-learning methods,” Computer Methods and Programs in Biomedicine, vol. 189, pp. 105316, 2020.
- [2] Sadhna Verma, Baris Turkbey, Naira Muradyan, Arumugam Rajesh, Francois Cornud, Masoom A. Haider, Peter L. Choyke, and Mukesh Harisinghani, “Overview of Dynamic Contrast-Enhanced MRI in Prostate Cancer Diagnosis and Management,” American Journal of Roentgenology, vol. 198, no. 6, pp. 1277–1288, June 2012, Publisher: American Roentgen Ray Society.
- [3] P. De Visschere, N. Lumen, P. Ost, K. Decaestecker, E. Pattyn, and G. Villeirs, “Dynamic contrast-enhanced imaging has limited added value over T2-weighted imaging and diffusion-weighted imaging when using PI-RADSv2 for diagnosis of clinically significant prostate cancer in patients with elevated PSA,” Clinical Radiology, vol. 72, no. 1, pp. 23–32, Jan. 2017.
- [4] Sungmin Woo, Chong Hyun Suh, Sang Youn Kim, Jeong Yeon Cho, Seung Hyup Kim, and Min Hoan Moon, “Head-to-Head Comparison Between Biparametric and Multiparametric MRI for the Diagnosis of Prostate Cancer: A Systematic Review and Meta-Analysis,” American Journal of Roentgenology, vol. 211, no. 5, pp. W226–W241, Nov. 2018, Publisher: American Roentgen Ray Society.
- [5] Valentina Brancato, Giuseppe Di Costanzo, Luca Basso, Liberatore Tramontano, Marta Puglia, Alfonso Ragozzino, and Carlo Cavaliere, “Assessment of DCE Utility for PCa Diagnosis Using PI-RADS v2.1: Effects on Diagnostic Accuracy and Reproducibility,” Diagnostics, vol. 10, no. 3, pp. 164, Mar. 2020, Number: 3 Publisher: Multidisciplinary Digital Publishing Institute.
- [6] Ruiming Cao, Amirhossein Mohammadian Bajgiran, Sohrab Afshari Mirak, Sepideh Shakeri, Xinran Zhong, Dieter Enzmann, Steven Raman, and Kyunghyun Sung, “Joint Prostate Cancer Detection and Gleason Score Prediction in mp-MRI via FocalNet,” IEEE Transactions on Medical Imaging, 2019.
- [7] Audrey Duran, Pierre-Marc Jodoin, and Carole Lartizien, “Prostate Cancer Semantic Segmentation by Gleason Score Group in bi-parametric MRI with Self Attention Model on the Peripheral Zone,” in Medical Imaging with Deep Learning. Sept. 2020, pp. 193–204, PMLR.
- [8] Coen De Vente, Pieter Vos, Matin Hosseinzadeh, Josien Pluim, and Mitko Veta, “Deep Learning Regression for Prostate Cancer Detection and Grading in Bi-parametric MRI,” IEEE Trans. Biomed. Eng., pp. 1–1, 2020.
- [9] Audrey Duran, Gaspard Dussert, Olivier Rouvière, Tristan Jaouen, Pierre-Marc Jodoin, and Carole Lartizien, “ProstAttention-Net: a deep attention model for prostate cancer segmentation by aggressiveness in MRI scans,” Medical Image Analysis, p. 102347, 2022.
- [10] Ji Yoon, Moon Choi, Young-Joon Lee, and Seung Jung, “Dynamic Contrast-Enhanced MRI of the Prostate: Can Auto-Generated Wash-in Color Map Be Useful in Detecting Focal Lesion Enhancement?,” Investigative Magnetic Resonance Imaging, vol. 23, pp. 220, Jan. 2019.
- [11] S. Brunelle, C. Zemmour, F. Bratan, F. Mège-Lechevallier, A. Ruffion, M. Colombel, S. Crouzet, A. Sarran, and O. Rouvière, “Variability induced by the MR imager in dynamic contrast-enhanced imaging of the prostate,” Diagnostic and Interventional Imaging, vol. 99, no. 4, pp. 255–264, Apr. 2018.
- [12] Flavie Bratan, Emilie Niaf, Christelle Melodelima, Anne Laure Chesnais, Rémi Souchon, Florence Mège-Lechevallier, Marc Colombel, and Olivier Rouvière, “Influence of imaging and histological factors on prostate cancer detection and localisation on multiparametric MRI: a prospective study,” Eur Radiol, vol. 23, no. 7, pp. 2019–2029, July 2013.
- [13] Olaf Ronneberger, Philipp Fischer, and Thomas Brox, “U-Net: Convolutional Networks for Biomedical Image Segmentation,” arXiv:1505.04597 [cs], 2015.
- [14] Jing Zhao, Avan Kader, Dilyana B. Mangarova, Julia Brangsch, Winfried Brenner, Bernd Hamm, and Marcus R. Makowski, “Dynamic Contrast-Enhanced MRI of Prostate Lesions of Simultaneous [68Ga]Ga-PSMA-11 PET/MRI: Comparison between Intraprostatic Lesions and Correlation between Perfusion Parameters,” Cancers, vol. 13, no. 6, pp. 1404, Jan. 2021, Number: 6 Publisher: Multidisciplinary Digital Publishing Institute.
- [15] Yu Sub Sung, Heon-Ju Kwon, Bum-Woo Park, Gyunggoo Cho, Chang Kyung Lee, Kyoung-Sik Cho, and Jeong Kon Kim, “Prostate Cancer Detection on Dynamic Contrast-Enhanced MRI: Computer-Aided Diagnosis Versus Single Perfusion Parameter Maps,” American Journal of Roentgenology, vol. 197, no. 5, pp. 1122–1129, Nov. 2011, Publisher: American Roentgen Ray Society.
- [16] Au Hoang Dinh, Christelle Melodelima, Rémi Souchon, Jérôme Lehaire, Flavie Bratan, Florence Mège-Lechevallier, Alain Ruffion, Sébastien Crouzet, Marc Colombel, and Olivier Rouvière, “Quantitative Analysis of Prostate Multiparametric MR Images for Detection of Aggressive Prostate Cancer in the Peripheral Zone: A Multiple Imager Study,” Radiology, vol. 280, no. 1, pp. 117–127, Feb. 2016.