Rheology of Polydisperse non-Spherical Graphite Particles Suspended in Mineral Oil
Abstract
The role of filler concentration and microphysics on the rheology of polydisperse flake-graphite particles suspended in Newtonian mineral oil is studied. Under steady shear, shear thinning becomes more pronounced when shearing from low to high rates than in the opposite direction. We attribute this to a greater degree of filler orientation during up-shear. Time-temperature superposition was observed using an Arrhenius-type horizontal shift factor, giving a flow activation energy that is dependent on the graphite volume fraction, suggesting concentration-dependent contributions to relaxation processes in the suspensions. The flow curves are fitted by a constraint-based model, indicating that the flow behaviour is controlled by frictional and adhesive contacts, with the model suggesting that the adhesive stress is temperature dependent.
I Introduction
Carbonic polymer composites are widely applicable, for instance as electrode materials in fuel cell bipolar plates (BPPs), as porous electrodes in Li-ion batteries, or in aerospace composites, and hence, their properties have been intensively studied Zhang2005; Naz2016; Yao2017; Sengupta2011; Kakati2009; Mendes2007; Lim2015. In BPP applications, replacing traditional materials such as graphite with highly-filled carbonic polymer composites can give higher electrical and thermal conductivities at relatively low costs Lee2009. The high filler loadings required to obtain satisfactory conductivities may, however, dramatically affect the composite rheology King2006; King2008, hereby complicating manufacturing. Yet, characterising the rheological properties of carbonic polymer composites may yield valuable insight into the microstructure, filler dispersion and filler interactions since this information correlates with electrical properties daSilva2021. Thus, rational composite design requires understanding how the filler particles, the matrix phase and their coupling affect the system’s rheology. Additionally, the importance of understanding the coupling between phases extends to e.g. semi-solid flow cells where the flowing electrodes consist of suspensions of active (LiFePO4) and conductive (carbon black) materials. Tuning particle interactions in such biphasic mixtures allows control of their rheology and hence reduction of particle sedimentation and phase segregation, as well as enabling efficient charge transport Wei2015.
The matrix in graphite-polymer composites is typically a thermoplastic such as poly(methyl-methacrylate), polyethylene, polyvinyl chloride, etc., and their derivatives. The rheology of their melts at processing temperatures is by now well understood doi1988; McLeish2002. This provides a good starting point for the predictive formulation of the matrix component of graphite-polymer composites.
The filler, graphite, can be exfoliated into colloidal flakes Ma2015; Zheng2012. However, most commercial graphite powder additives fall in the non-Brownian regime, with typical particle size . Compared to polymer melts, the rheology of non-Brownian suspensions is poorly understood. Such systems are history-dependent because no thermal motion randomises particle positions. Moreover, it has recently become clear that particle contacts control rheology Morris2020, and contact forces are far more sensitive to surface details, e.g., hydrogen bonding James2018, than non-contact colloidal interactions. Many uncertainties therefore remain, with experimental validation of simulations Mari2014 and theory Wyart2014 largely limited to model non-Brownian suspensions of nearly-monodispersed repulsive spheres Guy2015; Royer2016; Hermes2016, although results for the role of adhesive contact interactions are now beginning to emerge Guy2018; Richards2020; Richards2021. Not surprisingly, then, highly non-intuitive discoveries are still being made, such as bistability in non-Brownian particles dispersed in a colloidal gel matrix Jiang2022.
Current knowledge therefore does not yet constitute a firm basis for the predictive formulation of graphite-polymer composite fillers. In this work, we contribute towards this goal by studying a model composite in which the non-Newtonian polymer melt matrix at processing temperatures is replaced by a simpler Newtonian fluid. We then probe whether the recently-emergent framework of ‘contact-force rheology’ Morris2020; Guy2018 may be applicable to one popular form of graphitic particles.
Specifically, we explore the rheology of polydisperse graphite particles dispersed in mineral oil using rotational rheometry, varying the solid volume fraction, , and temperature, . A weak flow-history dependence may be attributable to filler orientation. We re-scale flow curves from different , and fit these with the purely empirical Herschel-Bulkley model and a recent physics-based model. The latter approach allows us to infer mechanistic insights concerning adhesive and frictional inter-particle contacts. As background, we first review briefly the new framework of suspension rheology involving inter-particle contacts.
II Contact forces in suspension rheology
Developing constitutive models for non-Brownian, or granular, suspensions is a longstanding challenge Ancey1999. Recent advances have identified an essential piece of missing physics. Simulations Mari2014 and theory Wyart2014 suggest that at high enough applied stress, particles are pressed into frictional contact. This effect is included in a simple model Wyart2014 that starts from the well-known phenomenological equation Mueller2010; Maron1956; Krieger1959
| (1) |
with the suspension viscosity, , relative to that of the suspending solvent, , and the exponent111Note that in the Krieger-Dougherty equation the exponent was chosen as , with the intrinsic viscosity, to give the correct first-order term for a Taylor expansion in the dilute limit. While this happens to give a reasonable numerical value for for spherical particles, there is no fundamental physical reason for the intrinsic viscosity, describing single-particle hydrodynamic contributions, to control the divergence near jamming. . This so-called Krieger-Dougherty equation captures the well-known observation that the viscosity of any suspension will diverge when its volume fraction, , reaches some ‘jamming’ point . In the original formulation, is a constant for any particular suspension. Subsequently, it has been suggested that is shear-rate dependent Wildemuth1984; Stickel2005. The recent breakthrough comes from the realisation that is in fact dependent on the applied stress, , for which Wyart and Cates (WC) propose the form
| (2) |
This is a linear interpolation between random close packing, in the low-stress limit and random loose packing, , in the high-stress limit. The crucial physics idea is that as the applied stress increases, an increasing fraction of particles are pressed into frictional contact. The no-sliding constraint imposed by static friction then dictates a looser form of packing, so that as increases from 0 to 1, the jamming point decreases from random close packing to random loose packing, with the latter being dependent on the coefficient of static friction, , between the particles. For non-frictional hard spheres, , and in the high friction limit () Silbert2010. WC propose that the transition between these two packing limits occurs at some characteristic ‘onset stress’ for frictional contact. Any form of that increases with predicts shear thickening when Equation 2 is substituted into Equation 1: increases as increases because decreases with . A sigmoidal captures the measured rheology of a variety of shear thickening systems with only a handful of fitting parameters Guy2015; Royer2016; Hermes2016.
This framework can be extended to include adhesive contacts that constrain rolling, which are released under increasing stress Guy2018. Such rolling constraints, which could arise between attractive particles due to contact pinning or touching facets, introduce a new critical packing fraction, ‘adhesive loose packing’, . This limit is not precisely known even for monodisperse spheres, although simulations Liu2017 suggest that it could be as low as . Analogous to , a function describes the release of these constraints by applied stress, with and . The extended WC model including such adhesive contacts predicts a ‘zoo’ of flow curves involving combinations of shear thinning and shear thickening Guy2018.
In the limit where contacts are always frictional222In such a system, shear thickening is not observed; in a loose sense, the ever presence of friction means that flow is always frictional, so that the system is ‘always shear thickened’., i.e. at all , we write
| (3) |
An inverse sigmoidal form
| (4) |
is able to capture the rheology of a variety of systems, including PMMA spheres in oil Guy2018, cornstarch in oil Richards2020, calcite in glycerol-water Richards2021 and molten chocolate (= sugar grains in oil) Blanc2018. In Equation 4, gives a characteristic stress scale for peeling adhesive contacts apart to initiate rolling, while describes the rate decreases from 1 to 0. Importantly, a finite yield stress, , is predicted at . At and below this stress, the viscosity diverges in the flow curve. Solving using the above ansatz for gives
| (5) |
which describes data in calcite suspensions Richards2021. Note that the yield stress involves the cooperative action of adhesion and friction Richards2020, with adhesive contacts stabilising frictional force chains. Moreover, Equation 5 predicts at , just as in purely frictional systems: irrespective of adhesion, friction prevents flow above random loose packing.
In this model, many effects enter through the values of and . In particular, their values depend on particle shape and polydispersity: irregular particles jam at lower volume fractions compared to spheres Torquato2010 while polydispersity enables denser packing Farr2009. Moreover, this simple model will not account for effects such as shear-induced alignment of anisotropic particles. Nevertheless, we will find fitting this model to our graphite-in-oil data gives significant insight into the physical factors controlling the rheology of this system.
III Materials and Methods
Timcal Timrex KS5-75TT graphite particles with a size distribution of , , and (supplier’s laser diffraction data) were obtained from Imerys Graphite & Carbon. They have a Scott density of 0.44 and a tapped density of 2.2 , and are predominately flake-like with an irregular surface. However, included are also more oblate- and needle-shaped particles, Figure 1. Suspensions at different volume fractions, , were prepared by mechanically mixing heavy mineral oil (Merck 330760; viscosity at ) with graphite powder. In between experiments the suspensions were stored at room temperature.

For rheological measurements an AR-G2 rheometer (TA Instruments) was used, and temperature ( to ) was controlled with a Peltier system. A parallel plate geometry (diameter , gap height 600-) with cross-hatching was used to obtain data for suspensions, while for the pure oil a smooth parallel plate geometry (same diameter, gap height ) was used. Suspensions were mechanically homogenised prior to loading. Samples at were pre-sheared for at a shear rate to erase memory of the loading history. At we pre-sheared for at or to avoid edge fracture. All samples equilibrated to the measurement temperature for before starting the experiment. Steady shear measurements were performed on the suspensions to study time-temperature superposition, with gap heights of , , and at each temperature to check that wall slip effects were insignificant Wei2015; Blanc2018; Khalkhal2011. Unless explicitly stated, we sheared from low to high rates, and report flow curves that are the average of at least two measurements.
Brownian motion and inertia effects can be neglected because and throughout our range of . The minimum stress required for counteracting sedimentation is estimated as Richards2020; Richards2021, where is the particle fluid density difference, is the acceleration of gravity, giving using . This is similar to the lowest measured stresses in the two least concentrated suspensions, so that we may also neglect sedimentation effects.
IV Results and Discussion
IV.1 Influence of sweep direction
Rotational shear rheometry data for suspensions of , , and sweeping from highlow (HL) and lowhigh (LH) shear rates are shown in Figure 2a. Each sample was only swept in one direction to probe the effect of sweep direction. All samples exhibit sweep direction-dependent shear thinning. Furthermore, the low-shear viscosities show increasing relative deviation with graphite concentration.
The dependence on the sweep direction may reflect shear-induced changes in the suspension microstructure. Such shear-induced orientational alignment at high has been observed in aqueous suspensions of cellulose microcrystals Ebeling1999 and platelet-like organoclays in polypropylene/organoclay nanocomposites Zouari2012. Shear thinning in suspensions of non-Brownian spheres can also be associated with breakdown of large agglomerates under increasing shear Papadopoulou2020. This suggests a picture where our flake-like graphite particles initially exist as irregular clusters after loading, so that sweeping from highlow can break apart the clusters into flakes which then orient under shear, resulting in a lower viscosity at low shear rates. In contrast, sweeping in the opposite direction from lowhigh would largely preserve these irregular clusters at low rates and avoid significant alignment. In this scenario, we would expect the magnitude of this viscosity difference to increase with the filler concentration, as the irregular clustered state should have a lower jamming density than the aligned state, consistent with our observations, Figure 2b. Particle alignment will likely be most severe in the uniform linear shear applied in rotational rheometery, while practical mixing processes tend to feature non-uniform flows that will inhibit alignment. We therefore focus on the flow curves obtained from lowhigh shear rate sweeps in the remaining sections of this work.
IV.2 Temperature dependence
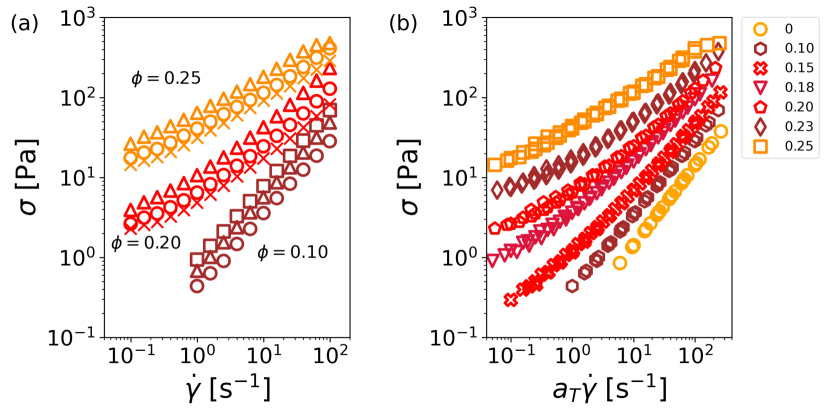
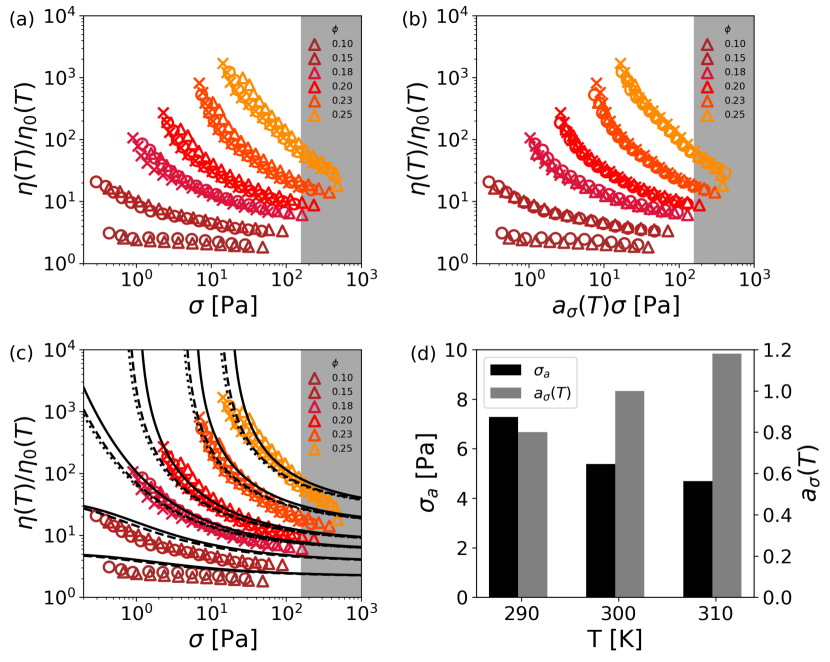
The flow curves of selected suspensions with at to are shown in Figure 3a. A common approach to analysing temperature-dependent rheology is time-temperature superposition (TTS), where (typically) the shear rates are shifted by some temperature-dependent factors to align the flow curves to that measured at some reference temperature. We shift our flow curves by the scaling , Figure 3b, to arrive at a set of concentration-dependent shift factors , Figure 4a. These follow an Arrhenius-type dependence,
| (6) |
where is the flow activation energy, the universal gas constant, and the reference temperature. Plotting , Figure 4b, reveals a rapid increase at . Interestingly, is the first concentration at which we may discern a flattening at low in the flow curve as increases, Figure 3b, and therefore the emergence of a finite yield stress.
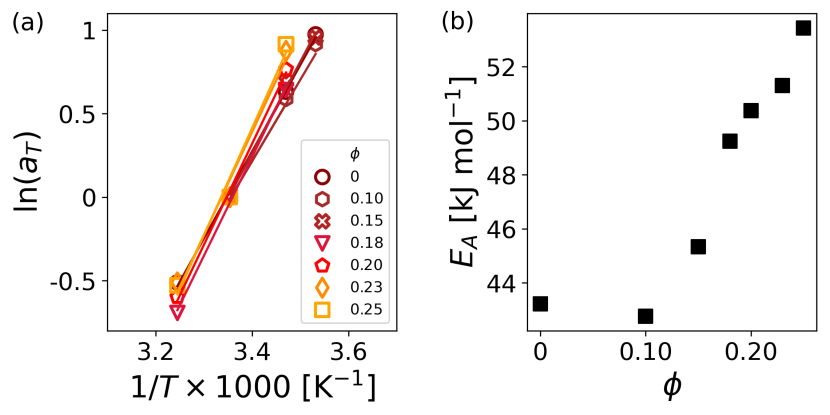
TTS has been applied to a variety of non-Brownian suspensions, including silica in ethylene glycol/glycerol with added salt Watanabe1996, glass spheres in polyisobutylenes Schmidt2001 and PMMA spheres (diameter ) in poly(-caprolactone) Constanzo2019. In these cases with Newtonian solvents, the suspended solids do not significantly affect the relaxation dynamics and hence shift factors. In cases where the matrix is non-Newtonian, there is more variation from system to system, with little to no change with filler concentration in glass fiber reinforced polypropylene Mobuchon2005 or Newtonian epoxy resin filled with multi-walled carbon nanotubes(MWCNTs) Khalkhal2011, while the activation energy was found to increase with concentration in nitrile-butadiene/graphene nanocomposites Mowes2014 and decrease with concentration in MWCNT/polycarbonate composites Abbasi2009.
We will later apply the adhesive constraints model reviewed earlier to our system, which assumes a purely stress-dependent rheology, i.e., for some function . In this case, we have
| (7) |
which we recognise as the shift factor for the pure solvent. So, we predict a -independent suspension shift factor, as was observed in many previous systems Watanabe1996; Schmidt2001; Constanzo2019. Figure 4b therefore suggests an additional source of temperature-dependence beyond the solvent in our graphite-in-oil suspensions.
IV.3 Phenomenological fitting
Figure 3b suggests that a finite yield stress emerges at . Flow curves for yield-stress fluids are often fitted empirically by the Herschel-Bulkley (HB) equation Herschel1926; Kalyon2014
| (8) |
where is the HB yield stress, the consistency index, and the flow index ( for shear thickening, for shear thinning). This equation, which fits data from disparate systems from colloidal gels and glasses through jammed emulsions Bonn2017 to certain non-Brownian suspensions Mueller2010; Papadopoulou2020, also credibly applies to our data for , Figure 5.
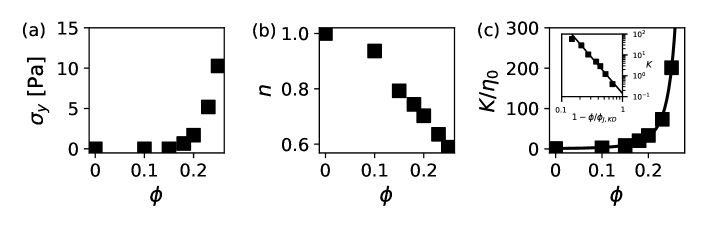
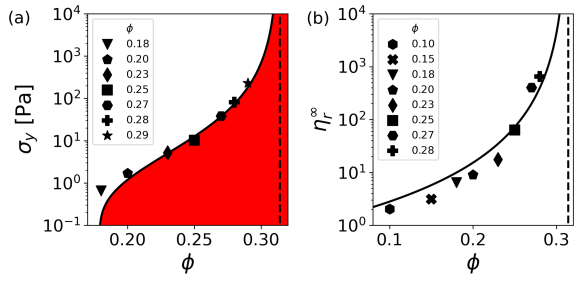
The fitted HB yield stress is plotted as a function of in Figure 6a, where we have assigned to all systems with . This reflects the lack of a low- plateau in the relevant flow curves, Figure 3, and is consistent with our experience of handling these samples, which flowed easily as liquids. The extracted HB yield stress increases rapidly for , Figure 6a, suggesting a divergence at some critical concentration.
The flow index steadily decreases with increasing graphite volume fraction, Figure 6b, from for our Newtonian mineral oil () to for , indicating an increasing degree of shear thinning. This contrasts with yield stress suspensions of spherical particles, where the dependence is either weaker Mueller2010 or absent Papadopoulou2020. Our observation possibly reflects a particle shape effect.
Like , the consistency index also increases with and appears to diverge, Figure 6c. The data can be fitted to with and (KD = Krieger-Dougherty). The consistency index scales as the viscosity at and it may be interpreted as a kind of ‘generalised viscosity’. Perhaps unsurprisingly, will be related to a viscosity divergence to be identified later.
IV.4 Physical modelling
The HB equation is purely phenomenological and contains no physics. In contrast, a recently-proposed constraint-based model Guy2018 is predicated on the existence of adhesive and frictional contacts. Fitting to this model may therefore yield insights into the micro-physics of our graphite suspensions.
Since our flow curves all show shear thinning without subsequent shear thickening, Figure 5, we apply the model in the limit where particle contacts are frictional at all stresses (). Adhesive constraints to rolling that are progressively released as stress increases give rise to yielding and subsequent shear thinning. This is similar to suspensions of cornstarch in oil Richards2020 and unstabilised calcite in glycerol-water Richards2021.
The model, which, has been reviewed above, requires five parameters: the viscosity divergence exponent, two critical volume fractions and reflecting the frictional and frictional+adhesive jamming points, and the stress scale and exponent describing the release of adhesive constraints. If particle contacts do not change with , a single set of -independent parameters should fit all our flow curves. This is in contrast to the HB fits, with either two or three free parameters per flow curve.
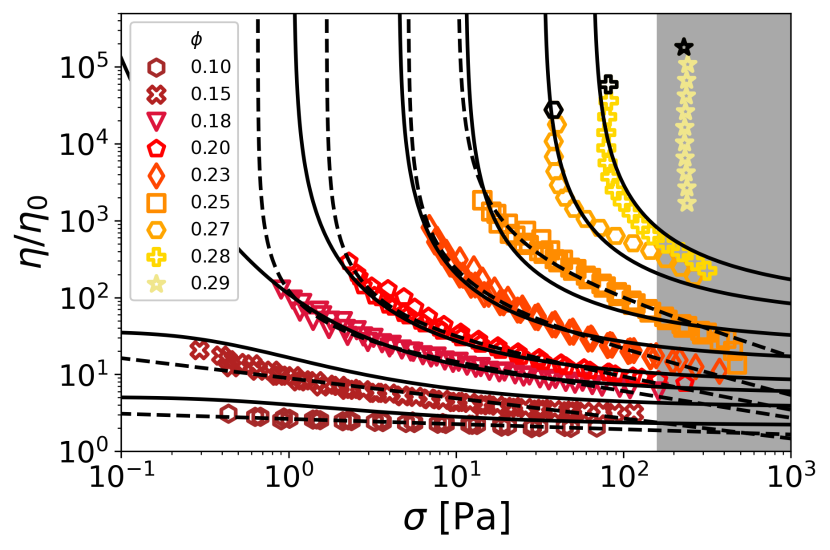
Sample fracture was observed at , so that the data in the shaded region in Figure 5 are not used for fitting. Fitting to the rest of the data gives for the release of adhesive rolling constraints, with an exponent . The latter is in line with previous work that found Guy2018; Richards2021, evidencing a similar rate of release of rolling constraints.
Our fitted value of is close to obtained from the consistency index data from fitting to the KD equation, Figure 6c. This concentration is where friction alone suffices to cause jamming, and is well below the random loose packing limit for monodisperse frictional spheres, even in the limit of infinite static friction, where Silbert2010. Interestingly, this latter value appears not particularly dramatically sensitive to details of particle morphology, as fitting the same model to suspensions of more or less isotropic calcite crystals also returns Richards2021. However, gross changes in morphology do have an effect. Fitting in suspensions of prolate wollastonite with a mean aspect ratio of 9 suspended in silicone oil returned -0.34 Mueller2010, which is close to the value for our suspensions of oblate and needle-shaped graphite particles. While polydispersity will increase doi1988; Farr2009, in our case, the non-spherical particle morphology apparently completely counteracts this effect.
Equation 5 is one of the key predictions of the adhesive constraint model. It shows that a finite yield stress should only emerge at ; thereafter, increases until it diverges at . To test this prediction, we collected flow curves at three additional higher volume fractions, and 0.29, Figure 5, to obtain over as wide a range of as possible. The yield stresses for these three flow curves were obtained by eye as the highest stress value reached in each case (sometimes called the ‘apparent yield stress’ Barnes1999). These three yield stresses are plotted together with those obtained by fitting the HB equation in Figure 7a. Equation 5 (the full line) with the constraint-model parameters from Figure 5 is seen to be consistent with this data. Below , adhesive contacts are insufficient to stabilise frictional force chains Richards2020 so that a non-flowing state never forms – there is no yield stress. At , frictional force chains are stable irrespective of adhesion, and the system is permanently jammed. The latter is also evidenced by a plot of the high-shear viscosity against volume fraction, Figure 7b, which shows a divergence at a concentration that is consistent with .
It is intriguing that our fitted value of is comparable to that found for suspended particles of adhesive calcite Richards2021 and PMMA Guy2018 ( and 0.20 respectively) even though our fitted value of is considerably below the value of obtained for these two systems. Intuitively, one may expect adhesive loose packing to correlate with contact percolation. Particle clusters in sheared non-colloidal suspensions may form a percolated network around a volume fraction of for monodisperse spheres Gallier2015, with lower thresholds for anisotropic particles. So, carbon nanotubes may percolate at as low as 0.3-0.8 wt.% in polycarbonate Abbasi2009, corresponding to . Similarly, the electrical percolation threshold of polymer composites decreases with filler aspect ratio Antunes2011. We may therefore expect for our flake-like graphite particles to be lower, if not significantly lower, than that in adhesive PMMA spheres Guy2018 or calcite crystals that do not show gross geometric anisotropy Richards2021. These considerations suggest that contact percolation alone is insufficient for adhesive loose packing. This is expected from the physical picture associated with the adhesive constraint model Richards2021, that is the lowest concentration at which adhesive contacts can stabilise frictional force chains to cause jamming. In other words, these contacts do not act alone, so that percolation per se is insufficient, explaining the observation that the fitted in our graphite suspensions is considerably higher than what one may expect to be needed for contact percolation alone.
Finally, we return to the unexpected temperature-dependent flow behaviour, which manifested as a sharp increase in the TTS shift factors above , Figure 4b. Plotting the relative viscosities at C, C and C against the shear stress, we see that data collapse becomes progressively worse as increases, and becomes very noticeable for , Figure 8a. However, we find that shifting the stress by a temperature-dependent factor, , improves the data collapse noticeably, especially at , Figure 8b. Fitting the resulting flow curves to the adhesive constraint model, Figure 8c, using a fixed -value, and then suggests a temperature-dependent characteristic adhesive stress , which, as expected, is anti-correlated with the temperature-dependent shift factor , Figure 8d.
The finding that decreases with temperature suggests rolling constraints are more easily released at higher temperatures. The origin of this effect in our system is currently unobvious. The van der Waals interaction should be temperature-independent in our temperature range Israelachvili1992, so that there is another source of rolling constraint that is more specific to our graphite suspensions. It would be fruitful to examine whether solvent-mediated interactions, such as improved wetting driven by a decreased oil surface tension with temperature could be the source of this temperature dependence. Whatever its source, a temperature-dependent provides a handle for controlling the rheology of our system. (Note that such temperature variation in does not change the critical packing limits in Equation 5, only the relative magnitude of the yield stress.)
V Conclusion
Polydisperse flake-like graphite particles suspended in heavy mineral oil were investigated using rotational rheometry. Sweeping highlow shear rates resulted in lower viscosities at low shear rates than sweeping lowhigh. We suggest that this is because the graphite particles are initially in a clustered state, which breaks down at high shear rates and causes orientation of fillers in the flow. Time-temperature superposition of the flow curves revealed an Arrhenius-type dependence of the horizontal shift factors with an increasing flow activation energy with filler concentration above a threshold graphite volume fraction .
We were able to account for our observations by fitting to a recent constraint-based model of non-Brownian suspension rheology Richards2020 in which frictional and adhesive contacts constrain sliding and rolling motion, respectively. Above a critical concentration , adhesive stabilisation of frictional force chains gives rise to a finite yield stress, which diverges at a higher , at which frictional contacts alone suffice for mechanical stability. At all , stress-induced release of adhesive rolling constraints causes shear thinning, allowing particles to align themselves in the flow direction.
Our analysis suggests a temperature-dependent characteristic adhesive stress that decreases with temperature. Further investigations are required to determine the underlying cause of this observation. The adhesive stress should be related to a critical torque to peel apart adhesive contacts between particles with a mean size Guy2018, so that the temperature-dependence we observe should also manifest in single-particle measurement of the contact tribology Heim1999.
Finally, and more generally, that the adhesive constraint model Richards2020 can give a credible account of data for PMMA spheres in oil Guy2018, cornstarch in oil Richards2020, calcite in glycerol-water Richards2021 and molten chocolate (= sugar grains in oil) Blanc2018, and now, plate-like graphite in oil, suggests that the micro-physical basis of this model may be sound. In particular, our finding that is significantly higher than what one might expect from contact percolation alone in flake-like particles provides support for the suggestion Richards2020; Richards2021 that yielding behaviour is due to the combined action of adhesive contacts stabilising frictional force chains. Our work therefore illustrates the advantage of fitting data using such a model compared to a purely phenomenological equation such as the Herschel-Bulkley model. A physics-based model permits inference about microscale mechanisms, such as temperature-dependent adhesive contacts, which are susceptible to further experimental testing.
Acknowledgements.
This work was financially supported by Advent Technologies A/S and a grant from the Industrial PhD programme, Innovation Fund Denmark, project 8053-00063B.Data Availability Statement
The data that support the findings of this study are available from the corresponding author upon reasonable request.