Elastoresistivity in the incommensurate charge density wave phase of BaNi2(As1-xPx)2
Abstract
Electronic nematicity, the breaking of the crystal lattice rotational symmetry by the electronic fluid, is a fascinating quantum state of matter. Recently, BaNi2As2 has emerged as a promising candidate for a novel type of nematicity triggered by charge fluctuations. In this work, we scrutinize the electronic nematicity of BaNi2(As1-xPx)2 with using electronic transport measurements under strain. We report a large elastoresistance coefficient that is maximized at a temperature slightly higher than the first-order triclinic transition, and that corresponds to the recently discovered tetragonal-to-orthorhombic transition [1]. The reported elastoresistance does not follow the typical Curie-Weiss form observed in iron-based superconductors but has a much sharper temperature dependence with a finite elastoresistance onsetting only together with a strong enhancement of the incommensurate charge density wave of the material. Consequently, the elastoresistance and the associated orthorhombic distortion appears here as a property of this incommensurate charge density wave. Finally, we report and track the hysteretic behavior seen in the resistance versus strain sweeps and interpret its origin as the pinning of orthorhombic domains. Our results revise the understanding of the interplay between nematicity, charge density waves and structural distortions in this material.
I Introduction
With the discovery of iron-based superconductors [2], electronic nematicity has emerged as a potential key ingredient for high-temperature superconductivity. Indeed, the observation of strong electronic nematic fluctuations at the optimal conditions for superconductivity suggests that such fluctuations might promote higher [3, 4, 5, 6, 7]. This view is supported by reports for nematicity in other unconventional superconductors as heavy fermions [8, 9] or cuprates [10, 11, 12, 13, 14, 15, 16].
Nonetheless, the best-understood case is by far the one of the iron pnictides, where the electronic nematic fluctuations induce a tetragonal-to-orthorhombic phase transition at . The nematic transition, when not coincident to, is closely followed by antiferromagnetic order at [17, 18, 19]. From this empirical observation and theoretical considerations [6] anisotropic magnetic fluctuations are a leading candidate for the mechanism of nematicity in iron-based superconductors. However, beyond the iron pnictides case, and in particular in the absence of long-range magnetic order [20, 21, 22, 23, 24, 25], much remains to be understood about the mechanisms of electronic nematicity and its significance for superconductivity.
In this regard, BaNi2As2, that shares the same high temperature tetragonal structure as the intensively studied BaFe2As2, has recently attracted attention. In contrast to its iron-analogue, BaNi2As2 is superconducting below K at ambient pressure [26] and hosts two types of charge density waves (CDWs). Upon cooling, first appears an incommensurate charge density wave (I-CDW) that develops strongly at K. A weaker diffuse signal can be tracked all the way up to room temperature [1, 27, 28]. The exact nature of this I-CDW is currently under intense investigation. The reciprocal space pattern of the I-CDW superlattice peaks reported by x-ray diffraction experiments indicated that the charge modulation is unidirectional [29, 30, 1, 27]. Thus, it has been initially linked to a breaking of the crystal lattice rotational symmetry [29, 31]. Although, from a wide reciprocal lattice mapping it has been later suggested that, overall, the I-CDW is a biaxial, rotationally invariant state [30], a clear rotational symmetry breaking has been recently observed within the I-CDW phase by high-resolution thermal expansion measurements [1, 32]. At a slightly lower temperature a commensurate uniaxial charge density wave (C-CDW) develops at the expense of the former [29, 30, 1, 27, 28] and is associated to a first-order triclinic structural transition at K. This latter coincident transition is suppressed through numerous chemical substitutions at a critical value, [29, 30, 27, 33, 34, 1, 26].
Despite the absence of static magnetism down to lowest investigated temperature [35] possible indications for electronic nematicity have been reported. First, in Ba1-xSrxNi2As2 strain-dependent electrical transport measurements, namely elastoresistance, have been interpreted as a signature of a large electronic nematic susceptibility upon approaching the triclinic phase transition in substituted samples [31]. Second, a continuous orthorhombic transition was recently found to precede the triclinic one in Ba(Ni1-xCox)2As2 and BaNi2(As1-xPx)2 [1, 32]. Unlike in BaFe2As2 the in-plane orthorhombic axes are aligned with the tetragonal ones and the associated lattice distortion is much smaller. By analogy with the iron pnictides, it was proposed that this intermediate phase with broken rotational symmetry is a possible manifestation of charge-induced nematicity [1].
In addition, the superconducting has been found to sharply increase to K for substitution levels just above the suppression of the triclinic and C-CDW transition, but the origin of this enhancement is still debated. In Ba1-xSrxNi2As2 it has been associated with electronic nematic fluctuations [31], while in BaNi2(As1-xPx)2 it has been attributed to an enhanced electron-phonon coupling through a lattice softening [34].
Thus, it is critically needed to assess the possible advent of electronic nematicity in these materials, and establish its interplay with the aforementioned lattice and electronic instabilities. In this work, we investigate the electronic nematicity of BaNi2(As1-xPx)2 with , a system for which the tetragonal-to-orthorhombic transition is established [1, 32], using elastoresistance measurements. We report a large maximum of the -symmetric elastoresistance coefficient, , that occurs, up to , at the temperature of the orthorhombic transition, where the rotational symmetry is broken. Importantly, the elastoresistance onset corresponds to a strong increase in the I-CDW superlattice peak intensity that cannot be described by a Curie-Weiss-like temperature dependence. Thus, the anisotropic strain dependent electrical transport is a property of the I-CDW phase. Finally, a careful investigation of the hysteretic behavior of the resistance versus strain sweeps strongly suggests that the hysteresis originates from the pinning of orthorhombic domains.
II Results
II.1 Experimental details
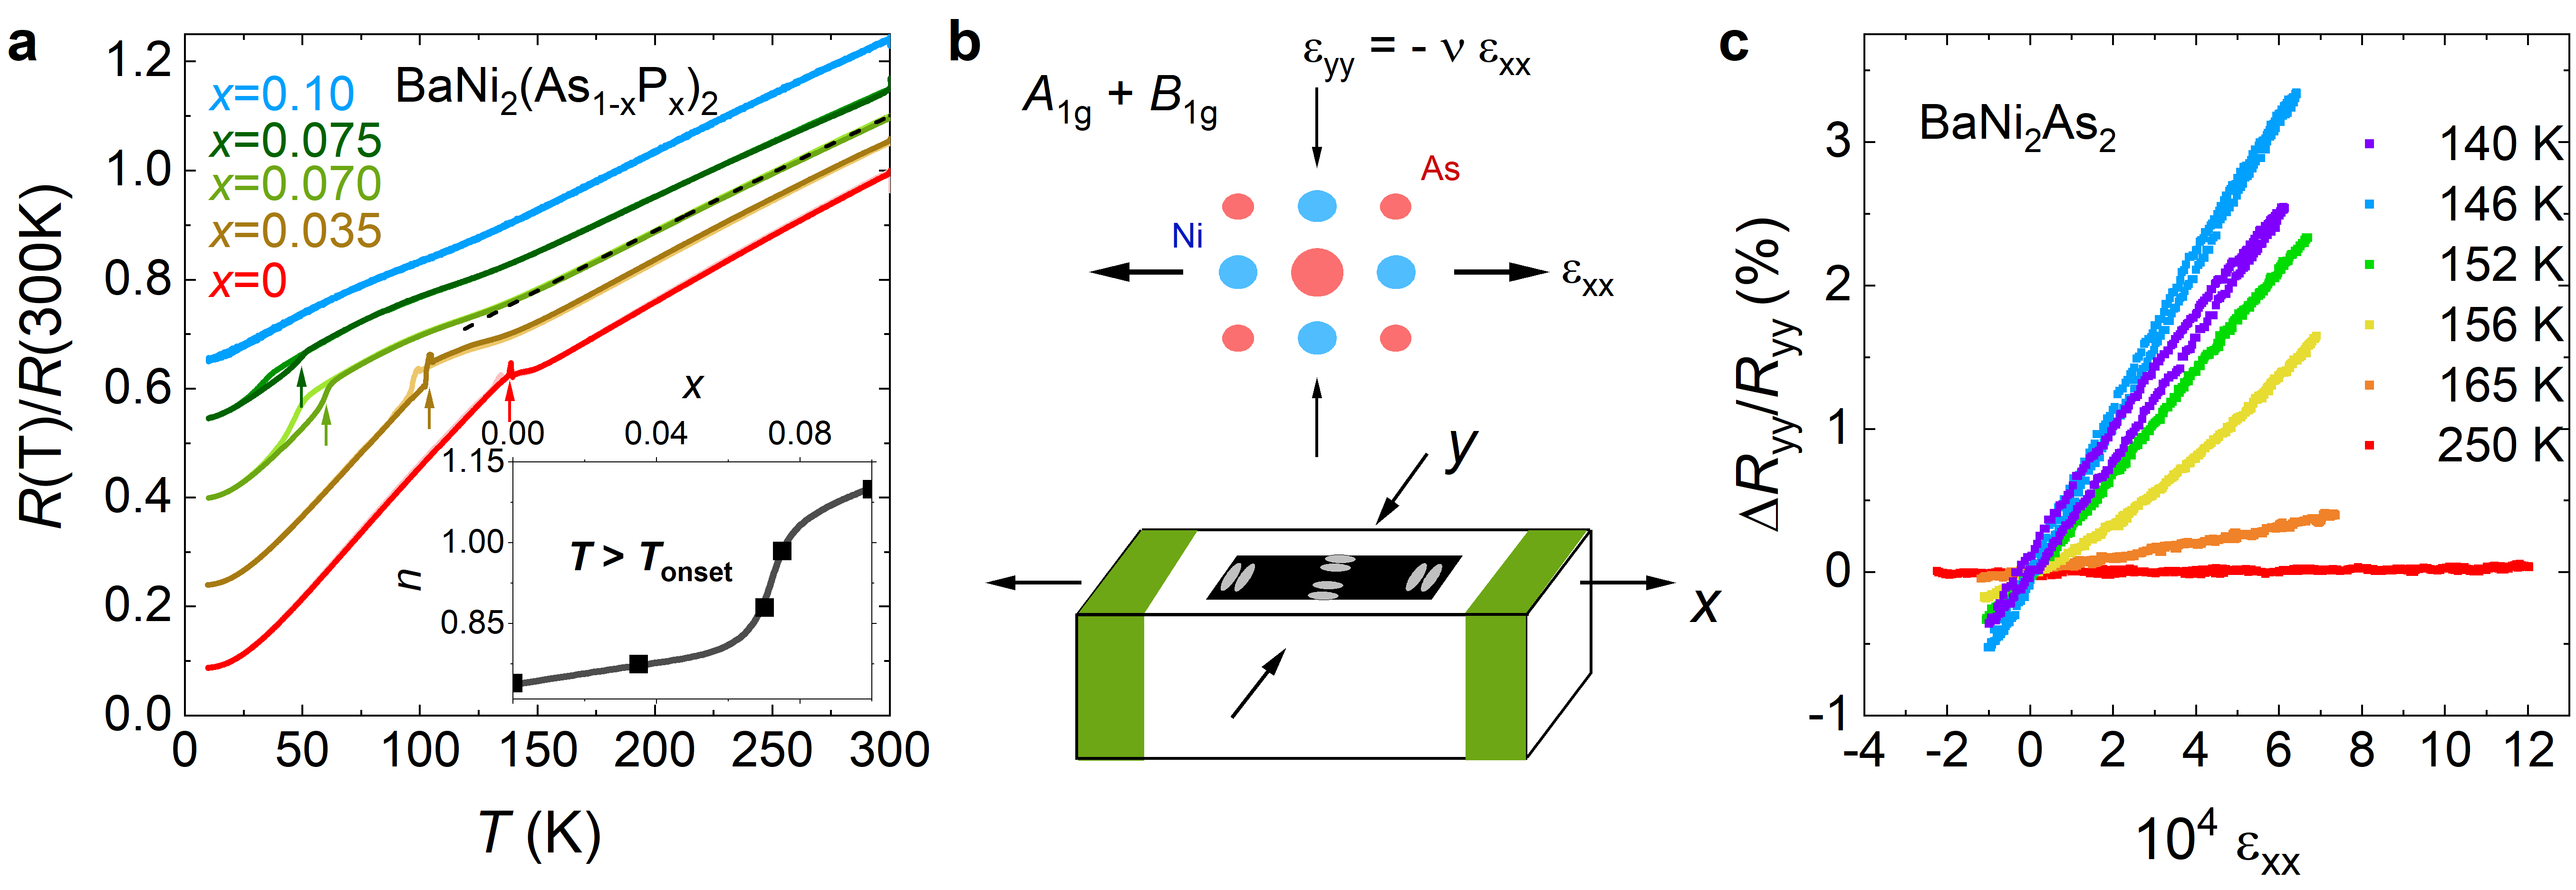
We start by investigating the freestanding resistance of BaNi2(As1-xPx)2 single crystals in Fig.1a. A metallic behavior with residual-resistivity ratio (RRR) values in line with the literature [34, 26] is observed. For BaNi2As2 RRR i.e. approximately the value found in BaFe2As2 [36]. In agreement with previous reports a sharp increase of electrical resistance occurs at K upon cooling in BaNi2As2, signaling the triclinic structural transition [34, 26]. The hysteresis indicates the first-order nature of the transition. Upon increasing P-substitution this transition is shifted towards lower temperature, the resistance upturn becomes a downturn, and the width of the thermal hysteresis increases. No such transition is observed for , where cooling and warming measurements overlap, indicating a critical doping for the triclinic phase , in agreement with the literature [27, 34, 32].
At low temperature, and except at the highest () P-content, the electrical resistance does not follow a temperature dependence [26, 32]. At high enough temperatures the resistance is well described as (see dashed blacked line in Fig.1a for ), with and being -dependent. As seen in the inset of Fig.1a the exponent shows a significant increase across the triclinic critical point, and in particular , i.e. a linear-in-temperature resistance is observed within a narrow substitution range around , whose origin is still unknown (more details on the fitting are given in SM section I).
In order to study the elastoresistance of BaNi2(As1-xPx)2, we induce a symmetry-breaking strain to our single crystals by gluing them on top of a piezo stack as visualized in Fig.1b, a technique initially used in strongly correlated systems in Ref. [3]. This method allows to extract the elastoresistance coefficients defined as , where j denotes the direction of the strain and (resp. ) corresponds to longitudinal (resp. transverse) measurements with respect to the piezo poling axis, . In the following, we use the Voigt notation for the elastoresistance coefficient, in particular and , and formulate in terms of the irreducible representations of the high-temperature tetragonal point group.
With the [100]tet axis aligned to the piezo stack poling direction, as done in the following, the in-plane resistance anisotropy that develops under strain is proportional to the symmetry-resolved elastoresistance coefficient, ,
| (1) |
Since for sufficiently small anisotropy any potential electronic nematic order parameter is proportional to the resistance anisotropy, the associated electronic nematic susceptibility in the channel is probed by the elastoresistance coefficient [3, 37, 31, 38].

II.2 Elastoresistance of BaNi2As2
A typical example of raw data in BaNi2As2 in the transverse geometry is shown in Fig.1c. The corresponding detailed temperature dependence of the elastoresistance measurement is reported in Fig.2.
First, we show the normalized resistances as a function of temperature with the sample being glued to the piezo, see Fig.2a. While both longitudinal and transverse directions (squares and circles, respectively) overlap at high enough temperature, a clear discrepancy appears below K, that corresponds to the second-order orthorhombic transition temperature, , as determined by thermal expansion measurements [1, 32]. This observation evidences that, within the orthorhombic state, the sample is, at least partially, detwinned through the anisotropic thermal expansion of the piezo (see SM section II) and the resulting strain.
The normalized freestanding resistance (dark and light red lines for the warming and cooling measurement, respectively), reproduced from Fig. 1a, also overlaps with that of the sample glued to the piezo down to K. However, at lower temperatures a difference appears which can be attributed to the differential thermal expansion of the piezo and BaNi2As2 together with the emergence of a finite elastoresistance. The similar resistivity values observed in the longitudinal and transverse channels down to are also in line with the mainly in-plane isotropic strain arising from the thermal expansion mismatch (see details in SM section II) and points to a finite in-plane symmetric elastoresistance.
While the gluing induces a broadening of the triclinic transition as seen by electrical transport, a thermal hysteresis is still clearly observed in these strained conditions and the transition temperature is not substantially shifted. Finally, note that the sign of the resistance anisotropy in the orthorhombic state is similar to the one in BaFe2As2, i.e. the smaller in-plane orthorhombic axis (aligned with the piezo axis) is the one with the higher resistivity [37, 36].
The linear slopes of the resistance versus strain sweeps, , are reported in Fig.2b. Note that they are extracted during the same temperature cycle as the corresponding resistances of Fig.2a, upon applying a voltage to the piezo stack at fixed temperatures. At high temperature no response to strain is seen in any channel, in agreement with the overlap of the respective electrical resistances. However, below K an elastoresistance signal develops sharply in both directions and peaks at , with an opposite sign along the two directions. Thus, the symmetric elastoresistance coefficient extracted from the difference of the longitudinal and transverse measurements is maximum at (see Eq.1 and Fig.3a; in the followings is formally defined as the temperature of the maximum). Notably, no strong feature appears at the triclinic transition temperature. This bring us to our first important result: the -symmetric maximum occurs at the orthorhombic transition rather than at the triclinic one, in contrast to what has been previously reported for Sr-substituted samples [31]. This is fully consistent with the 4-fold symmetry breaking that occurs at the orthorhombic transition [1, 32] and the absence of thermal hysteresis in the elastoresistance response, in particular around (see also additional measurements in SM section III).
II.3 Evolution with P-concentration
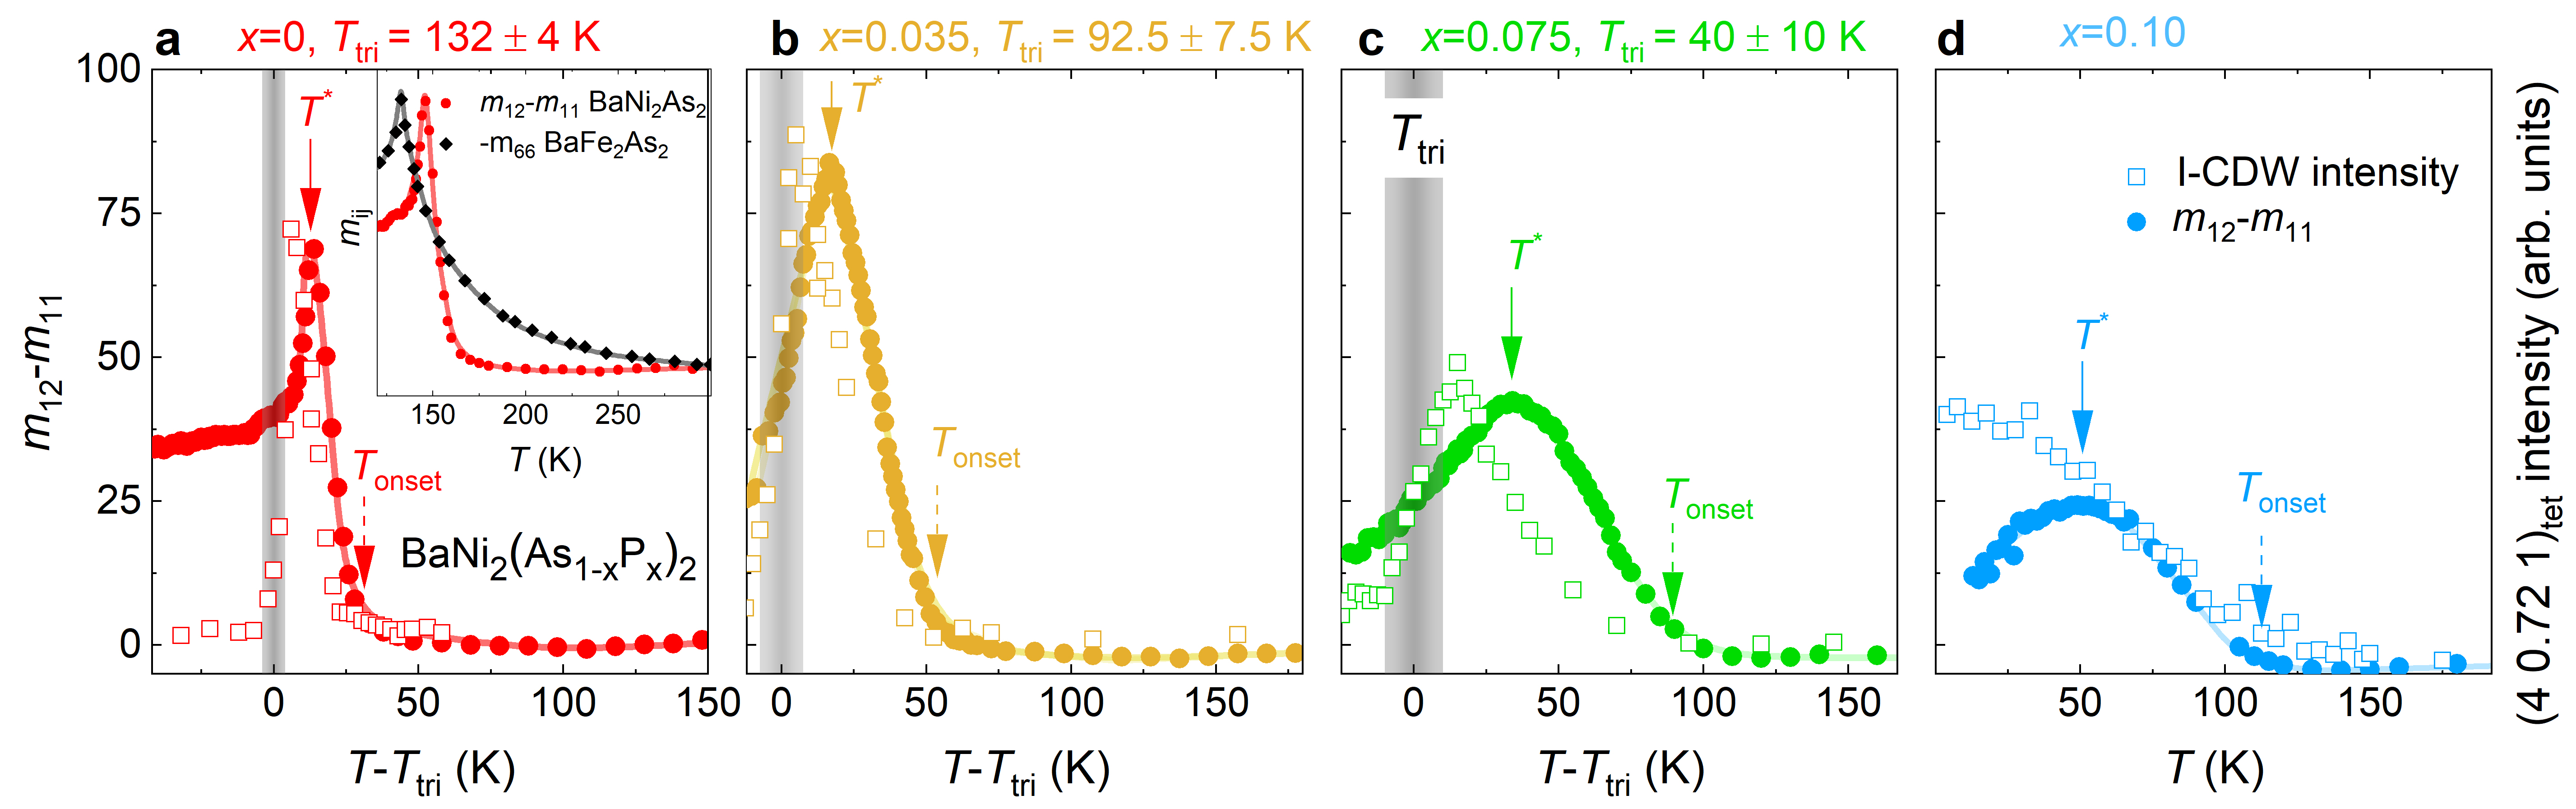
The elastoresistance coefficient at the different P-contents investigated is shown in Fig.3b-d, as a function of , where the triclinic transition temperature and the elastoresistance coefficient are extracted upon cooling. A maximum of the elastoresistance is found up to the highest concentration investigated at temperature exceeding the triclinic transition. Rather, up to , is in good agreement with as determined by thermal expansion. With increasing substitution level, decreases smoothly towards K for where the associated elastoresistance maximum becomes weaker and significantly broader. In particular, there is no enhancement of associated to the enhanced superconducting in the absence of the triclinic structure for . Note that for no orthorhombic distortion is observed by high-resolution thermal expansion, which shows however a clear signature of a (different) first-order transition [32]. This is most likely not directly related to the elastoresistance maximum since, as for lower P-contents, no evidence for a thermal hysteresis is observed. We discuss this particular case later.
A fundamental aspect is the comparison between the temperature dependences of the elastoresistance coefficient and of the I-CDW superlattice peak intensity recorded at (empty squares, reproduced from Ref. [27]). Using samples from the same batches across the entire substitution range investigated, we find that both quantities onset at very similar temperatures. The elastoresistance coefficient is negligible above , that corresponds to a strong increase in the I-CDW superlattice peak intensity. Thus, a large coefficient is a property of the incommensurate charge density wave phase and the associated fluctuations.
Finally, the maximum value of the elastoresistance coefficient displays a non-monotonic dependence on P-concentration and is highest at , an observation that is reminiscent of Ba1-xSrxNi2As2 [31]. While this might be an artefact of strain transmission, one possible alternative scenario, that remains to be investigated, is a stronger orthorhombic distortion at this particular substitution content.
II.4 Strain hysteresis
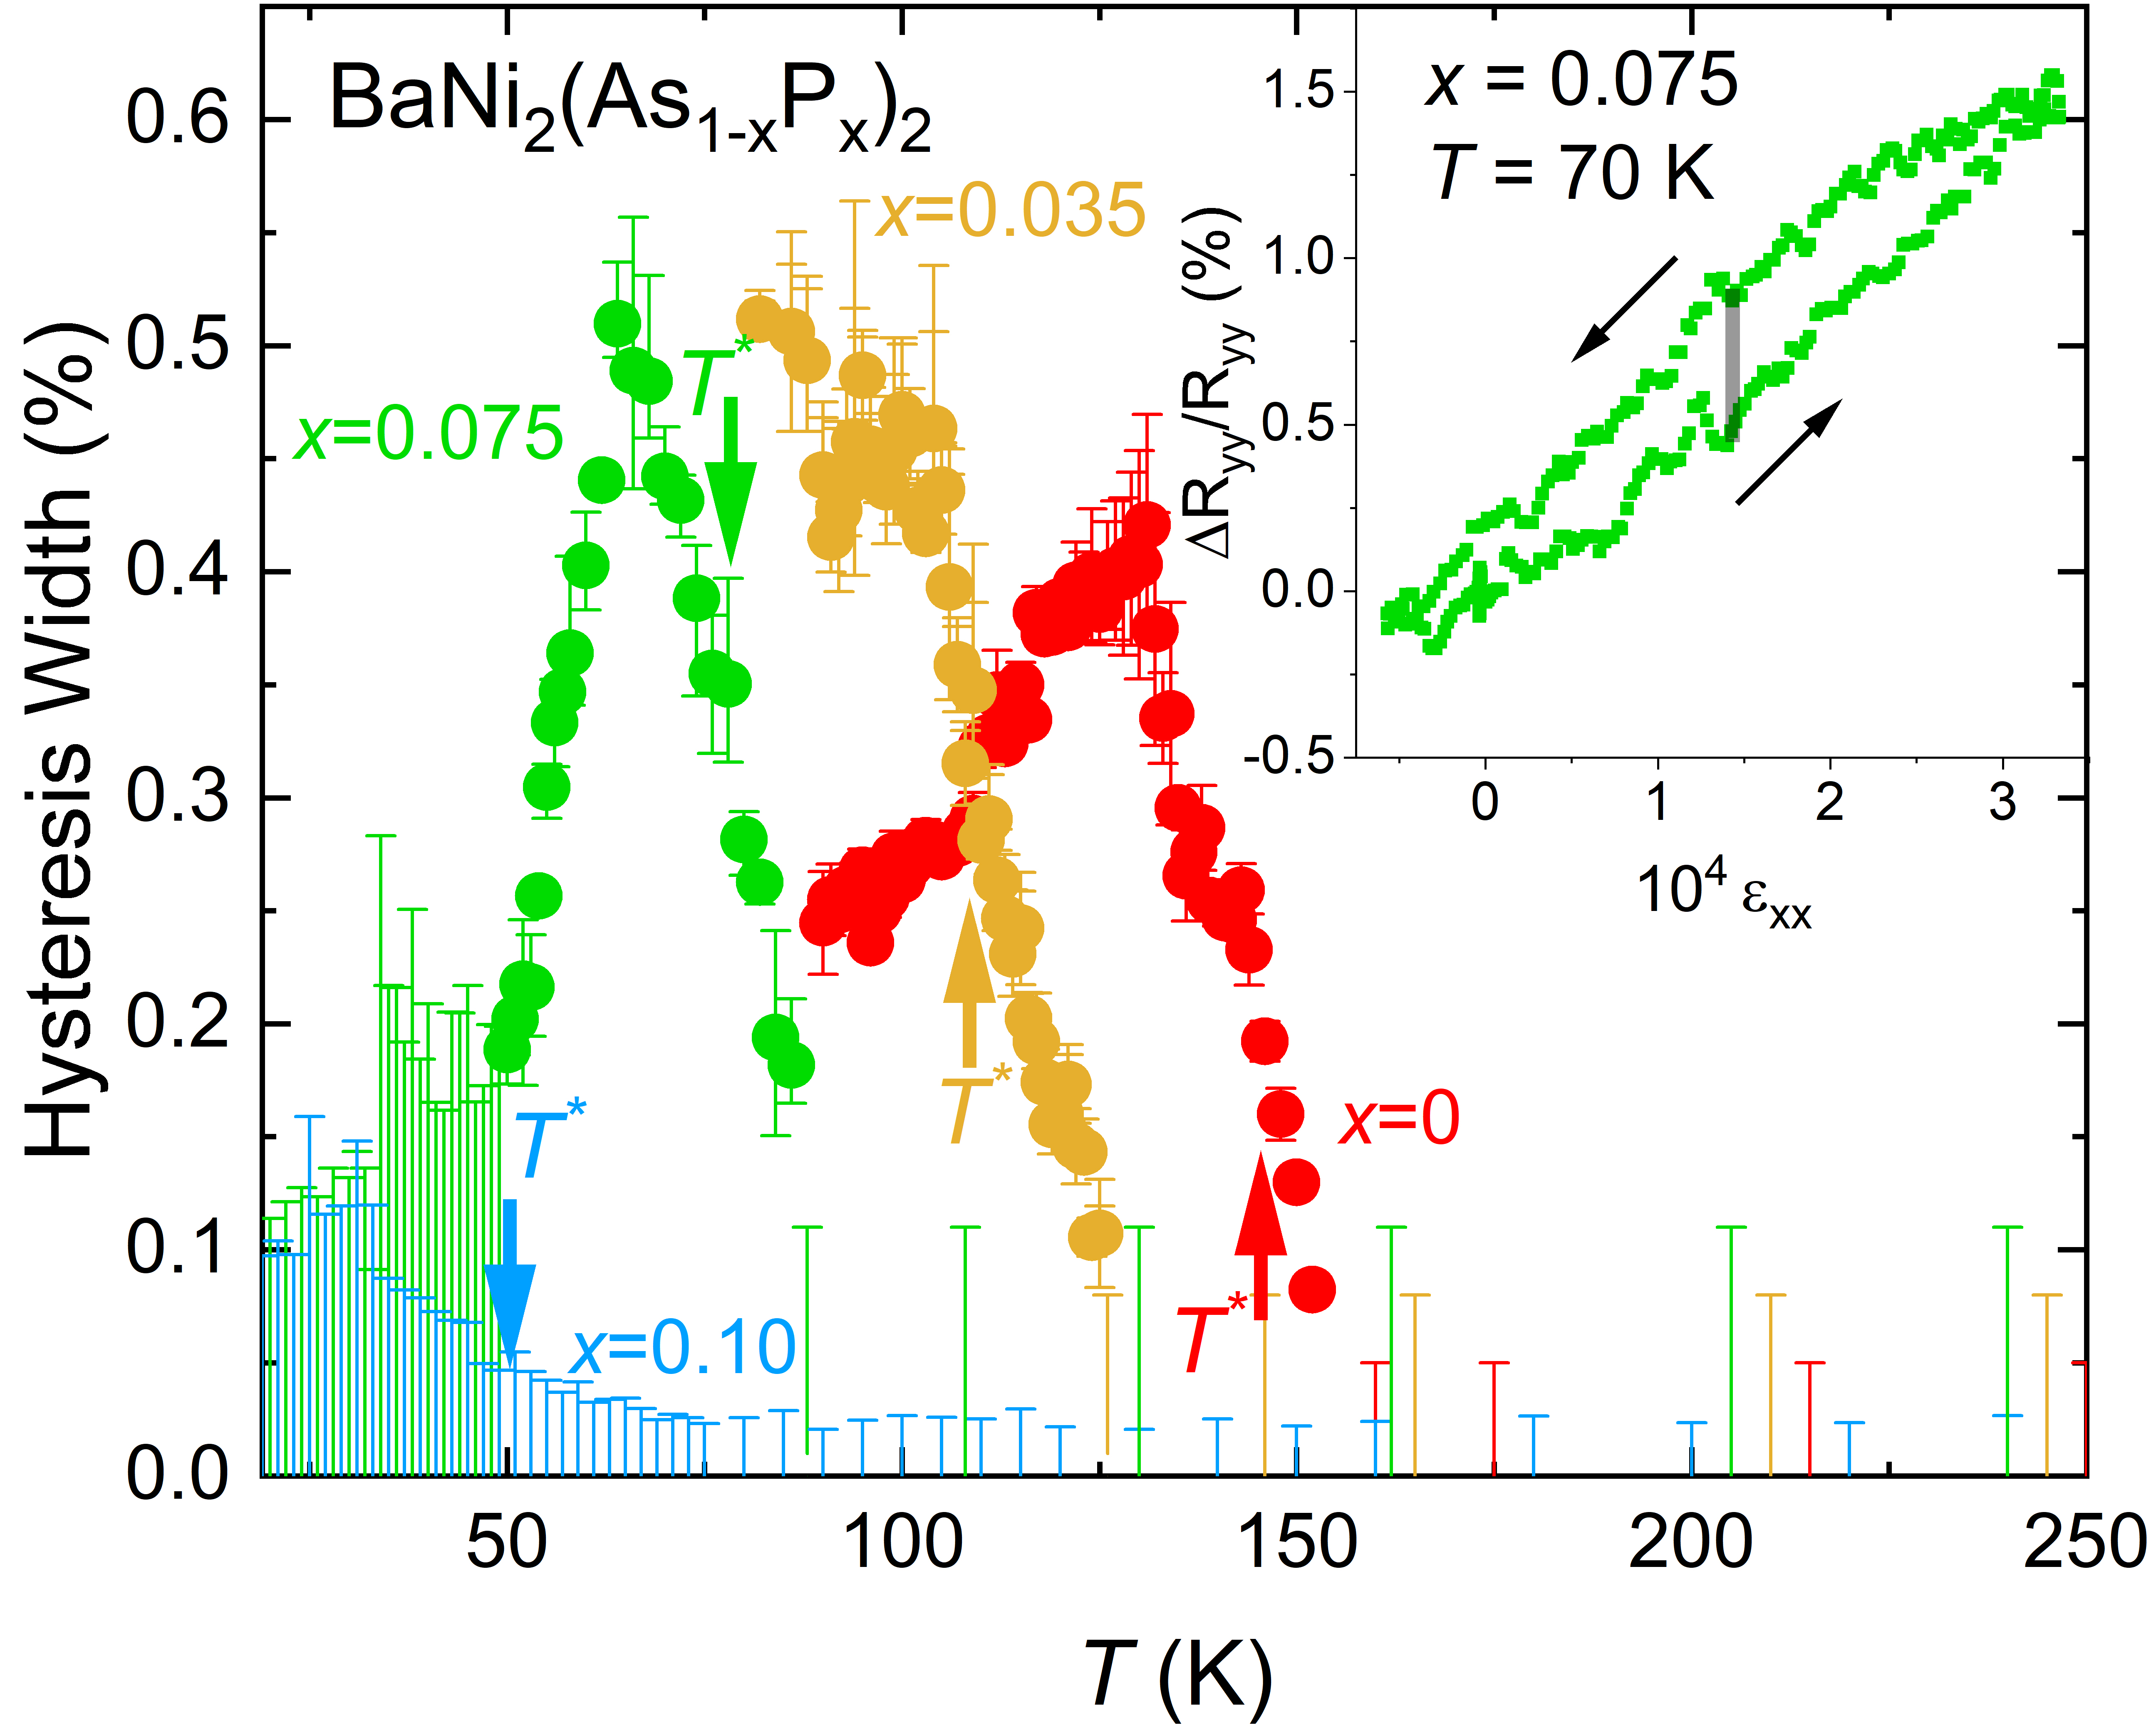
A peculiar feature of the reported elastoresistance is the presence of reproducible hysteresis in the resistance versus strain sweeps (see Fig.1c). This was previously reported in Ba1-xSrxNi2As2 and attributed to the pinning of static nematic domains by the I-CDW [31, 30]. Similar hysteresic behavior was also observed in Te3 (= Tm, Er) and ascribed to a first-order reorientation of the CDW wavevector with uniaxial stress [40].
In Fig.4 we report the evolution of the hysteresis width, i.e. the maximum difference of the relative resistance variation between the up and down strain sweeps (see inset), as a function of P-substitution and temperature. In all samples at high temperature no hysteresis is seen, i.e. the response of electrical resistance to strain appears perfectly reversible. In that case, we can only define an upper limit on the unresolved and/or non-existent hysteresis width based on the experimental noise. This is depicted as vertical error bars extending to zero. Below a substitution-dependent temperature a finite hysteresis is resolved, meaning in particular that the hysteresis width is larger than the experimental noise. Note that only for no finite hysteresis is resolved down to the lowest temperature (see SM section IV).
For all other substitution levels we observe a rather sharp increase of the hysteresis width across the temperature of maximum elastoresistance (see arrows). While for BaNi2As2 a finite hysteresis is found to emerge at within resolution, in agreement with Ref. [31], this is not the case in P-substituted samples. Since the hysteresis width significantly increases across for one likely scenario is that the hysteresis is associated to the pinning of orthorhombic domains. This is consistent with the orthorhombic domains orientation [1]. Testing this scenario would require measurements under larger strain and a precise knowledge of the temperature and substitution dependencies of the spontaneous orthorhombic distortion [41]. The remarkable absence of a finite hysteresis at might be a signature of the absence of the orthorhombic distortion, in line with the absence of the associated detwinning effect seen in thermal expansion measurements [32]. Finally, the hysteretic strain behavior persists into the triclinic phase where the associated structural and/or C-CDW domains probably play a major role.
III Discussion
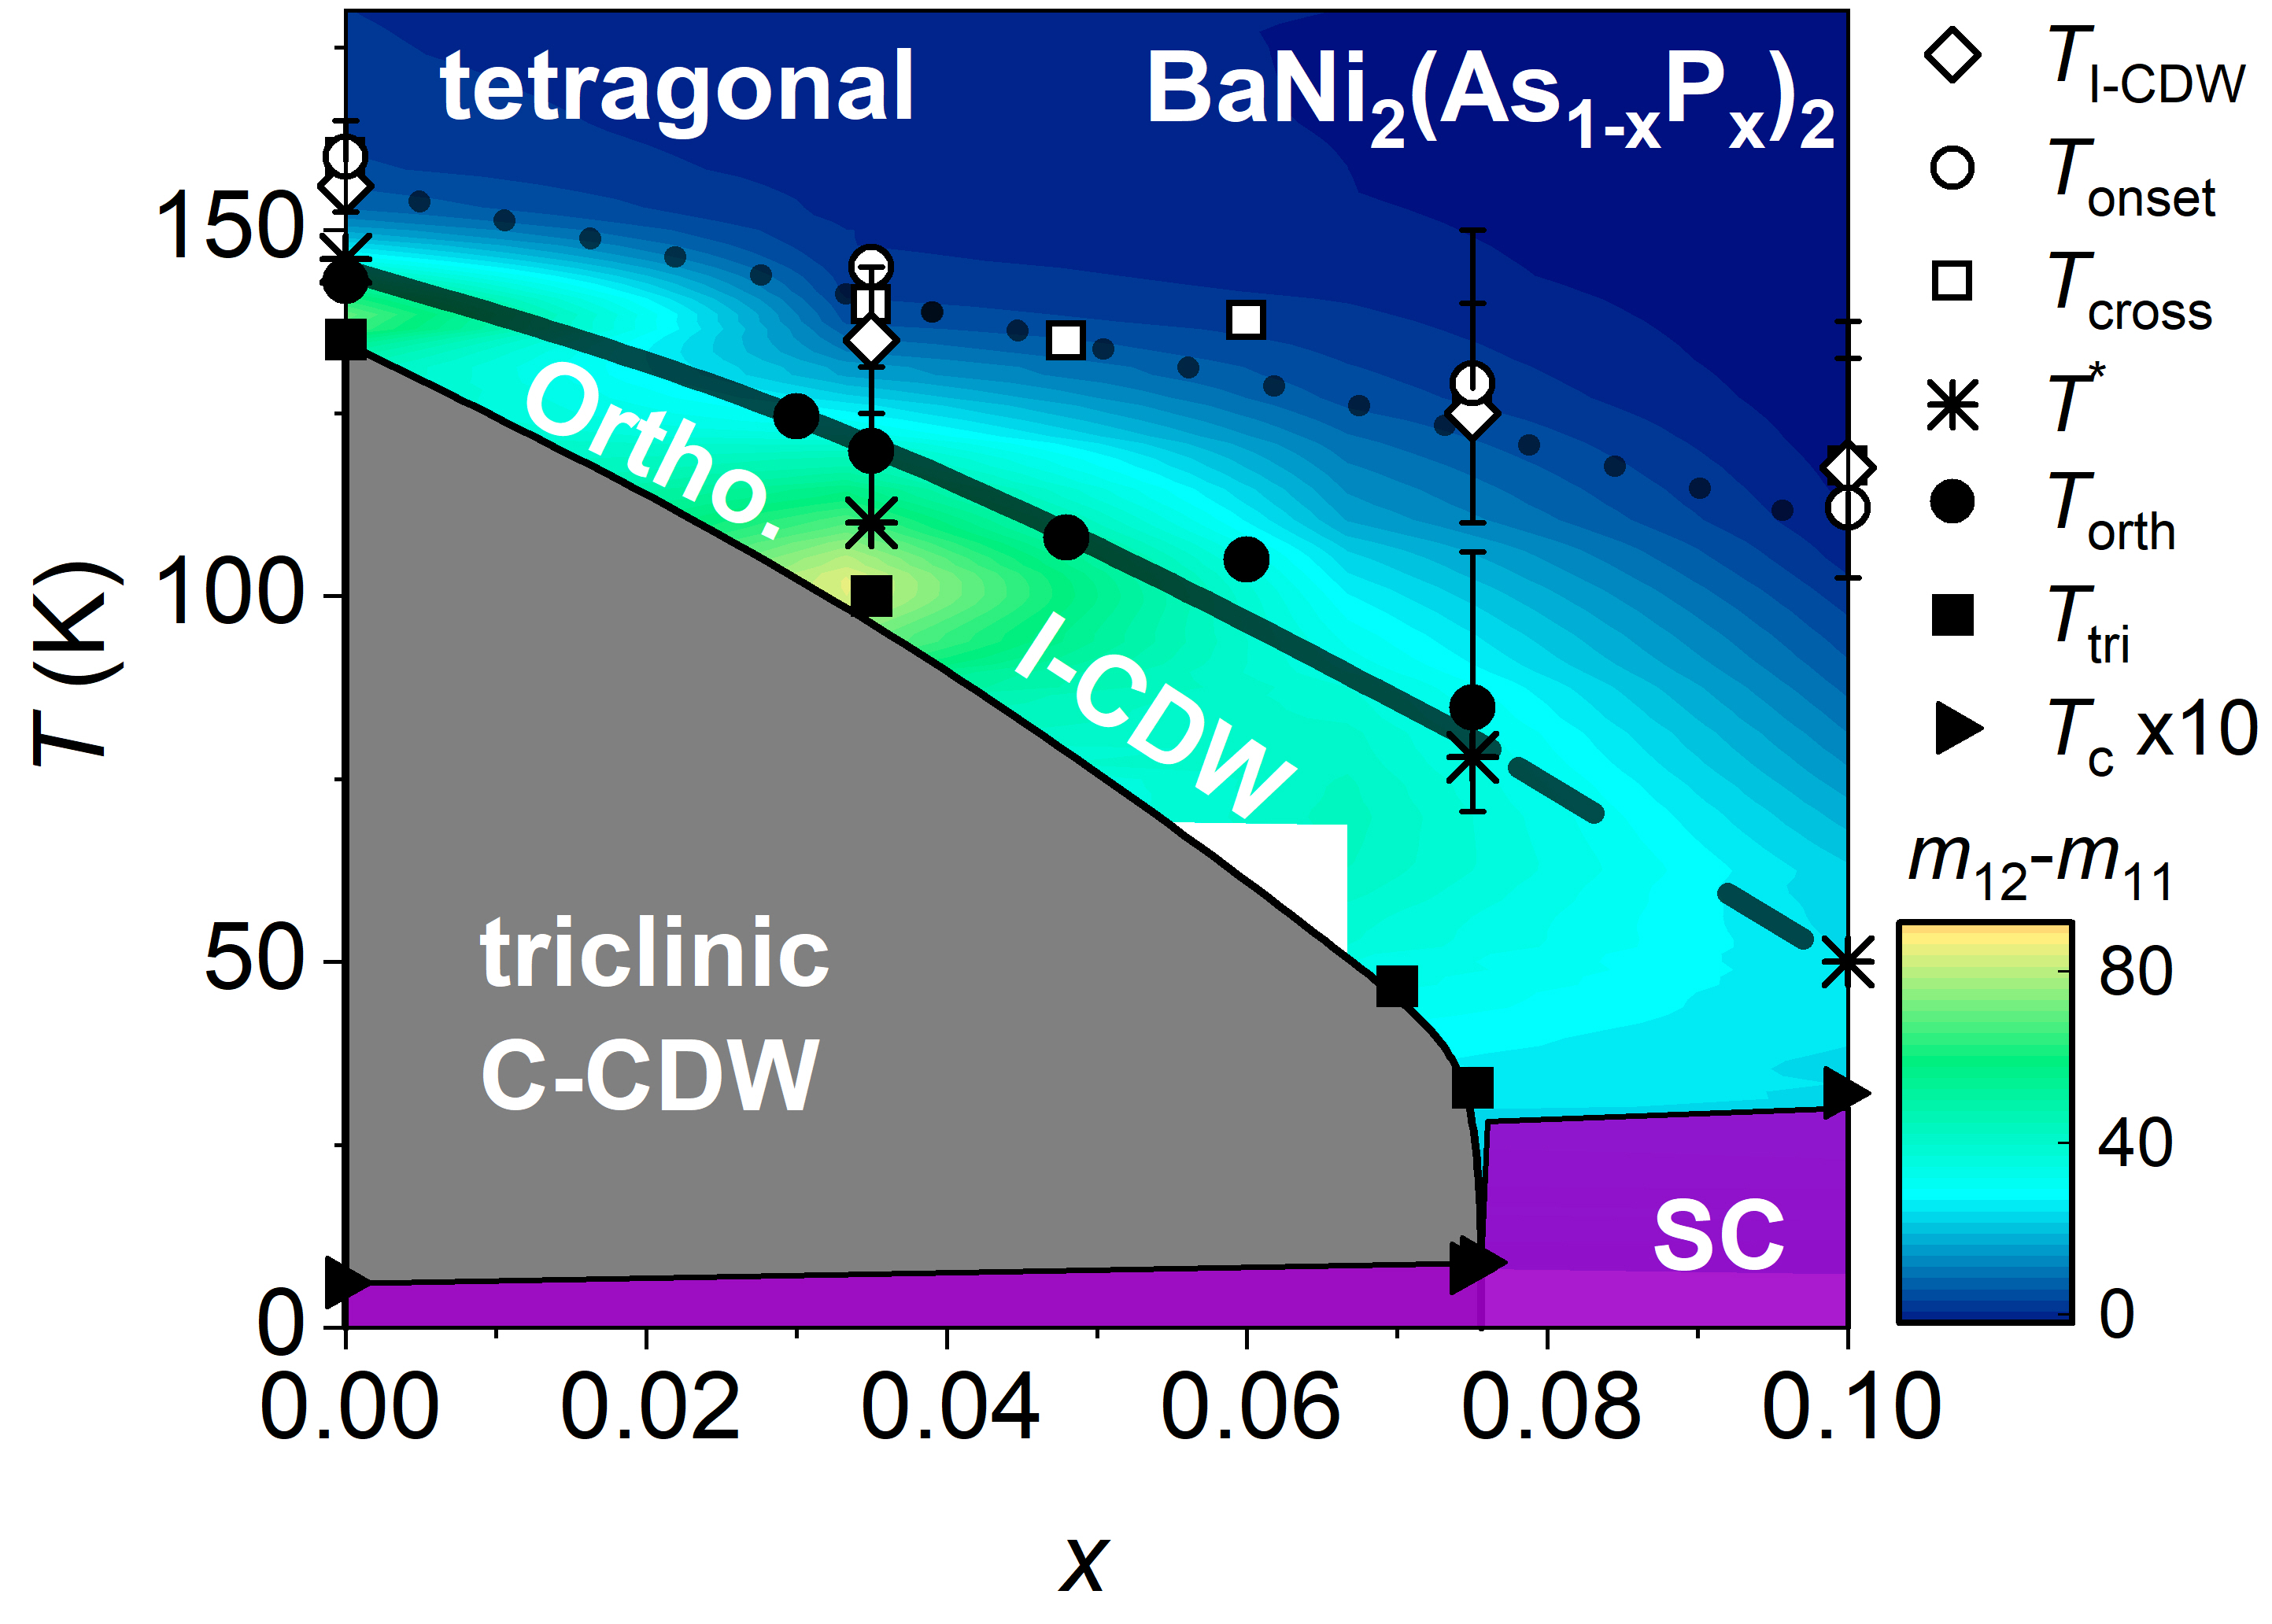
We summarize our results in a phase diagram, see Fig. 5. A large elastoresistance coefficient onsets together with the I-CDW phase and has a maximum at the orthorhombic transition up to . Remarkably, this elastoresistance onset also corresponds to a maximum in the crystallographic ratio which occurs at the temperature reproduced from Ref. [32]. At , even though no orthorhombic transition has been reported by high-resolution thermal expansion [32] a weaker and broader maximum is found. In parallel, the hysteretic behavior of the elastoresistance reported at lower substitution levels is not resolved anymore. Notably, upon increasing substitution level, the enhanced superconducting above the triclinic critical point coincides with a reduction of , and not an enhancement. Together with the already K superconductivity of fully substituted BaNi2P2 [42], this observation strongly suggests that the superconductivity of BaNi2(As1-xPx)2 with is not significantly boosted by electronic nematicity.
We now consider in more details the elastoresistance signal itself. The advent of a large elastoresistance response maximized across the tetragonal-to-orthorhombic transition of BaNi2(As1-xPx)2 is certainly reminiscent of the electronic nematic transition of its iron-counterpart, BaFe2As2. However, there are fundamental differences between these two cases, which are highlighted in the following.
In the iron pnictides the elastoresistance coefficient, probing nematicity in the channel, follows a typical Curie-Weiss dependence over a wide temperature range of up to 100 K or more above the orthorhombic transition. Such a temperature dependence is expected on theoretical grounds for an electronically driven nematic transition [37, 3, 39, 36]. This temperature dependence is also observed above the nematic transition of FeSe1-xSx whose spin and/or orbital origin is still debated [20, 25, 43]. In sharp contrast, in BaNi2As2, , probing nematicity in the channel, increases only in the close vicinity of the orthorhombic transition and its onset corresponds to a strong increase in the I-CDW superlattice peak intensity seen in x-ray diffraction experiments. The difference is evident in the comparison shown in the inset of Fig.3a where BaFe2As2 is choosen as it shares a close orthorhombic transition temperature. While for the latter compound the elastoresistance coefficient can be tracked up to K above the nematic transition, for BaNi2As2 only K above . Hence, in BaNi2As2 the temperature dependence of the elastoresistance is very different from that of the well-established electronic nematic systems and in particular does not exclude a purely lattice-driven structural transition [4, 3].
With increasing substitution level, the maximum broadens, which can be ascribed to the broadening of the orthorhombic distortion seen in thermal expansion [32], the increasing disorder, and finally the effect of external stress applied across the orthorhombic transition from the thermal expansion mismatch with the piezo. The latter effect is significant when the externally applied strain is of the same order as the spontaneous orthorhombic distortion. We expect this situation to be realized in BaNi2(As1-xPx)2 where, within our experimental conditions, both quantities are [1, 27, 32] (see thermal expansion measurements in SM section II). In addition, as for , is negligible above , advocating for a similar origin. Finally, even in substituted samples, a Curie-Weiss susceptibility cannot fairly describe over a significant temperature range. Thus, in pure and P-substituted samples, the large elastoresistance coefficient is not an evidence for electronic nematicity, but is a property of the I-CDW phase. We note that the absence of a significant critical electronic nematicity is consistent with Young modulus measurements at [32] and an ARPES study of BaNi2As2 under uniaxial stress [44].
Let us now consider in more details the parallel strong increase of the I-CDW superlattice peak intensity and the onset of the elastoresistance coefficient. Regardless of the exact mechanism of formation of the I-CDW, its existence points to a significant coupling between the lattice and electronic degrees of freedom [45]. Perturbation of the charge ordered state can then be achieved when strain of the right symmetry is applied [40] and a corresponding electrical transport signature is expected through, for instance, modification of the Fermi surface [46]. Consequently, our observation of a large elastoresistance coefficient only for points towards a coupling between the I-CDW order parameter, the associated fluctuations, and the strain. In turn this observation strongly suggests an intimate relationship with the orthorhombic distortion, that manifests itself as a maximum, and that we interpret as a signature of the long-range order of the I-CDW. Importantly, this contrasts with Ba1-xSrxNi2As2 where, for , a large elastoresistance coefficient occurs in the absence of the I-CDW phase and where, additionally, the fate of the orthorhombic phase remains to be investigated [31, 30, 29]. Our results, in particular the significant sensitivity of the I-CDW to uniaxial stress, put strong constrains on the theoretical description of this phase. It should motivate a refinement of its real space structure, and spectroscopic studies under uniaxial stress. Another promising avenue for a deeper understanding of the exact relationship between I-CDW, elastoresistance and structural distortion is the recently developed in-situ combination of strain-dependent x-ray diffraction and electrical transport measurements [47].
Finally, we focus on a particularly intriguing case, BaNi2(As0.9P0.1)2, located above the triclinic critical point, . As for lower substitution levels, the onset of does correspond to a strong increase in the I-CDW superlattice peak intensity. However, as shown in Fig.4 a strain hysteresis is not resolved at this substitution content anymore. In parallel, no detwinning of the orthorhombic domains is seen in high-resolution thermal expansion measurements, questioning the occurrence of an orthorhombic phase transition for this composition. A first-order transition is observed in thermal expansion within the temperature range of the maximum [32], but the absence of a thermal hysteresis in the elastoresistance points toward a different origin. Moreover, the resistance measurements do not reveal any evidence of a phase transition in the vicinity of K (see SM section V). Noteworthy, the onset of the elastoresistance coefficient coincides with a lattice softening as seen by Young modulus measurements, which is argued to be incompatible with critical electronic nematicity [32]. The simultaneous maximum of elastoresistance and saturation of the softening below strongly suggests a close relationship between those two. The maximum, though broad, in the (likely) absence of an orthorhombic transition calls for further investigations.
In conclusion, we report a large -symmetric elastoresistance coefficient in the close vicinity of the tetragonal-to-orthorhombic transition of BaNi2(As1-xPx)2. While the observation of an elastoresistance maximum at this structural transition is certainly reminiscent of the iron pnictides, the temperature dependence of strikingly contrasts with known examples of electronic nematic transitions. In particular, it does not follow the typical Curie-Weiss-like form. Rather, the strong increase in the I-CDW satellite intensity observed in parallel to the onset of the elastoresistance signal indicates that the strain-dependent electrical transport is a property of the I-CDW phase. The weakening of the elastoresistance coefficient observed in parallel to the enhanced superconducting in the absence of the triclinic structure strongly suggests that the strain-sensitive electronic correlations revealed by elastoresistance are not responsible for the stronger superconductivity. Finally, a careful inspection of the hysteretic behavior of the resistance versus strain sweeps points to the pinning of orthorhombic domains as a likely origin.
IV Methods
IV.1 Single crystals growth and chemical analysis
Single crystals of BaNi2(As1-xPx)2 (with ) were grown using a self-flux method. NiAs binary was synthesised by mixing the pure elements Ni (powder, Alfa Aesar 99.999) and As (lumps, Alfa Aesar 99.9999) that were ground and sealed in a fused silica tube and annealed for 20 hours at 730 °C. All sample handlings were performed in an argon glove box (O2 content 0.5 ppm). For the growth of BaNi2(As1-xPx)2, a ratio of Ba:NiAs:Ni:P = 1:4:4:4 was placed in an alumina tube, which was sealed in an evacuated quartz ampule (i.e. mbar). The mixtures were heated to 500°C-700°C for 10 h, followed by heating slowly to a temperature of 1100°C-1180°C, soaked for 5 h, and subsequently cooled to 1000°C-900°C at the rate of 0.5°C/h to 2 °C/h, depending on the phosphorus content used for the growth. At 1000°C-900°C, the furnace was canted to remove the excess flux, followed by furnace cooling. Plate-like single crystals with typical sizes 3 x 2 x 0.5 mm3 were easily removed from the remaining ingot. The crystals were brittle having shiny brass-yellow metallic lustre. Electron micro probe analysis of the BaNi2(As1-xPx)2 crystals was performed using a compact scanning electron microscope (SEM) – energy dispersive x-ray spectroscopy (EDS) device COXEM EM-30plus equipped with an Oxford Silicon-Drift-Detector (SDD) and AZtecLiveLite-software package. The EDS analyses on the BaNi2(As1-xPx)2 crystals revealed phosphorus content and with a typical uncertainty of .
IV.2 Elastoresistance measurements
DC-elastoresistance measurements were performed following the method described in Ref. [38]. We used piezoelectrics from Piezomechanik GmbH (Part. No. Pst 150/5x5x7) and miniature strain gauges from Vishay Precision Group. The samples and strain gauges were glued to opposites faces of the piezo using DevCon 5mn 2-components epoxy (Part. No. X0039). Bias voltages from +150V to -30V were used. The maximal strain applied along the piezo poling direction decreases with decreasing temperature, going from at 300 K to less than at K. The experimental setup has been checked and validated by measuring the well-known longitudinal response of BaFe2As2 [3]. To extract the symmetry-resolved elastoresistance coefficient we consider a temperature independent piezo stack Poisson ratio [38].
The single crystals were cut with edges along the [100] direction, with typical dimensions 1.5mm 1mm 50 . The small thickness along the [001] direction is necessary for high and homogeneous strain transmission. The strain value extracted from the strain gauge is considered as the strain felt by the sample. A standard 4-contact geometry was used to measure the electrical resistance along the [100] direction using a Lake Shore 372 resistance bridge. Some of the freestanding resistance measurements were also done using a combination of Keithley 6221 current source and Keithley 2182A nanovoltmeter in delta mode. Either DuPont 4929N or Hans Wolbring Leitsilber silver paints were used.
Several strain sweeps were performed at each temperature to ensure the reproducibility of the extracted elastoresistance coefficients. A slow rate of 6V/s was used to drive the piezo. If possible cooling and warming elastoresistance measurements were recorded, without any significant difference. All the presented elastoresistance coefficients are extracted from linear-in-strain fits. Second-order fits do not lead to any significant change in the extracted first-order coefficients.
V References
References
- Merz et al. [2021] M. Merz, L. Wang, T. Wolf, P. Nagel, C. Meingast, and S. Schuppler, Rotational symmetry breaking at the incommensurate charge-density-wave transition in : Possible nematic phase induced by charge/orbital fluctuations, Phys. Rev. B 104, 184509 (2021).
- Kamihara et al. [2006] Y. Kamihara, H. Hiramatsu, M. Hirano, R. Kawamura, H. Yanagi, T. Kamiya, and H. Hosono, Iron-based layered superconductor: LaOFeP, Journal of the American Chemical Society 128, 10012 (2006).
- Chu et al. [2012] J.-H. Chu, H.-H. Kuo, J. G. Analytis, and I. R. Fisher, Divergent Nematic Susceptibility in an Iron Arsenide Superconductor, Science 337, 710 (2012).
- Kuo et al. [2016] H.-H. Kuo, J.-H. Chu, J. C. Palmstrom, S. A. Kivelson, and I. R. Fisher, Ubiquitous signatures of nematic quantum criticality in optimally doped Fe-based superconductors, Science 352, 958 (2016).
- Böhmer et al. [2014] A. E. Böhmer, P. Burger, F. Hardy, T. Wolf, P. Schweiss, R. Fromknecht, M. Reinecker, W. Schranz, and C. Meingast, Nematic Susceptibility of Hole-Doped and Electron-Doped Iron-Based Superconductors from Shear Modulus Measurements, Phys. Rev. Lett. 112, 047001 (2014).
- Fernandes et al. [2014] R. M. Fernandes, A. V. Chubukov, and J. Schmalian, What drives nematic order in iron-based superconductors?, Nature Physics 10, 97 (2014).
- Lederer et al. [2015] S. Lederer, Y. Schattner, E. Berg, and S. A. Kivelson, Enhancement of Superconductivity near a Nematic Quantum Critical Point, Phys. Rev. Lett. 114, 097001 (2015).
- Ronning et al. [2017] F. Ronning, T. Helm, K. R. Shirer, M. D. Bachmann, L. Balicas, M. K. Chan, B. J. Ramshaw, R. D. McDonald, F. F. Balakirev, M. Jaime, E. D. Bauer, and P. J. W. Moll, Electronic in-plane symmetry breaking at field-tuned quantum criticality in CeRhIn5, Nature 548, 313 (2017).
- Okazaki et al. [2011] R. Okazaki, T. Shibauchi, H. J. Shi, Y. Haga, T. D. Matsuda, E. Yamamoto, Y. Onuki, H. Ikeda, and Y. Matsuda, Rotational symmetry breaking in the hidden-order phase of URu2Si2, Science 331, 439 (2011).
- Murayama et al. [2019] H. Murayama, Y. Sato, R. Kurihara, S. Kasahara, Y. Mizukami, Y. Kasahara, H. Uchiyama, A. Yamamoto, E.-G. Moon, J. Cai, J. Freyermuth, M. Greven, T. Shibauchi, and Y. Matsuda, Diagonal nematicity in the pseudogap phase of HgBa2CuO4+δ, Nature Communications 10 (2019).
- Daou et al. [2010] R. Daou, J. Chang, D. LeBoeuf, O. Cyr-Choinière, F. Laliberté, N. Doiron-Leyraud, B. J. Ramshaw, R. Liang, D. A. Bonn, W. N. Hardy, and L. Taillefer, Broken rotational symmetry in the pseudogap phase of a high-Tc superconductor, Nature 463, 519 (2010).
- Sato et al. [2017] Y. Sato, S. Kasahara, H. Murayama, Y. Kasahara, E.-G. Moon, T. Nishizaki, T. Loew, J. Porras, B. Keimer, T. Shibauchi, and Y. Matsuda, Thermodynamic evidence for a nematic phase transition at the onset of the pseudogap in YBa2Cu3Oy, Nature Physics 13, 1074 (2017).
- Cyr-Choinière et al. [2015] O. Cyr-Choinière, G. Grissonnanche, S. Badoux, J. Day, D. A. Bonn, W. N. Hardy, R. Liang, N. Doiron-Leyraud, and L. Taillefer, Two types of nematicity in the phase diagram of the cuprate superconductor , Phys. Rev. B 92, 224502 (2015).
- Auvray et al. [2019] N. Auvray, B. Loret, S. Benhabib, M. Cazayous, R. D. Zhong, J. Schneeloch, G. D. Gu, A. Forget, D. Colson, I. Paul, A. Sacuto, and Y. Gallais, Nematic fluctuations in the cuprate superconductor Bi2Sr2CaCu2O8+δ, Nature Communications 10, 5209 (2019).
- Ishida et al. [2020] K. Ishida, S. Hosoi, Y. Teramoto, T. Usui, Y. Mizukami, K. Itaka, Y. Matsuda, T. Watanabe, and T. Shibauchi, Divergent nematic susceptibility near the pseudogap critical point in a cuprate superconductor, Journal of the Physical Society of Japan 89, 064707 (2020).
- Kivelson et al. [1998] S. A. Kivelson, E. Fradkin, and V. J. Emery, Electronic liquid-crystal phases of a doped mott insulator, Nature 393, 550 (1998).
- Nandi et al. [2010] S. Nandi, M. G. Kim, A. Kreyssig, R. M. Fernandes, D. K. Pratt, A. Thaler, N. Ni, S. L. Bud’ko, P. C. Canfield, J. Schmalian, R. J. McQueeney, and A. I. Goldman, Anomalous Suppression of the Orthorhombic Lattice Distortion in Superconducting Single Crystals, Phys. Rev. Lett. 104, 057006 (2010).
- Ni et al. [2008] N. Ni, M. E. Tillman, J.-Q. Yan, A. Kracher, S. T. Hannahs, S. L. Bud’ko, and P. C. Canfield, Effects of Co substitution on thermodynamic and transport properties and anisotropic in single crystals, Phys. Rev. B 78, 214515 (2008).
- Böhmer et al. [2012] A. E. Böhmer, P. Burger, F. Hardy, T. Wolf, P. Schweiss, R. Fromknecht, H. v. Löhneysen, C. Meingast, H. K. Mak, R. Lortz, S. Kasahara, T. Terashima, T. Shibauchi, and Y. Matsuda, Thermodynamic phase diagram, phase competition, and uniaxial pressure effects in BaFe2(As1-xPx)2 studied by thermal expansion, Phys. Rev. B 86, 094521 (2012).
- He et al. [2018] M. He, L. Wang, F. Hardy, L. Xu, T. Wolf, P. Adelmann, and C. Meingast, Evidence for short-range magnetic order in the nematic phase of FeSe from anisotropic in-plane magnetostriction and susceptibility measurements, Phys. Rev. B 97, 104107 (2018).
- Massat et al. [2016] P. Massat, D. Farina, I. Paul, S. Karlsson, P. Strobel, P. Toulemonde, M.-A. Méasson, M. Cazayous, A. Sacuto, S. Kasahara, T. Shibauchi, Y. Matsuda, and Y. Gallais, Charge-induced nematicity in FeSe, Proceedings of the National Academy of Sciences 113, 9177 (2016).
- Chibani et al. [2021] S. Chibani, D. Farina, P. Massat, M. Cazayous, A. Sacuto, T. Urata, Y. Tanabe, K. Tanigaki, A. E. Böhmer, P. C. Canfield, M. Merz, S. Karlsson, P. Strobel, P. Toulemonde, I. Paul, and Y. Gallais, Lattice-shifted nematic quantum critical point in FeSe1-xSx, npj Quantum Materials 6, 37 (2021).
- Böhmer et al. [2013] A. E. Böhmer, F. Hardy, F. Eilers, D. Ernst, P. Adelmann, P. Schweiss, T. Wolf, and C. Meingast, Lack of coupling between superconductivity and orthorhombic distortion in stoichiometric single-crystalline FeSe, Phys. Rev. B 87, 180505 (2013).
- Ghini et al. [2021] M. Ghini, M. Bristow, J. C. A. Prentice, S. Sutherland, S. Sanna, A. A. Haghighirad, and A. I. Coldea, Strain tuning of nematicity and superconductivity in single crystals of FeSe, Phys. Rev. B 103, 205139 (2021).
- Hosoi et al. [2016] S. Hosoi, K. Matsuura, K. Ishida, H. Wang, Y. Mizukami, T. Watashige, S. Kasahara, Y. Matsuda, and T. Shibauchi, Nematic quantum critical point without magnetism in fese superconductors, Proceedings of the National Academy of Sciences 113, 8139 (2016).
- Sefat et al. [2009] A. S. Sefat, M. A. McGuire, R. Jin, B. C. Sales, D. Mandrus, F. Ronning, E. D. Bauer, and Y. Mozharivskyj, Structure and anisotropic properties of (, 1, and 2) single crystals, Phys. Rev. B 79, 094508 (2009).
- Yao et al. [2022] Y. Yao, R. Willa, T. Lacmann, S. M. Souliou, M. Frachet, K. Willa, M. Merz, F. Weber, C. Meingast, R. Heid, A.-A. Haghighirad, J. Schmalian, and M. Le Tacon, A nematic liquid in P-doped BaNi2As2, To appear (2022).
- Pokharel et al. [2022] A. R. Pokharel, V. Grigorev, A. Mejas, T. Dong, A. A. Haghighirad, R. Heid, Y. Yao, M. Merz, M. Le Tacon, and J. Demsar, Dynamics of collective modes in an unconventional charge density wave system BaNi2As2, Communications Physics 5, 141 (2022).
- Lee et al. [2019] S. Lee, G. de la Peña, S. X.-L. Sun, M. Mitrano, Y. Fang, H. Jang, J.-S. Lee, C. Eckberg, D. Campbell, J. Collini, J. Paglione, F. M. F. de Groot, and P. Abbamonte, Unconventional charge density wave order in the pnictide superconductor , Phys. Rev. Lett. 122, 147601 (2019).
- Lee et al. [2021] S. Lee, J. Collini, S. X.-L. Sun, M. Mitrano, X. Guo, C. Eckberg, J. Paglione, E. Fradkin, and P. Abbamonte, Multiple charge density waves and superconductivity nucleation at antiphase domain walls in the nematic pnictide , Phys. Rev. Lett. 127, 027602 (2021).
- Eckberg et al. [2020] C. Eckberg, D. Campbell, T. Metz, J. Collini, H. Hodovanets, T. Drye, P. Zavalij, M. Christensen, M. Fernandes, S. Lee, P. Abbamonte, J. Lynn, and J. Paglione, Sixfold enhancement of superconductivity in a tunable electronic nematic system, Nature Physics 16, 346 (2020).
- Meingast et al. [2022] C. Meingast, A. Shukla, L. Wang, R. Heid, F. Hardy, M. Frachet, K. Willa, T. Lacmann, M. L. Tacon, M. Merz, A.-A. Haghighirad, and T. Wolf, Charge-density-wave transitions, phase diagram, soft phonon and possible electronic nematicity: a thermodynamic investigation of BaNi2(As,P)2 (2022).
- Kudo et al. [2017] K. Kudo, M. Takasuga, and M. Nohara, Copper Doping of BaNi2As2: Giant Phonon Softening and Superconductivity Enhancement (2017), arXiv:1704.04854 [cond-mat.supr-con] .
- Kudo et al. [2012] K. Kudo, M. Takasuga, Y. Okamoto, Z. Hiroi, and M. Nohara, Giant phonon softening and enhancement of superconductivity by phosphorus doping of , Phys. Rev. Lett. 109, 097002 (2012).
- Kothapalli et al. [2010] K. Kothapalli, F. Ronning, E. D. Bauer, A. J. Schultz, and H. Nakotte, Single-crystal neutron diffraction studies on Ni-based metal-pnictide superconductor BaNi2As2, J. Phys.: Conf. Ser. 251, 012010 (2010).
- He et al. [2017] M. He, L. Wang, F. Ahn, F. Hardy, T. Wolf, P. Adelmann, J. Schmalian, I. Eremin, and C. Meingast, Dichotomy between in-plane magnetic suscepbility and resistivity anisotropies in extremely strained BaFe2As2, Nature Communications 8 (2017).
- Chu et al. [2010] J.-H. Chu, J. G. Analytis, K. D. Greve, P. L. McMahon, Z. Islam, Y. Yamamoto, and I. R. Fisher, In-plane resistivity anisotropy in an underdoped iron arsenide superconductor, Science 329, 824 (2010), https://www.science.org/doi/pdf/10.1126/science.1190482 .
- Kuo et al. [2013] H.-H. Kuo, M. C. Shapiro, S. C. Riggs, and I. R. Fisher, Measurement of the elastoresistivity coefficients of the underdoped iron arsenide Ba(Fe0.975Co0.025)2As2, Phys. Rev. B 88, 085113 (2013).
- Palmstrom et al. [2017] J. C. Palmstrom, A. T. Hristov, S. A. Kivelson, J.-H. Chu, and I. R. Fisher, Critical divergence of the symmetric () nonlinear elastoresistance near the nematic transition in an iron-based superconductor, Phys. Rev. B 96, 205133 (2017).
- Straquadine et al. [2020] J. A. W. Straquadine, M. S. Ikeda, and I. R. Fisher, Evidence for realignment of the charge density wave state in ErTe3 and TmTe3 under uniaxial stress via elastocaloric and elastoresistivity measurements (2020), arXiv:2005.10461 [cond-mat.str-el] .
- Bartlett et al. [2021] J. M. Bartlett, A. Steppke, S. Hosoi, H. Noad, J. Park, C. Timm, T. Shibauchi, A. P. Mackenzie, and C. W. Hicks, Relationship between transport anisotropy and nematicity in FeSe, Phys. Rev. X 11, 021038 (2021).
- Mine et al. [2008] T. Mine, H. Yanagi, T. Kamiya, Y. Kamihara, M. Hirano, and H. Hosono, Nickel-based phosphide superconductor with infinite-layer structure, BaNi2P2, Solid State Communications 147, 111 (2008).
- Watson et al. [2015] M. D. Watson, T. K. Kim, A. A. Haghighirad, N. R. Davies, A. McCollam, A. Narayanan, S. F. Blake, Y. L. Chen, S. Ghannadzadeh, A. J. Schofield, M. Hoesch, C. Meingast, T. Wolf, and A. I. Coldea, Emergence of the nematic electronic state in FeSe, Phys. Rev. B 91, 155106 (2015).
- Guo et al. [2022] Y. Guo, M. Klemm, J. S. Oh, Y. Xie, B.-H. Lei, S. Gorovikov, T. Pedersen, M. Michiardi, S. Zhdanovich, A. Damascelli, J. Denlinger, M. Hashimoto, D. Lu, S.-K. Mo, R. G. Moore, R. J. Birgeneau, D. J. Singh, P. Dai, and M. Yi, Spectral evidence for unidirectional charge density wave in detwinned BaNi2As2 (2022).
- Johannes and Mazin [2008] M. D. Johannes and I. I. Mazin, Fermi surface nesting and the origin of charge density waves in metals, Phys. Rev. B 77, 165135 (2008).
- Sinchenko et al. [2014] A. A. Sinchenko, P. D. Grigoriev, P. Lejay, and P. Monceau, Spontaneous breaking of isotropy observed in the electronic transport of rare-earth tritellurides, Phys. Rev. Lett. 112, 036601 (2014).
- Sanchez et al. [2021] J. J. Sanchez, P. Malinowski, J. Mutch, J. Liu, J.-W. Kim, P. J. Ryan, and J.-H. Chu, The transport-structural correspondence across the nematic phase transition probed by elasto X-ray diffraction, Nature Materials 20, 1519 (2021).
VI Acknowledgments
We thank R. Willa, I. Vinograd and F. Hardy for valuable discussions. We acknowledge support by the Deutsche Forschungsgemeinschaft (DFG; German Research Foundation) under CRC/TRR 288 (Projects B03 and A02) and the Helmholtz Association under Contract No. VH-NG-1242. M. F. acknowledges funding from the Alexander von Humboldt foundation and the Young Investigator Group preparatory program of the Karlsruhe Institute for Technology. K. W. acknowledges funding from the Swiss National Science foundation through the postdoc mobility fellowship. S. M. S. acknowledges funding by the Deutsche Forschungsgemeinschaft (DFG, German Research Foundation) – Projektnummer 441231589.
VII Competing interests
The authors declare no competing interests.