Constraints on Dark Matter-Neutrino Interaction from 21-cm Cosmology and Forecasts on SKA1-Low
Abstract
In this article, we have done a thorough investigation of the possible effects of interaction between dark matter (DM) and neutrinos on reionization history. We have constrained the interaction strength using 21 cm Cosmology and found out possible deviations from standard, non-interacting CDM scenario. Comparing the results with the existing constraints from present cosmological observations reveals that 21 cm observations are more competent to constrain the interaction strength by a few orders of magnitude. We have also searched for prospects of detecting any such interaction in the upcoming 21 cm mission SKA1-Low by doing a forecast analysis and error estimation.
keywords:
cosmology: dark matter, dark ages, reionization, first stars1 Introduction
The standard model of Cosmology, the CDM model, is so far the most widely accepted theory of the Universe, thanks to its compatibility with the highly precise data of Cosmic Microwave Background (CMB) anisotropy, Large Scale Structure (LSS) along with many other observations, barring couple of moderate to high tensions. In its vanilla version, the Universe is composed of a cosmological constant that takes into account of cosmic budget and is attributed to cold dark matter (CDM). The CDM, assumed to be non-relativistic (hence dubbed as ”cold") and mostly non-interacting (other than the gravitational interactions), conforms with a number of astrophysical and cosmological observations at all scales starting from galaxies (Rubin & Ford, 1970), cluster of galaxies (Randall et al., 2008), to large scale structures (Tegmark et al., 2004) and CMB (Aghanim et al., 2020). In order to find out the exact constituent of DM, one needs to propose particle candidates. However, in the framework of particle physics, it is unnatural to incorporate DM without (non-gravitational) interactions. Thus one of the major objectives of dark matter research is to search for its possible interactions, either with self or with any other species, either in terrestrial experiments or in astrophysical/cosmological observations.
Several well-motivated Beyond Standard Model (BSM) scenarios give rise to possible dark matter species with interactions with the Standard Model (SM) particles. Of them, a widely accepted candidate is weakly interacting massive particle (WIMP), in which the WIMP DM particles are in thermal equilibrium with the SM particles in the early Universe, leading to energy injection into the SM thermal bath due to DM annihilations, and the effect is observable in the CMB anisotropy spectrum (Chluba, 2010), (Finkbeiner et al., 2012), (Galli et al., 2013), (Slatyer et al., 2009). Scattering between DM and baryons leave imprint in the cosmological observables, hence have been constrained both in the context of CMB (Boddy et al., 2018) and 21 cm Cosmology (Barkana, 2018). Other interesting possibilities include DM-DR (dark radiation) interactions (Cyr-Racine et al., 2016), (Escudero et al., 2018a) and DM-neutrino interactions, which have been studied in the light of CMB Power Spectrum (Mangano et al., 2006), (Wilkinson et al., 2014), (Escudero et al., 2015), (Escudero et al., 2018b), (Di Valentino et al., 2018), (Olivares-Del Campo et al., 2018), (Stadler et al., 2019), (Ghosh et al., 2020), (Mosbech et al., 2021), (Paul et al., 2021). DM annihilation into highly energetic neutrinos have also well studied in the literature (Blennow et al., 2008) constraining DM annihilation cross-section at current epoch (Argüelles et al., 2021), (Frankiewicz, 2015).
Among the above-mentioned possibilities, we consider the interaction between DM and neutrinos and explore its possible signatures in reionization history. For the early stages of the Universe, when the perturbation theory is valid, the evolution of the fluctuations of DM and neutrino fluids can be studied using the first order Boltzmann equations, hence estimating its impact in CMB anisotropy spectrum. This have been exhaustively studied in the literature as mentioned before.
On cosmological scales, sizable DM-neutrino interactions may significantly impact the structure formation of the Universe, resulting from the modified evolution of DM over-density. This non-standard interaction provides with a pressure-like term in the DM fluid, thus preventing DM from collapsing significantly at small length scales. Similar to the acoustic waves in the baryon-photon fluid, a dark acoustic oscillation along with the collisional and silk damping-like phenomenon is also observed in this case. Although the imprint of this oscillation may be observed in the linear matter power spectrum, non-linear evolution at late time washes out some of these features, leaving only a suppression of power at small scales. The suppression of the power at small scales may hence significantly reduce the halo formation and number of stars and galaxies in those halos, resulting in a smaller number of ionizing photons in the intergalactic medium (IGM). This lower number of ionizing photons reduce the amount of ionized hydrogen in the IGM and consequently, affects the reionization history.
This is the primary target of the present article. We have made a thorough investigation of the possible effects of DM-neutrino interaction on reionization history. In the process, we have constrained the interaction strength using 21 cm Cosmology. We found that the constraints on DM-neutrino interaction from 21 cm missions is much more stringent compared to the constraints from existing cosmological observations. We also find a non-trivial effect of DM-neutrino interaction in HI maps. We have done forecast analysis in the upcoming 21 cm mission Square Kilometer Array 1 - Low (SKA1-Low).
The paper is organized as follows: in section 2 we have discussed about the cosmological scalar perturbation equations in presence of DM- neutrino scattering, in section 3 we describe the semi-numerical reionization simulation and constraints of these parameter from different observations, in 4 constraints on the DM-neutrino parameter from reionization physics is discussed and detection techniques of this interaction are presented in 5 for upcoming telescope SKA-Low.
Throughout this work, we have adopted cosmological parameters consistent with Planck+WP best-fit values (Aghanim et al., 2020).
2 Effect of DM-neutrino Interaction
In order to consider DM-neutrino interaction one needs to go beyond the six parameter description of vanilla CDM model and analyze the new set of perturbation equations. Let us describe the present situation briefly. Here we will work on Newtonian gauge for our analysis. Presence of scattering between two cosmic species (DM and neutrino in the present case) results in a drag term in the perturbed Euler equation for the corresponding species. Assuming a flat Universe, the modified perturbation equations for dark matter and neutrino fluid, in presence of DM-neutrino interaction is given by (Stadler et al., 2019),
| (1) | |||||
| (2) | |||||
| (3) | |||||
| (4) |
where an overdot represents a derivative with respect to conformal time. Here , are respectively the neutrino and DM density contrast and , corresponds to their velocity divergences; is the comoving wavenumber, and are the metric perturbations, is the anisotropic stress potential and is the conformal Hubble parameter. Further, the DM-neutrino interaction rate is expressed as where is DM-neutrino elastic scattering cross-section and is number density of DM. We have considered the neutrinos to be massless in our analysis for computational simplicity. For convenience, let us introduce a dimensionless quantity to parametrize the DM-neutrino interaction strength,
| (5) |
In principle, can be velocity dependent (Wilkinson et al., 2014). However, in the present analysis we will consider to be constant.This dimensionless quantity will act as a new parameter on top of the 6-parameter in the present scenario.
Over the years, the constraint on have improved considerably with the availability of new datasets. For example, using Planck 2013 and WP measurement the constraints on u was found to be (Wilkinson et al., 2014). Recent studies using Planck 2018 data-set (high- TT+TE+EE, low- TT, low- EE) the constraint comes out to be a tighter (Mosbech et al., 2021), (Paul et al., 2021), the scattering cross-section constraint being . As mentioned earlier, in this article, our primary intention is to investigate if 21 cm Cosmology can put further constraints on the parameter and the prospects of SKA1-Low in this regard, which will in turn help us have better idea on more stringent constraints on DM-neutrino interaction from future observations.
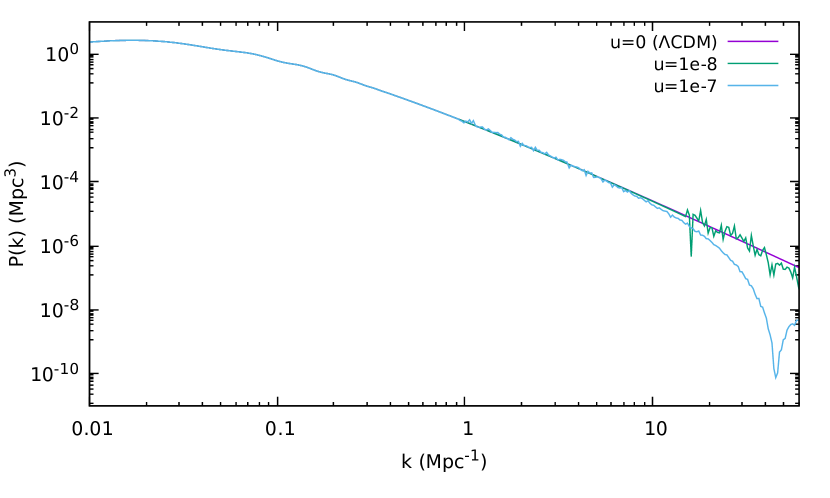
Let us first find out the effects of DM-neutrino interaction on the matter power spectrum in Fig. 1 using a modified version (Stadler et al., 2019) of the CLASS code (Blas et al., 2011). We have illustrated this for specific values of the interaction parameter irrespective of observational constraints. For this, we have considered flat CDM model with DM-neutrino interaction on top of it, where the other cosmological parameters are taken as the Planck 2018 best-fit values (Aghanim et al., 2020). Fig. 1 reveals that the effects of DM-neutrino interaction (with ) on the matter power spectrum is being reflected by a series of damped oscillations with a suppression of power in the non-linear regime ().
Having convinced ourselves on the non-trivial effects of DM-neutrino interaction, we are now in a position to explore more realistic situation, namely, the reionization simulation, corresponding HI maps and error estimation for SKA1-Low, that will help us drawing important conclusions on the prospects of 21 cm cosmology in this regard. We will do that stepwise in the subsequent sections.
3 Methodology
3.1 Reionization Simulation
Cosmic reionization is one of the most crucial epochs of the evolution history of the Universe when the hydrogen content in the Universe gets ionized from its neutral state. The high energy radiation from the first luminous sources starts ionizing the neutral hydrogen in the intergalactic medium (IGM) in its vicinity. As reionization period progresses the ionized bubble gets bigger and starts to overlap until it fills the entire IGM. At the present epoch, IGM is almost completely in the ionized state, except a small fraction found in the dense core of galaxies in the form of a damped Lyman- forest. Free electrons in the IGM interact with the cosmic microwave background radiation through Thomson scattering and optical depth corresponding to the scattering can be measured from the CMB observations, hence providing information about the reionization epoch. However, the onset and completion of the epoch of reionization depends on the model of reionization and may vary from model to model. Latest constraints on the Thomson scattering optical depth is = 0.054 ± 0.007 by taking into account different reionization model. This suggests that IGM is almost 10 percent ionized at redshift z10 (Aghanim et al., 2020).
In this article, we have used semi-numerical simulation proposed in (Majumdar et al., 2014), (Mondal et al., 2015) to generate the 21 cm maps and the redshifted 21 cm brightness temperature power spectra at a redshift . The three-step procedure for this is the following:
-
•
The first step is to simulate the DM particle density distribution using the particle mesh algorithm (Bharadwaj & Srikant, 2004). DM particles have been simulated in a volume of with spatial resolution of 0.07 Mpc and mass resolution of . The initial distribution for the DM particles are provided by the linear matter power spectrum mentioned in section 2. The initial condition for the simulation is set at an earlier redshift at where initial density fluctuations are approximated as gaussian random field where ; a(k) b(k) are two real valued independent gaussian random variable of unit variance. Here is the input linear matter power spectrum for interacting DM-neutrino scenario for different interaction strength. The initial particle position and velocities are estimated from Zel’dovich approximation , where H is Hubble parameter and f () logarithmic derivative of growth factor w.r.t. the scale factor. Then the DM particle distribution is being evaluated at lower redshifts by solving the equation of motion of each particle under the gravitational field produced by other particles in expanding Universe. And finally we get the particle position and velocity distribution at redshift of interest and the non-linear matter power spectrum at that redshift is being calculated from the DM density distribution.
-
•
The second step is to identify the halos using the halo finding technique via friends-of-friends (FOF) algorithm. We have taken the linking length as 0.2 times mean inter particle separation. We have set the criteria of halo to consist of a minimum of 10 dark matter particles which corresponds to minimum halo mass of . Given the particle position and velocity distribution FOF algorithm counts the number of DM particles within a sphere of radius which is 0.2 times mean inter particle separation and if the number of particles inside this sphere reaches 10 it will then mark this region as a dark matter halo.
-
•
The third, and final, step in this process is to generate the 21 cm HI map and differential brightness temperature power spectrum based on excursion set formalism Furlanetto et al. (2004) for which we have used the semi-numerical code ReionYuga (Majumdar et al., 2014), (Mondal et al., 2016), based on (Choudhury et al., 2009).
In the process, we have made certain assumptions while computing observables in the reionization era. We have considered only hydrogen ionization in the Universe, Helium ionization is not taken into account. Hydrogen gas follows underlying DM distribution and sources of the ionization are the ultraviolet radiations which are located inside the DM halo.
There are three parameters in our reionization model, namely, the minimum halo mass , ionizing photons per baryon and mean free path of the ionizing photons . Let us now discuss these three parameters in details.
3.1.1
This parameter represents the minimum mass of the halo that can host star formation. Once the the potential well of the DM halo is formed, baryons will simply fall into the well and as the gas tries to settle into the potential well, mergers will heat the gas to the virial temperature. In order to form galaxies, the gas has to dissipate its thermal energy and cool down. Depending upon the nature of the gas the cooling criteria will be different. For example, if the gas contains only atomic hydrogen it can never be cooled to lower than K, whereas, if the gas contains molecules it can be effectively cooled to much lower temperature. However whether or not there are sufficient amount of molecules in the gas at high redshifts is yet to be known conclusively. The minimum of the halo mass will solely depend upon the cooling criteria of the baryons (Barkana et al., 2001), (Ricotti & Ostriker, 2004). The reionization simulation as done by (Choudhury et al., 2009) suggests that has to be of the order of to satisfy constraints from Thomson scattering optical depth and Gunn-Peterson troughs observations. But this analysis has not taken into account the Population stars in the simulation which are an efficient source of ionizing radiation. The value of is generally expected to be large if Population stars are also included. Recent simulation by (Bouwens et al., 2017) have constrained the value of well within the allowed range of reionization using UV luminosity function data. We have chosen the value of to be for our simulation (Shaw et al., 2020).
3.1.2
This is the number of photons entering into the IGM per baryon in collapsed objects. Our model assumes that ionizing UV photons from galaxies entering into the IGM is proportional to the halo mass . The proportionality relation can be expressed as,
| (6) |
Here is the dimensionless proportionality constant, is the proton mass and are respectively the baryon and matter density parameter. This factor depends on several unknown parameters: properties of ionizing sources, star forming efficiency , escape fraction of ionizing photons , hydrogen recombination rate (Choudhury et al., 2009). In general can be dependent on the redshift, however in this work, we assume to be independent of redshift for simplicity. We have chosen a fiducial value of to be 23.21. This is usually adopted for CDM in order to achieve ionization at redshift z = 8.0 satisfying the existing constrain on reionization (Choudhury et al., 2009). However, since we do not expect much deviation from CDM anyway, this turns out to be a valid choice for our case as well.
3.1.3
This factor depends upon the distribution of the Lyman- systems in the IGM. From the observations of Lyman- systems it has been observed that can have values between (Songaila & Cowie, 2010) at z. Accordingly, we have chosen the fiducial value of to be .
The semi-numerical code we have used, is based on the excursion set formalism Furlanetto et al. (2004). A point on the grid is said to be fully ionized i.e. only if it satisfies the following condition where is number density of ionizing photons smoothed over a sphere of comoving radius and is the smoothed number density of hydrogen. And if the condition is not fully satisfied then the grid is said to be partially ionized with . The radius is varied from a minimum value i.e. grid size to maximum value of . The simulated H1 distribution mapped to redshift space using peculiar velocity of the particles in order to generate brightness temperature power spectrum. The final H1 maps are generated on a grid which is eight times coarser than the N-body simulations.
As already stated, the fiducial values of the parameters under consideration [] are [, 23.21, 20 Mpc] (Shaw et al., 2020). Using these fiducial values, we have run the N-body code on 2144 grid size and generated the observables HI map and differential brightness temperature power spectrum.
3.2 Ionization Condition
In the analytical model of reionization, the ionization process can be expressed as (Choudhury, 2009),
| (7) |
where is volume filling factor and is the source term which hosts the ionizing photons and term in right hand is responsible for the recombination, is clumping factor and is recombination rate coefficient at temperature .
In analytical and semi-numerical modelling of the reionization, there arise several parameters the values of which are not too precise. These uncertainties can be somewhat dealt with by the existing data from different sources, like quasar absorption spectra, Lyman- data, CMB data etc. From one such modelling (Mitra et al., 2015) it has been shown that reionization process begins at around redshift and ends at , but a huge range of is allowed in order to satisfy the current observational constraints. Since there are quite a good deal of uncertainties in the value of , we have chosen a particular value for our model which is fairly justified considering all the existing observations taken together. Additionally, we have considered ionization condition at redshift which is also justified in order to complete the reionization process during the redshift range , as in (Mitra et al., 2015), (Kulkarni et al., 2019).
3.3 Constraints on
In order to find out possible constraints on , we have assumed a linear relationship between the halo mass and number of ionizing photons emitted from that halo, (Choudhury et al., 2009), where is a proportionality factor as mentioned earlier. We can estimate this factor roughly as follows (Mesinger et al., 2016),
| (8) |
Here is the number of ionizing photons produced in the halo per neutral hydrogen (since we are ignoring helium in our case). is the baryonic mass fraction. is the fraction of baryonic mass which has converted into stars and is the fraction of ionizing photons which has escaped from halo and enters into the IGM, this fraction is responsible for ionizing the neutral hydrogen in the IGM, however the values and exact dependencies of these parameters are uncertain. There is a huge uncertainty in the value of for population (zero metallicity stars) and population stars, due to large systematic uncertainties of , . For metallicity stars, number of photons per baryon could be of the order of 4000, but for zero metallicity stars lie in the range , where can be of to order. But these stars are short lived stars and the impact of these stars on reionization is considerably small. In general we can safely take for population stars (Ricotti & Ostriker, 2004) (Barkana et al., 2001) (Choudhury et al., 2009).
4 Results Analysis
Let us now discuss the major results obtained from our analysis.
-
•
In order to find out the effect of DM-neutrino interaction on the reionization epoch, we have performed the semi-numerical simulation for different strength of interaction parameter ‘’ (as given in Table 1) and we have considered the same initial random seed for all the simulations. We have considered benchmark values for which neutral hydrogen fraction at redshift . Introduction of the DM-neutrino interaction suppresses the matter power spectrum w.r.t. the CDM model in the non-linear regime, thereby hampering dark matter halo formation. As a result, it will reduce star formation and lesser number of ionizing photons will be produced, hence delaying the reionization process. So, in order to achieve ionization in the interacting dark scenario, has to be increased. However, for Population stars, beyond is not physically allowed. So, we have restricted ourselves to condition. Keeping two reionization parameters and fixed at and , we have varied the parameters and in order to achieve . In order to make the analysis robust, we have taken three different values of and searched for possible range of the interaction parameter for which ionization condition can be achieved. In order to satisfy two conditions and simultaneously we have found that the the maximum value of the interaction parameter can be that can be achieved from the reionization physics using these two criteria.111A somewhat similar analysis has been put forward in arXiv after this paper, that investigated for the bounds on ’’ for massive neutrinos (Mosbech et al., 2022) that reassures our analysis.
-
•
It is noteworthy that the current constraints on the DM-neutrino interaction in light of different existing cosmological observations are not that stringent. For example, using Planck 2018 data (high- TT+TE+EE, low- TT, low- EE) the allowed range of the interaction parameter is of the order (Mosbech et al., 2021), (Paul et al., 2021). Our analysis reveals that putting 21 cm observation on top of existing observations results in a much more tighter constraint on the DM-neutrino interaction (). So, the upcoming 21 cm missions like SKA would have very good prospects to constrain DM-neutrino interaction further compared to existing observations and hence to improve our understanding about this cosmic entities.
DM- interaction Model (u) 0.0 (CDM) 24 0.5 8.8 300 0.51 6.6 500 0.51 Table 1: Table of (dark matter neutrino interaction strength), (number of photons entering IGM per baryon in collapsed objects) and (neutral hydrogen fraction). Increase in the value of will suppress more power in the power spectrum. It will generate a lesser number of dark matter halo and less ionizing radiation will produce. In order to reach ionization condition has to be increased. -
•
We have done the N-body simulation for three different cases and generated a non-linear matter power spectrum (Fig. 2) at redshift . From the figure, it is obvious that no oscillatory signature in the power spectrum is observed, as non-linearities washes out these features. Nevertheless, the maximum suppression of the power is observed for .
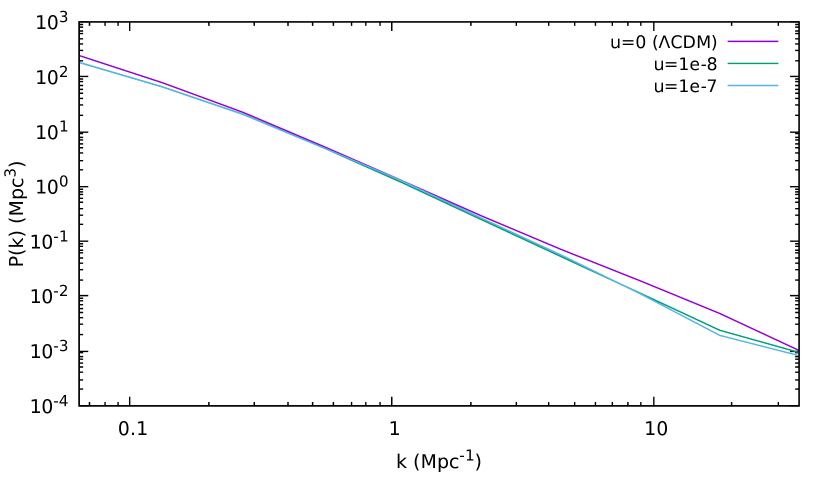
Figure 2: Non-linear matter power spectrum: The above figure shows the non-linear matter power spectrum at redshift calculated from N-body simulation for different strength of dark matter neutrino interaction . We can see the suppression of power for increasing value of , but the non-linearities washes out the oscillatory features of the power spectrum. -
•
For different values of the interaction parameter and , different ionization features appear. As justified earlier, we have restricted our analysis to and condition at . However the assumption of at has considerable uncertainties, which may change the bounds on to some extent. With this we have performed the reionization simulation and have generated HI maps for the above three representative value of . These have been depicted in Fig. 3. The maps reveal that increase in the value of within its allowed range decreases ionization and delays reionization physics. In order to achieve ionization condition has to be increased. We observe slight increase in bubble size as increases, confirming the non-trivial effect of interaction on HI maps. Further, as u increases, we found slightly lower number of dark matter halos forming in the universe, as expected from the suppression of dark matter power spectrum. However, this change resulting from the figures may not be significant enough so as to quantify and find out its edge over standard CDM scenario, mostly because of the feeble value of the interaction strength.
-
•
We argue that our results are solely depend on the two constraints which are at which is justified from Planck 2018 data and for Pop-II stars. The two main observable quantities which constraints reionization epoch are the optical depth to reionization ( = 0.054 0.007) and Gunn Peterson bound from quasar absorption spectra which tells abount the end of reionization. We have considered a conservative limit on so that it can satisfy the two observational bounds. However, if we consider the ionization criteria at some smaller redshift (Bouwens et al., 2015), (Wang et al., 2020), (Mason et al., 2019), (Villanueva-Domingo, 2021), say at , then it will affect the constraints on and the conclusion may differ slightly from our case. While these aspects worth investigating, we do not expect a significant deviation from the conservative approach taken up in this article.
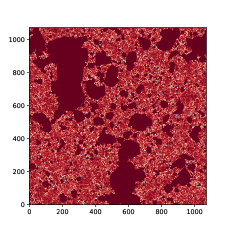

Figure 3: HI map: Two dimensional section of the simulated HI map at generated from grid size of the simulation box. The above figures are for , ; , and , , units along x and y axis are in . Darker shades corresponds to more ionized regions. For all the simulations we have assumed the identical initial random seed.
5 Error Analysis Prospects of Detection in SKA1-Low
Having convinced ourselves of the role of 21 cm observations in putting tighter constraints on DM-neutrino interaction, let us now investigate the prospects of the upcoming radio observations in this regard. To this end, we have done a forecast analysis on the upcoming SKA1-Low telescope. The specifications for SKA1-Low are shown in Table 2. Considering SKA1-Low antenna layout (Dewdney & Braun, 2016) we have simulated the distribution of antenna pair separations ’d’ corresponding to 8 hours of observations with an integration time of 60 seconds towards a fixed sky direction located at DEC= . In addition to the signal i.e 21 cm brightness temperature fluctuation, observed 21 cm differential brightness temperature will have a contribution from random Gaussian system noise corresponding to each and every grid point in the simulation. The noise power spectra is given by (Chatterjee & Bharadwaj, 2018), (Shaw et al., 2019), (Mondal et al., 2020).
| (9) |
where is the system noise power spectrum for a single visibility measurement with 60 seconds integration time. quantifies the number of independent visibility measurements. Here is the observation performed over number of nights, considering a run in each night consists of 8 hours. So, effectively, the noise power spectrum will depend on the number of observation nights (in the denominator) scaled by 8 hours (in the numerator).
| Specifications | SKA-LOW |
|---|---|
| Number of antennas | 131,072 |
| Collecting areas | 4,19,000 |
| Frequency coverage (MHz) | 50-350 |
| Instantaneous Bandwidth (MHz) | 300 |
| Field of View () | 2.3 - 113 |
| Maximum baseline (km) | 65 |
| Angular resolution (arcsec) | 3.3 - 23 |
| Sensitivity ( beam-1hr-1, fractional bandwidth 0.3) | 14 - 26 |
We have compared the signal i.e. differential brightness temperature fluctuation with the noise power spectra for 1024, 10000, 50000 hours of observation and the results have been shown in Fig. 5. While computing the noise power spectrum we have considered the effect of cosmic variance. We can write the cosmic variance as (Shaw et al., 2019),
| (10) |
where is bin averaged power spectrum and is number of independent k modes in each bin. In our analysis we have assumed 21 cm signal is completely Gaussian so we have neglected the trispectrum contribution of the cosmic variance. If one incorporates the tri-spectrum contribution in the calculation then it will effect noise power spectrum slightly and the correlations which we have estimated for the astrophysical parameters will change slightly. However, if the signal is intrinsically non-gaussian at this redshift range, it should affect the calculations considerably. We hope to explore that direction in future.
We have assumed the foregrounds which plays an important role for detecting low frequency radio signal, is removed completely after modelling it so that the entire k space is allowed for detecting the signal. We have observed that in each of these cases the signal is higher w.r.t. the noise for all ranges of k, thereby giving a sizable SNR as required for detection.
We have done fisher forecast analysis for our astrophysical parameters and model parameter. The fisher matrix corresponding to the model parameter is (Repp et al., 2015)
| (11) |
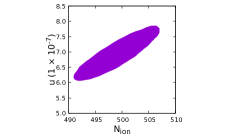
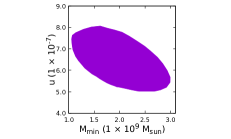
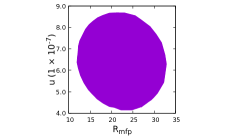
where is covariance matrix and is bin averaged power spectrum. In Fig. 4 the forecast on the parameter , , and has shown. From the analysis we have found a positive correlation on and and a negative correlation between and . Further from our analysis we found there is no significant dependencies on and .
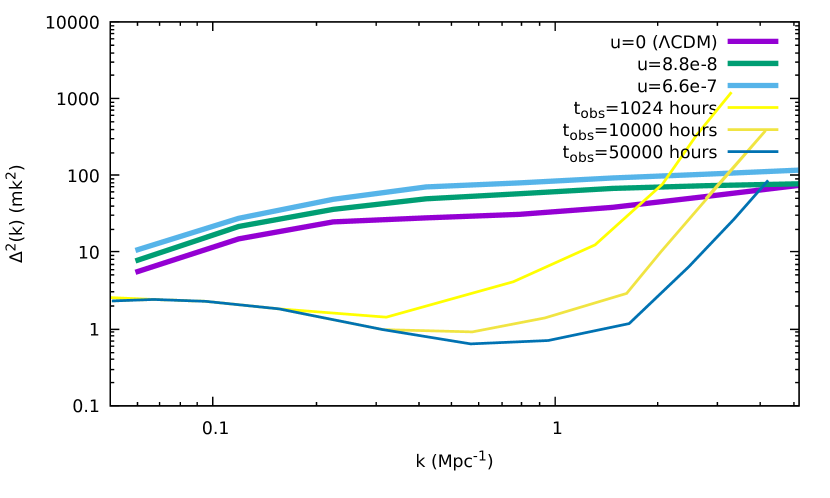
In Fig. 5 a comparison between Signal and Noise Power Spectra for SKA1-Low configuration has been demonstrated and explained in details. For , the power at small length scales in both the linear and non-linear matter power spectra are suppressed, as a result less number of low mass halos are formed, resulting in lower number of ionizing sources. Hence the ionization at small length scales are suppressed, giving rise to more HI fraction, resulting an increase in the HI power spectrum. An essential conclusion that comes out of the error analysis as in Fig. 5 is that the prospects of detection of any interaction between DM and neutrino, if any, of strength as constrained by reionization epoch in the upcoming SKA1-Low telescope is quite high. So, this guarantees further investigation in this direction, some of which we hope to take up as we go along.
6 Summary
In this work we have examined the effect of DM-neutrino interaction in the reionization epoch. We have run the semi-numerical N-body simulation to compute the reionization observables. We have put a constraint in the dark matter neutrino interaction parameter using ionization criteria and condition at redshift . Reionization puts stronger constraints to the interaction parameter than any other observations studied in the literature. We also found a non-trivial effect of the said interaction on HI maps via a slight yet distinguishable change in the sizes of the bubbles. Further, we have done the forecast analysis for the upcoming SKA1-Low telescope and found that the DM-neutrino interaction signal using this telescope can be observed for a very small time of observation and we observe possible correlations of the reionization parameters with interaction parameter. Thus, future 21 cm mission like SKA1-Low can help us comment in a more convincing way whether or not these two cosmic species interact, and if so, what can be the possible interaction strength. This will not only shed some light on these entities on top of their properties as constrained by particle physical theory and experiments but also help us have better understanding of these cosmic species on top of the existing cosmological observations like CMB.
The analysis done in the present article mostly focuses on reionization era with typical redshift of our consideration . However, if at all DM and neutrinos interact, that may reflect on post-reionization era as well. A thorough investigation of the effects of such interaction on post-reionization era needs to be done that will act as a complimentary to the constraints as obtained from 21 cm Physics during reionization. We look forward to explore these aspects in near future.
Acknowledgements
Authors gratefully acknowledge the use of publicly available code CLASS (Blas et al., 2011), Particle Mesh N-body code (Bharadwaj & Srikant, 2004), Friends-of-Friends code (Mondal et al., 2015), ReionYuga code (Choudhury et al., 2009), (Majumdar et al., 2014), (Mondal et al., 2016) and thank the computational facilities of Indian Statistical Institute, Kolkata. AD thanks ISI Kolkata for financial support through Senior Research Fellowship and Abinash Kumar Shaw for useful discussions. SP thanks the Department of Science and Technology, Govt. of India for partial support through Grant No. NMICPS/006/MD/2020-21.
Data Availability
The simulated data underlying this work will be shared upon reasonable request to the corresponding author.
References
- Aghanim et al. (2020) Aghanim N., et al., 2020, Astronomy & Astrophysics, 641, A6
- Argüelles et al. (2021) Argüelles C. A., Diaz A., Kheirandish A., Olivares-Del-Campo A., Safa I., Vincent A. C., 2021, Reviews of Modern Physics, 93
- Barkana (2018) Barkana R., 2018, Nature, 555, 71–74
- Barkana et al. (2001) Barkana R., Haiman Z., Ostriker J. P., 2001, The Astrophysical Journal, 558, 482–496
- Bharadwaj & Srikant (2004) Bharadwaj S., Srikant P. S., 2004, Journal of Astrophysics and Astronomy, 25, 67–80
- Blas et al. (2011) Blas D., Lesgourgues J., Tram T., 2011, JCAP, 07, 034
- Blennow et al. (2008) Blennow M., Edsjö J., Ohlsson T., 2008, Journal of Cosmology and Astroparticle Physics, 2008, 021
- Boddy et al. (2018) Boddy K. K., Gluscevic V., Poulin V., Kovetz E. D., Kamionkowski M., Barkana R., 2018, Physical Review D, 98
- Bouwens et al. (2015) Bouwens R. J., Illingworth G. D., Oesch P. A., Caruana J., Holwerda B., Smit R., Wilkins S., 2015, Astrophys. J., 811, 140
- Bouwens et al. (2017) Bouwens R., Oesch P., Illingworth G., Ellis R., Stefanon M., 2017, The Astrophysical Journal, 843, 129
- Chatterjee & Bharadwaj (2018) Chatterjee S., Bharadwaj S., 2018, Monthly Notices of the Royal Astronomical Society, 483, 2269
- Chluba (2010) Chluba J., 2010, Monthly Notices of the Royal Astronomical Society, 402, 1195–1207
- Choudhury (2009) Choudhury T. R., 2009, Analytical Models of the Intergalactic Medium and Reionization (arXiv:0904.4596)
- Choudhury et al. (2009) Choudhury T. R., Haehnelt M. G., Regan J., 2009, Monthly Notices of the Royal Astronomical Society, 394, 960–977
- Cyr-Racine et al. (2016) Cyr-Racine F.-Y., Sigurdson K., Zavala J., Bringmann T., Vogelsberger M., Pfrommer C., 2016, Physical Review D, 93
- Dewdney & Braun (2016) Dewdney P. E., Braun R., 2016, SKA Organisation, 2, 1
- Di Valentino et al. (2018) Di Valentino E., Bœhm C., Hivon E., Bouchet F. R., 2018, Physical Review D, 97
- Escudero et al. (2015) Escudero M., Mena O., Vincent A. C., Wilkinson R. J., Bœhm C., 2015, Journal of Cosmology and Astroparticle Physics, 2015, 034–034
- Escudero et al. (2018a) Escudero M., Lopez-Honorez L., Mena O., Palomares-Ruiz S., Villanueva-Domingo P., 2018a, JCAP, 06, 007
- Escudero et al. (2018b) Escudero M., Lopez-Honorez L., Mena O., Palomares-Ruiz S., Villanueva-Domingo P., 2018b, Journal of Cosmology and Astroparticle Physics, 2018, 007–007
- Finkbeiner et al. (2012) Finkbeiner D. P., Galli S., Lin T., Slatyer T. R., 2012, Physical Review D, 85
- Frankiewicz (2015) Frankiewicz K., 2015, Searching for Dark Matter Annihilation into Neutrinos with Super-Kamiokande (arXiv:1510.07999)
- Furlanetto et al. (2004) Furlanetto S. R., Zaldarriaga M., Hernquist L., 2004, The Astrophysical Journal, 613, 16
- Galli et al. (2013) Galli S., Slatyer T. R., Valdes M., Iocco F., 2013, Physical Review D, 88
- Ghosh et al. (2020) Ghosh S., Khatri R., Roy T. S., 2020, Phys. Rev. D, 102, 123544
- Kulkarni et al. (2019) Kulkarni G., Keating L. C., Haehnelt M. G., Bosman S. E. I., Puchwein E., Chardin J., Aubert D., 2019, Mon. Not. Roy. Astron. Soc., 485, L24
- Majumdar et al. (2014) Majumdar S., Mellema G., Datta K. K., Jensen H., Choudhury T. R., Bharadwaj S., Friedrich M. M., 2014, Monthly Notices of the Royal Astronomical Society, 443, 2843–2861
- Mangano et al. (2006) Mangano G., Melchiorri A., Serra P., Cooray A., Kamionkowski M., 2006, Physical Review D, 74
- Mason et al. (2019) Mason C. A., et al., 2019, Mon. Not. Roy. Astron. Soc., 485, 3947
- Mesinger et al. (2016) Mesinger A., Greig B., Sobacchi E., 2016, Monthly Notices of the Royal Astronomical Society, 459, 2342–2353
- Mitra et al. (2015) Mitra S., Choudhury T. R., Ferrara A., 2015, Monthly Notices of the Royal Astronomical Society: Letters, 454, L76–L80
- Mondal et al. (2015) Mondal R., Bharadwaj S., Majumdar S., Bera A., Acharyya A., 2015, Monthly Notices of the Royal Astronomical Society: Letters, 449, L41–L45
- Mondal et al. (2016) Mondal R., Bharadwaj S., Majumdar S., 2016, Monthly Notices of the Royal Astronomical Society, 464, 2992–3004
- Mondal et al. (2020) Mondal R., Shaw A. K., Iliev I. T., Bharadwaj S., Datta K. K., Majumdar S., Sarkar A. K., Dixon K. L., 2020, Monthly Notices of the Royal Astronomical Society, 494, 4043–4056
- Mosbech et al. (2021) Mosbech M. R., Boehm C., Hannestad S., Mena O., Stadler J., Wong Y. Y. Y., 2021, JCAP, 03, 066
- Mosbech et al. (2022) Mosbech M. R., Boehm C., Wong Y. Y. Y., 2022, Probing dark matter interactions with SKA, doi:10.48550/ARXIV.2207.03107, https://arxiv.org/abs/2207.03107
- Olivares-Del Campo et al. (2018) Olivares-Del Campo A., Bœhm C., Palomares-Ruiz S., Pascoli S., 2018, Physical Review D, 97
- Paul et al. (2021) Paul A., Chatterjee A., Ghoshal A., Pal S., 2021, JCAP, 10, 017
- Randall et al. (2008) Randall S. W., Markevitch M., Clowe D., Gonzalez A. H., Bradač M., 2008, The Astrophysical Journal, 679, 1173–1180
- Repp et al. (2015) Repp A., Szapudi I., Carron J., Wolk M., 2015, Monthly Notices of the Royal Astronomical Society, 454, 3533
- Ricotti & Ostriker (2004) Ricotti M., Ostriker J. P., 2004, Monthly Notices of the Royal Astronomical Society, 352, 547
- Rubin & Ford (1970) Rubin V. C., Ford W. Kent J., 1970, ApJ, 159, 379
- Shaw et al. (2019) Shaw A. K., Bharadwaj S., Mondal R., 2019, Monthly Notices of the Royal Astronomical Society, 487, 4951–4964
- Shaw et al. (2020) Shaw A. K., Bharadwaj S., Mondal R., 2020, Monthly Notices of the Royal Astronomical Society, 498, 1480–1495
- Slatyer et al. (2009) Slatyer T. R., Padmanabhan N., Finkbeiner D. P., 2009, Physical Review D, 80
- Songaila & Cowie (2010) Songaila A., Cowie L. L., 2010, The Astrophysical Journal, 721, 1448–1466
- Stadler et al. (2019) Stadler J., Bœhm C., Mena O., 2019, Journal of Cosmology and Astroparticle Physics, 2019, 014–014
- Tegmark et al. (2004) Tegmark M., et al., 2004, Physical Review D, 69
- Villanueva-Domingo (2021) Villanueva-Domingo P., 2021, PhD thesis, U. Valencia (main), Valencia U. (arXiv:2112.08201)
- Wang et al. (2020) Wang F., et al., 2020, Astrophys. J., 896, 23
- Wilkinson et al. (2014) Wilkinson R. J., Bœhm C., Lesgourgues J., 2014, Journal of Cosmology and Astroparticle Physics, 2014, 011–011