Tubulation and dispersion of oil by bacterial growth on droplets
Abstract
Bacteria on surfaces exhibit collective behaviors, such as active turbulence and active stresses, which result from their motility, growth, and interactions with their local surroundings. However, interfacial deformations on soft surfaces and liquid interfaces caused by active growth, particularly over long time scales, are not well understood. Here, we describe experimental observations on the emergence of tubular structures arising from the growth of rod-shaped bacteria at the interface of oil droplets in water. Using microfluidics and timelapse microscopy, the dimensions and extension rates of individual tubular structures as well as bulk bio-aggregate formation are quantified for hundreds of droplets over 72 hours. Tubular structures are comparable in length to the initial droplet radius and are composed of an outer shell of bacteria that stabilize an inner filament of oil. The oil filament breaks up into smaller microdroplets dispersed within the bacterial shell. This work provides insight into active stresses at deformable interfaces and improves our understanding of microbial oil biodegradation and its potential influence on the transport of droplets in the ocean water column.
pacs:
XX.xx.xxI Introduction
Active matter refers to systems that exchange energy with their surroundings, leading to behaviors that are unlikely at thermal equilibrium. Active systems consisting of simple building blocks can give rise to complex and emergent phenomena. Examples range across many scales, from actin microfilaments and clusters of cells Doostmohammadi et al. (2018); Copenhagen and Gopinathan (2016) to flocks of birds Bialek et al. (2014) and schools of fish Herbert-Read et al. (2011). The study of active materials shows promise for uncovering new physics, with potential applications in a variety of disciplines, including statistical and biological physics Bechinger et al. (2016); Ramaswamy (2010), soft matter Doostmohammadi et al. (2018); Marchetti et al. (2013), biomedicine Wang and Gao (2012), materials science Needleman and Dogic (2017), and traffic engineering Helbing (2001).
Active particles confined to interfaces form a rich subset of active systems of particular interest to physical and biological research communities. Both living and non-living interfacial systems can exhibit complex behaviors far from thermal equilibrium including collective motility, swarming, and active turbulence Copenhagen and Gopinathan (2016); Metselaar et al. (2019); Guillamat et al. (2017). These emergent behaviors are believed to play an important role in biological phenomena such as cellular transport Sanchez et al. (2012); Woodhouse and Goldstein (2012), self-assembly of microtubules and motor proteins Kruse et al. (2004); Surrey et al. (2001), clusters of sperm or epithelial cells Creppy et al. (2015); Blanch-Mercader et al. (2018), and bacterial or algal colonies Lauga et al. (2006); Berke et al. (2008).
Because of their simplicity, single-celled bacteria are an especially useful model organism to explore how complex behavior emerges in collections of simple components Aranson (2022). Studies have explored the ways in which monolayers of motile bacteria give rise to active behavior Cisneros et al. (2007). Other researchers have created artificial micro- or nanoswimmers to mimic the self-propulsion observed in living cells Gompper et al. (2020); Tsang et al. (2020). Rod-shaped bacteria in particular are known for their tendency to align and self-organize at interfaces Doostmohammadi et al. (2018). The orientational ordering of such bacteria can greatly increase the magnitude of the stresses exerted on the substrate by either motility or growth of the cells. However, self-organization of bacterial colonies has mostly been studied on rigid interfaces, where interfacial deformations can be neglected. In many systems this assumption does not always hold, and possible re-organization of the active material’s environment must be considered Bechinger et al. (2016).
Other active systems have been studied for the interfacial deformations that can result from the collective motion of active particles. For example, self-propelled particles enclosed within giant vesicles can induce a variety of non-equilibrium shapes in the membrane Vutukuri et al. (2020); Alert (2022). A common deformation mode in active systems is tubulation: the emergence of high-aspect-ratio tubular structures from an interface. This process has been studied extensively of liposomes or vesicles, where a phospholipid bilayer folds onto itself to form a protrusion from the cell Lamazière et al. (2007); Roux et al. (2002); Osawa et al. (2009). Tubulation can also be driven by a layer of filaments, such as FtsZ or microtubules, that coat the surface of the vesicle Keber et al. (2014); Kumar et al. (2019). Recently, generic models have been developed to describe how active nematics, such as collections of rod-shaped particles, produce tube-like deformation on deformable interfaces Metselaar et al. (2019); Hoffmann et al. (2022). To verify the generality of these results, it is important to determine experimentally whether other model active nematics such as rod-shaped bacteria can produce similar morphologies.
The study of bacteria at oil-water interfaces is important because of its relevance to oil spill remediation research. After a deep-sea oil spill, oil-degrading bacteria such as Alcanivorax borkumensis Yakimov et al. (1998) play a crucial role in removing oil from marine ecosystems Head et al. (2006); Passow and Hetland (2016); Passow and Overton (2021). The process of biodegradation has primarily been studied using in situ samples and batch reactors Kleindienst et al. (2015); Brakstad et al. (2014); Prince and Butler (2014), which cannot reveal the underlying physics at the oil-water interface. Many open questions remain, particularly regarding how microscopic droplets of oil in sub-surface plumes can be biodegraded Hazen et al. (2010); McFarlin et al. (2014).
The effect of droplet size on degradation rates (including the effect of surfactants and chemical dispersants) is especially contentious Kleindienst et al. (2015); Prince (2015). Recent studies have examined how oil-degrading bacteria attach to oil droplets and form aggregates such as biofilms at the interface Bookstaver et al. (2015); Abbasi et al. (2018); Omarova et al. (2019). However, none have considered the complex deformations to the oil-water interface that can arise as a result of cell growth. Studies of individual droplets under environmentally relevant conditions are needed to better understand the fate of spilled oil Lee et al. (2013); White et al. (2019). In particular, direct observation of individual droplets with high spatial and temporal resolution can shed light on the biomechanics of oil biodegradation.
The self-organization and collective behavior of growing bacteria at liquid interfaces has recently been shown to lead to the colonization and buckling of oil droplets Fernandez et al. (2022); Hickl and Juarez (2022). Here, we describe the extreme deformations of the oil-water interface and dispersion of oil caused by the growth of bacteria on spherical droplets. Using microfluidics and timelapse microscopy, hundreds of oil droplets of sizes µm µm are observed simultaneously and continuously over 72 hours. Confined cell growth leads to tubulation at the interface. We describe the underlying structure and composition of the tubes, which can form a dense bio-aggregate in which oil is dispersed as smaller droplets. Image analysis is used to measure the tube and bio-aggregate extension rate, bio-aggregate size, and size distribution of micro-dispersed droplets. These phenomena demonstrate how the growth of simple, non-motile active particles on an interface can lead to the emergence of complex interfacial deformations. The ability to visualize these processes has important benefits for the study of bacterial biodegradation of oil and, more generally, the interactions between fluid interfaces and active matter.
II Experimental methods
The species used in experiments was Alcanivorax borkumensis, a known anaerobic oil-degrading bacterium. Cells are rod-shaped which average length µm and width µm. Cells were grown in a culture medium consisting of 37.4 g/L 2216 marine broth (BD Difco) and 10 g/L sodium pyruvate in an orbital shaker at 180 rpm and C. At the start of each experiment, a cell culture in the late exponential phase is diluted in culture medium to an optical density , measured using a Biowave CO8000 cell density meter. Then, the suspension was further diluted in artificial seawater (ASW). This process ensures that the initial cell concentration in all experiments is the same. The mean buckling time of the cells in culture medium was measured to be hours.
A custom microfluidic chamber was constructed to visualize the time evolution of oil droplets colonized by bacteria Hickl and Juarez (2022). To create droplets on a glass microscope slide, a thin film of µL of either unweathered MC252 crude oil or mineral oil was formed. MC252 is a light sweet crude oil with a density of g/mL, an interfacial tension of mN/m, and a viscosity of mPa s at C Daling et al. (2014). Then, µL of the dilute A. borkumensis suspension was dripped on top of the oil. This aqueous solution initiated the formation of spherical caps pinned to the glass slide. The droplet size range was µm µm. The caps contained of the volume of a sphere with the same diameter, on average. Then, inlets and outlets made of polyethylene tubing were attached to both ends of the device. Lastly, the chamber was sealed using silicone rubber sheets (McMaster-Carr) and epoxy. The chamber dimensions () were .
To maintain cultures within the chamber for 72 hours, a syringe pump was used to continuously inject a solution of diluted culture medium and ASW (1:9). In the experiments where bacteria cells were stained, a solution of 5 mM SYTO 9 nucleic acid stain (Sigma Aldrich) was added to the solution of diluted culture medium and ASW. These solutions were injected into the chamber at a flow rate of mL/min, generating an average flow speed of µm/s and a Reynolds number of . Here, is the fluid density, is the mean flow speed, is the equivalent diameter of the channel, and is the fluid viscosity. Experiments were performed at a room temperature of C.
Using timelapse phase contrast and epi-fluorescence microscopy, images of over droplets were taken every 10 minutes in each experiment. Image capture of each droplet was performed at 40X magnification using a Nikon Ti Eclipse equipped with an automated motor-controlled stage and an Andor Zyla 4.2 sCMOS camera.
III Results
III.1 Oil droplet evolution
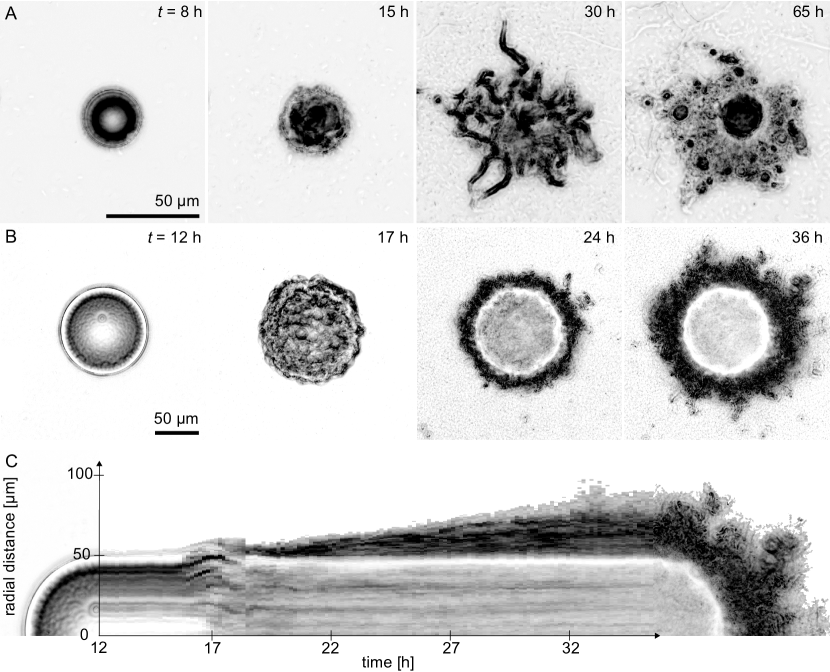
Prolonged growth of bacteria on oil droplets leads to extreme deformations of the interface. The mechanism driving this process is the competition between the effects of cell growth and the surface tension of the oil-water interface. Images of the time evolution of two droplets of radii µm and µm are shown in Fig. 1A and 1B, respectively (see also Supplementary videos 1 and 2). Buckling of the interface occurs shortly after bacteria fully cover the droplet surface, shown in Fig. 1A, h and Fig. 1B, h. Then, tube-like structures emerge from the interface, extending outward from the droplet surface. For droplets with initial radius µm, individual tubes remain distinct, as shown in Fig. 1A, h. By contrast, for droplets with µm, tubes become densely packed, forming a continuous bio-aggregate around a droplet, shown in Fig. 1B, h . These deformations are qualitatively the same for both crude oil and mineral oil.
To visualize the rich dynamics of the system, including the expansion of the bio-aggregate, vertical slices were taken through the center of each image in a timelapse of a droplet’s evolution. These slices were then arranged next to one another to form a spacetime plot showing bio-aggregate expansion over time. For example, the spacetime plot of the expansion of the bio-aggregate around a droplet with µm is shown in in Fig. 1C. Over 1–2 days after tubes and bio-aggregates stop growing, oil within the tubes breaks up and coalesces into spherical droplets, shown in Fig. 1A, h.
III.2 Bio-aggregate composition
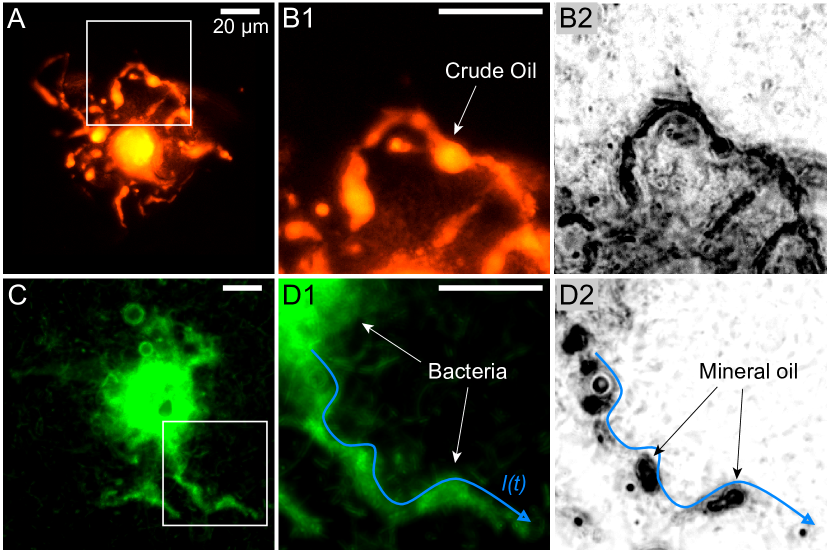
To determine the composition of the bio-aggregate, fluorescence microscopy was used to visualize the distribution of crude oil after droplets were deformed, since the crude oil used is autofluorescent in the visible spectrum. In other experiments, cells were dyed with SYTO 9 nucleic acid stain to visualize the distribution of bacteria around deformed droplets. To visualize only the bacteria, non-fluorescent mineral oil was used in experiments with SYTO 9. Phase contrast microscopy was also used to observe all parts of the system simultaneously regardless of the type of oil. Thus, the distribution of both oil and bacteria around deformed droplets was determined.
The tubes protruding from the oil-water interface contain both oil and bacteria. An example of a deformed crude oil droplet of µm after 50 hours is shown in Fig. 2A. The orange (false color) corresponds to crude oil when visualized using fluorescence microscopy. Oil is present throughout the tube of length 60 µm, which extends from the droplet surface in Fig. 2B1. When visualized using phase contrast, the oil (black) can be seen in sharp contrast against the surrounding bacteria (grey) and device background (white), as in Fig. 2B2. A mineral oil droplet of initial radius µm after 48 hours is shown in Fig. 2C. Bacteria can be seen in green (false color) around both the original spherical droplet and a tube of length µm protruding from the surface in Fig. 2D1. As before, phase contrast images show the dark crude oil present within the tube shown in Fig. 2D2. Together, these images show that the tubular structures in our experiments are tubes of oil surrounded and stabilized by a shell of bacteria.
III.3 Tube extension
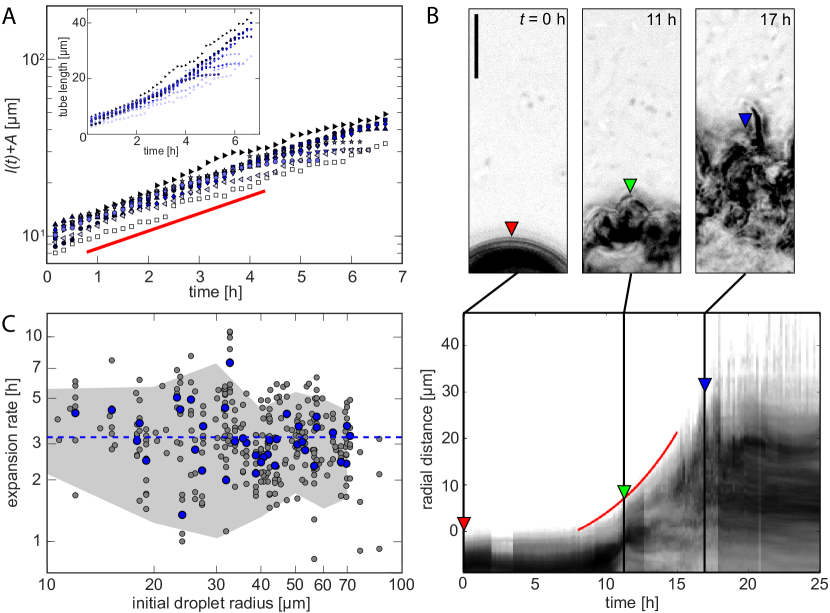
Having determined the composition of the tubes, the dynamics of their extension from the droplet surface over time are now described. The contour length of a tube is represented by the blue line in Fig. 2D, where µm. The contour length was measured in successive frames of the timelapse for tubes that remained in focus throughout the experiment. The extension of ten representative tubes from different droplets over 4-7 hours is shown in Fig. 3A, inset. Here corresponds to the time when each tube begins to extend from the droplet surface. For the first few hours, appears to increase exponentially with time. Final tube lengths are in the range µm µm with a mean of µm based on 125 different tubes.
III.4 Bio-aggregate expansion
Next, the expansion over time of bio-aggregates, which consist of many densely packed tubes of oil and bacteria, is described. The bio-aggregate expansion from a point on a droplet with µm at , , and h after buckling is shown in Fig. 3B. A spacetime plot was created by taking a vertical slice of each frame in the timelapse and arranging them next to one another, as in the bottom half of Fig. 3B. This plot shows the expansion of the bio-aggregate. The colored arrows show the edge of the bio-aggregate, which was used to measure the radial extent of the aggregate from the droplet surface in each frame of the timelapse. As with individual tube length, the initial aggregate expansion over time is exponential. An exponential curve fitted to the data is shown Fig. 3B, red line. Here the doubling time of the aggregate is hours.
The expansion rate is, on average, independent of initial droplet radius. The expansion rate was measured at 5–10 different points along the perimeter of 42 different droplets with µm, giving a total of 323 measurements of the expansion rate, shown in Fig. 3C, grey points. Averaging the measurements from each droplet gives the mean expansion rate for that droplet, shown in Fig. 3C, blue points. Mean expansion rates range from 1.3 h to 7.5 h (including outliers), with 88% of measurements ranging from 2 h and 5 h. For all droplets, the mean is h, as shown in Fig. 3C, blue dashed line. The expansion rate does not depend on the initial droplet size ().
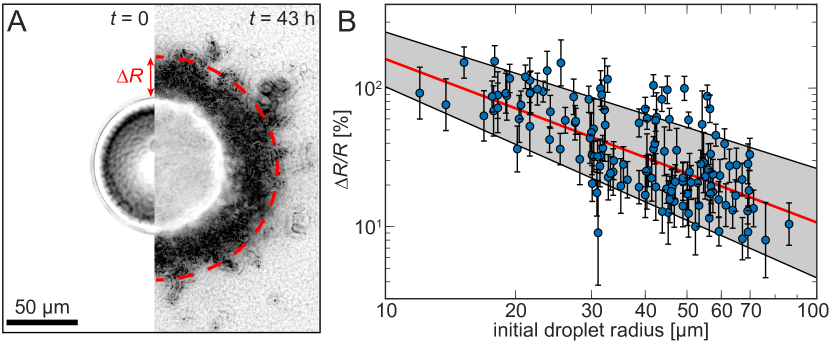
The emergence of a bio-aggregate caused by interfacial growth of bacteria significantly increases the effective size of oil droplets. A side-by-side comparison of a droplet of crude oil with µm before () and after ( h) it is colonized and deformed by bacteria is shown in Fig. 4A. The bio-aggregate size is defined as the distance between initial surface of the droplet at and the edge of the aggregate at the end of the experiment. This distance is measured radially at many points along the droplet’s perimeter. The mean aggregate size for this droplet is µm, or of the initial droplet radius, as shown in Fig. 4A, red line. In fact, is approximately equal to the mean final tube length of µm, shown in 3A, inset.
The relative increase in droplet size due to aggregate expansion is larger for small droplets. The quantity for 131 droplets is shown in Fig. 4B. Error bars represent the variation in bio-aggregate size along the droplets’ perimeters. The change in size varies from to , with a mean value of . The value of itself ranges from µm to µm. Power law fitting (red line) shows that , suggesting that is, on average, independent of the initial droplet radius , and that tube length is independent of droplet size. Consequently, the relative increase in total size tends to be greater for smaller droplets.
III.5 Secondary droplet formation
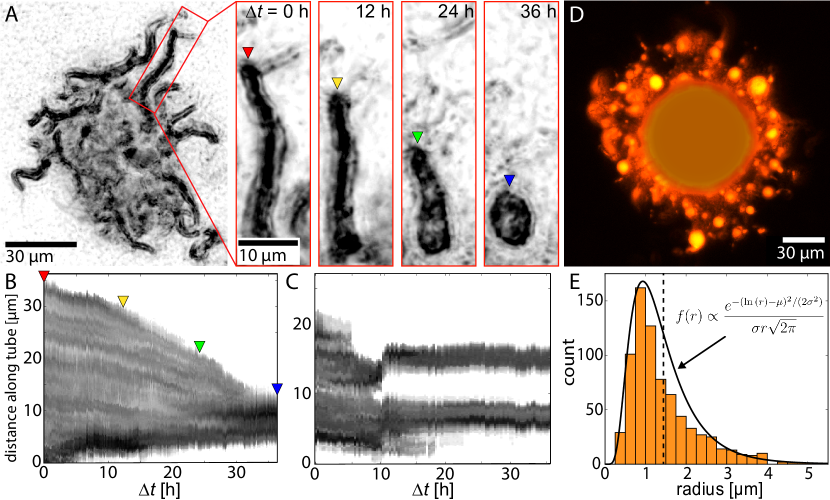
Finally, the changes in oil morphology within tubes are examined, which occur over 1–2 days after tubes and bio-aggregates form. The oil within each cylindrical tube coalesces into one or more spheres, or secondary droplets. An extremely deformed droplet with µm after 21 hours is shown in Fig. 5A. Insets show the evolution of the oil (dark) within a tube of length µm over 36 hours. Initially the oil fills the entire length of the tube, but then shrinks toward the base of the tube and coalesces into a spherical droplet of radius µm at 36 hours (see Supplementary video 3). A spacetime plot qualitatively describes the evolution of oil coalescing within this tube, shown in Fig. 5B. Colored arrows show the edge of the oil within the tube at different times. The oil in different tubes can break up into between 1 and 7 smaller droplets. A spacetime plot of oil breaking up and coalescing into 2 distinct droplets of radii µm and µm, respectively, is shown in 5C (see also Supplementary video 4).
After the system reaches a steady state, fluorescence microscopy was used to observe the secondary droplets embedded in the bio-aggregate, as shown in Fig. 5D. Using a z-stack with height increments of 2 µm, all secondary droplets within the bio-aggregate were identified and their sizes measured. A histogram of the radii of secondary droplets () is shown in Fig. 5E. These data were taken from tubes and bio-aggregates surrounding many different droplets with . Secondary droplet radii are in the range with a mean of µm — more than an order of magnitude smaller than the original droplet sizes. The secondary droplets’ size appears to follow a lognormal distribution:
| (1) |
with parameters and , shown in Fig. 5E, black line.
III.6 Model of tube extension
Since tube and bio-aggregate expansion are exponential, and bacteria appear to cover the oil-water interface throughout the experiment, we suggest that the emergence of these complex structures is driven solely by the growth and division of cells confined to the interface. Here we present a mechanistic model of tube formation to quantify the relationship between cell growth and tubulation.
We assume that tubes begin to extend from a droplet when bacteria have formed a complete monolayer of cells at the interface. To continue to grow at the interface, cells must deform the oil droplet to increase the surface area. Assuming that the density of cells at the interface remains constant, and that cells remain as a monolayer, the interfacial area must increase proportionally to the number of cells:
| (2) |
where is the cell doubling time, and is the initial radius of the droplet. At , tubes of oil begin to emerge from the interface. We assume that the total volume of oil remains constant (i.e., the oil is incompressible and loss of volume from degradation is negligible):
| (3) |
Over time, the total surface area and volume of the oil-water interface is given by
| (4) |
| (5) |
where is the number of tubes, is the tube radius, and and are the time-varying droplet radius and tube contour length, respectively. Combining Eqns. (3), (4) and (5) gives
| (6) |
For values of the parameters pertaining to this system, the second term in brackets is much less than unity. That is, up to a constant, the volume of oil in the tubes is much less than the total volume, which is in qualitative agreement with observations. So, to first order in , we find that:
| (7) |
Finally, we substitute Eqn. (2) and , where is the mean separation of tubes at the interface, to find:
| (8) |
Thus, the model predicts that, because of the exponential growth of bacteria at the interface, the tube length plus a constant increases exponentially with time:
| (9) |
where
| (10) |
To test the predictions of Eqn. (7), is plotted on a semilog scale, shown in Fig. 3A. The following experimental values were used to compute : µm, µm, and µm. The quantity increases exponentially with time, as predicted by the model, with a mean doubling time of h and a standard deviation of h, shown in Fig. 3A. Fitting is performed only for the time range when tubes are increasing in length. The hypothesis that tube extension is driven by cell division is further supported by the fact that no dependence was found between the tubes’ extension rate and initial droplet size.
IV Discussion
The deformations of the oil-water interface are the result of the complex interactions between surface tension and the growth of surface-attached bacteria. Without bacteria, interfacial deformations are energetically unfavorable, and droplets remain spherical. The attachment and growth of bacteria leads to multiple effects that promote deformations.
First, attachment of bacteria to the interface reduces the energy of the system by reducing the oil-water surface area. This effect exists for any colloidal particle attached to a liquid-liquid interface. Bacterial attachment being energetically favorable is consistent with our observation of no detachment of cells from the interface before droplets buckle of the experiments. The energy cost of increasing the area of the oil droplet can be mitigated significantly if the surface is covered by bacteria. The magnitude of the reduction in energy depends on the wettability of the cells, which could not be determined in our experiments. Other oil-degrading bacteria, such as Pseudomonas putida, have been shown to reduce the oil-water surface tension by more than half as a result of cell hydrophobicity Rühs et al. (2014).
Second, the growth of surface-attached cells produces mechanical forces on the interface that oppose surface tension. This effect is similar to what happens when a droplet or bubble covered in colloidal particles shrinks, leading to buckling of the interface Datta et al. (2010); Poulichet and Garbin (2015); Xu et al. (2005). In these systems, a fluid-to-solid transition (jamming) of the colloidal shell occurs because of an increase in the density of particles on the surface. In our system, a similar increase in particle density results from the growth of bacteria. Additionally, as a form of active matter, growing monolayers of rod-shaped bacteria produce collective stresses as a result of their orientational order, particularly at a bounded interface You et al. (2018, 2021). After the oil-water interface buckles, continued growth of bacteria causes tubular structures to emerge.
Third, A. borkumensis is known to produce biosurfactants at the oil-water interface Omarova et al. (2019); Yakimov et al. (1998), further facilitating interfacial deformations by reducing surface tension. Further research is needed to construct a model that accurately describes the bacteria’s collective behavior, including the fluid-to-solid transition that leads to buckling and tubulation. Such a model would include the competing effects of surface tension and active growth stresses, which can be tuned to give rise to the droplet morphologies observed in our experiments.
IV.1 Tubulation and bio-aggregate expansion
In our experiments, tubulation is observed around droplets of crude or mineral oil covered in rod-shaped bacterial cells. One key difference between the system we describe and those in other studies is that the activity of cells at the oil-water interface is caused solely by cell growth and division, rather than motility.
Our experimental results on the dynamics of tube growth are consistent with the mechanistic model described in § III D, suggesting that tube extension is driven by an exponentially growing monolayer of cells confined to the interface. Additionally, the average extension rate of individual tubular structures from the interface ( h) was found to be roughly the same as the mean expansion rate of the bio-aggregate ( h). This result supports the hypothesis that bio-aggregate expansion is driven by tube extension. Thus, fundamentally, the emergent phenomena observed in our experiments are driven by by the division of densely packed, rod-shaped cells at a deformable interface. In our previous work, the doubling time of dilute cells on a flat oil-water interface was measured to have a mean of h Hickl and Juarez (2022). The slower doubling times observed here suggest that cells at the interface divide more slowly when they are densely packed (such as during tube formation) than when they are dilute.
For many droplets, the expansion rates measured at different points on the droplet’s surface differ by several hours (Fig. 3C). This observation is consistent with the variation in around individual droplets (error bars in Fig. 4B) and can be explained by differences in the direction of tube extension. Images of tubes of oil show that tubes are highly non-linear such as in Fig. 2. Measured values of both the aggregate expansion rate and its size are larger where tubes extend directly radially outward, compared to where they extend from a droplet’s surface at an angle. Thus, variation in the experimental values of these variables is consistent with the relatively uniform values of tube extension rate ( h) and the cell doubling time ( h) observed.
These results show that a growing colony of rod-shaped bacteria confined to a liquid interface can produce morphologies similar to those observed in other active nematic systems. Tube-like protrusions like the ones described here are often associated with topological defects in the orientational order of an active nematic, both in general models Hoffmann et al. (2022) and in specific realizations such as deformable vesicles Kumar et al. (2019) or regenerating epithelial tissues Mar (2020). To our knowledge, we are the first to show that tubulation can occur as a result of growing bacterial colonies. Notably, the tubes described here can remain stable for many hours after they form, unlike tubes around deformable vesicles which tend to disappear and retract quickly Keber et al. (2014); Metselaar et al. (2019) because of surface tension. Additionally, tube-like protrusions are commonly associated with topological defects, whereas the defects in 2D bacterial colonies typically have charges of . More work is required to determine how the orientational order of the cells is related to the deformations we observe. By rigorously quantifying both the shape and dynamics of these deformations, we hope to pave the way towards more precise quantitative comparisons between models and experiments of active nematic systems.
IV.2 Implications for oil spill research
The deformations observed in these experiments could affect the fate of marine spilled oil by increasing the bio-availability of oil to bacteria and influencing the transport of oil droplets. The droplet radii studied here ( µm µm) fall in the range observed in deep-sea plumes of oil following the Deepwater Horizon spill in 2010 (approximately µm µm) Li (2015). Such plumes of oil have been studied in situ Camilli et al. (2010) and in computational models of oil transport North et al. (2015); Paris et al. (2012); Lindo-Atichati et al. (2016), with mean droplet radii typically given on the order of 10 µm. However, to our knowledge, models of oil transport have not considered the interfacial deformations or the expansion of a bio-aggregate that can result from the colonization of the interface by bacteria. Models that attempt to account for oil biodegradation simply treat droplets as shrinking spheres North et al. (2015).
Our experiments show that the growth of bacteria on the droplet surface greatly increases the area of the oil-water interface, thereby increasing the bioavailability of oil to bacteria. Based on the average dimensions and density of tubes measured in experiments, the total area of the interface increases by a factor of 6, on average. Additionally, the formation of a bio-aggregate can increase the effective droplet size by as much as a factor of 2. Such expansion would significantly impact the droplet’s buoyancy and increase the drag force on it White et al. (2020). Thus, the effects of bacterial growth must be taken into account to accurately assess the fate of spilled oil White et al. (2019). The formation of a dense bio-aggregate was observed only for droplets with µm, demonstrating that droplet size is crucial in determining how the oil is colonized and deformed. Further research is currently being done to assess these effects precisely, both through models of oil transport and laboratory experiments of rising droplets.
Oil can be further dispersed within tubes as it breaks up and coalesces into smaller droplets of average radius µm — more than an order of magnitude smaller than the mean initial droplet radius . Mechanically, the breakup of tubes is likely the result of a Plateau-Rayleigh or pearling instability Bar-Ziv et al. (1999); Nelson et al. (1995); Alstrøm et al. (1999), which causes periodic perturbations in the tube radius to grow over time. In general, surface tension drives droplets to become spherical to minimize the size of the interface, while interfacial cell growth and biosurfactant production drive deformations such as tube formations. After tube extension ends, the oil in the tubes slowly breaks up to form spherical drops embedded in the bioaggregate. This observation suggests that, over time, biosurfactant production by A. borkumensis is reduced, and that existing biosurfactant molecules do not remain at the interface indefinitely. Thus, surface tension once again becomes the dominant effect, causing a reduction in the surface area of the oil-water interface. The biological reason for the cessation of biosurfactant production is not know, but could be related to nutrient depletion in the bioaggregate. This phenomenon needs further investigation as it could have important implications for the degradation of these secondary droplets.
V Conclusions
We conducted experiments to describe the deformations of oil-in-water droplets caused by the active growth of bacteria. As active stresses overcome surface tension, tubes of oil stabilized by bacteria extend exponentially from the interface in order for surface-bound cells to continue dividing. These tubes form a dense bio-aggregate around the droplets, enlarging the droplets significantly. The emergence of tubes and bio-aggregates is highly non-linear, but can be modeled accurately with simple statistical arguments and minimal assumptions. Finally, oil in tubes undergoes breakup into smaller spherical droplets as a result of an instability driven by surface tension. This dispersion of oil significantly increases the surface area of the oil and its bio-availability to the bacteria.
This system is a novel example of active matter physics in a biological system, displaying emergent phenomena that arise from the collective behaviors of a large number of cells far from thermodynamic equilibrium. Our analysis demonstrates how direct visualization combined with models of the system’s basic properties can shed light on the underlying physics of complex systems. This research also improves our understanding of the biophysical mechanisms underlying bacterial biodegradation of spilled oil. To our knowledge, the precise deformations of oil droplets due to growth of oil-degrading bacteria had not been described precisely to date. These phenomena are believed to affect both oil degradation rates and transport of droplets through the ocean. Thus, this work can be a stepping stone towards significant improvements in our understanding of the fate of spilled oil in the open ocean.
VI Conflicts of Interest
There are no conflicts of interest to declare.
VII Acknowledgments
This material is based on work supported by the Oil Spill Recovery Institute under Contract No. 20-10-06. We thank Seppe Kuehn and Karna Gowda for useful conversations on cell culturing techniques and Mark Levenstein for useful conversations on data analysis and presentation.
References
- Doostmohammadi et al. (2018) A. Doostmohammadi, J. Ignés-Mullol, J. M. Yeomans, and F. Sagués, Nature Communications 9, 3246 (2018).
- Copenhagen and Gopinathan (2016) K. Copenhagen and A. Gopinathan, Frontiers in Materials 3, 1 (2016).
- Bialek et al. (2014) W. Bialek, A. Cavagna, I. Giardina, T. Mora, O. Pohl, E. Silvestri, M. Viale, and A. M. Walczak, Proceedings of the National Academy of Sciences of the United States of America 111, 7212 (2014).
- Herbert-Read et al. (2011) J. E. Herbert-Read, A. Perna, R. P. Mann, T. M. Schaerf, D. J. Sumpter, and A. J. Ward, Proceedings of the National Academy of Sciences of the United States of America 108, 18726 (2011).
- Bechinger et al. (2016) C. Bechinger, R. Di Leonardo, H. Löwen, C. Reichhardt, G. Volpe, and G. Volpe, Reviews of Modern Physics 88, 045006 (2016).
- Ramaswamy (2010) S. Ramaswamy, Annual Review of Condensed Matter Physics 1, 323 (2010).
- Marchetti et al. (2013) M. C. Marchetti, J. F. Joanny, S. Ramaswamy, T. B. Liverpool, J. Prost, M. Rao, and R. A. Simha, Reviews of Modern Physics 85, 1143 (2013).
- Wang and Gao (2012) J. Wang and W. Gao, ACS Nano 6, 5745 (2012).
- Needleman and Dogic (2017) D. Needleman and Z. Dogic, Nature Reviews Materials 2, 1 (2017).
- Helbing (2001) D. Helbing, Reviews of Modern Physics 73, 1067 (2001).
- Metselaar et al. (2019) L. Metselaar, J. M. Yeomans, and A. Doostmohammadi, Physical Review Letters 123, 208001 (2019).
- Guillamat et al. (2017) P. Guillamat, J. Ignés-Mullol, and F. Sagués, Nature Communications 8, 1 (2017).
- Sanchez et al. (2012) T. Sanchez, D. T. Chen, S. J. Decamp, M. Heymann, and Z. Dogic, Nature 491, 431 (2012).
- Woodhouse and Goldstein (2012) F. G. Woodhouse and R. E. Goldstein, Physical Review Letters 109, 168105 (2012).
- Kruse et al. (2004) K. Kruse, J. F. Joanny, F. Jülicher, J. Prost, and K. Sekimoto, Physical Review Letters 92, 078101 (2004).
- Surrey et al. (2001) T. Surrey, F. Nédélec, S. Leibler, and E. Karsenti, Science 292, 1167 (2001).
- Creppy et al. (2015) A. Creppy, O. Praud, X. Druart, P. L. Kohnke, and F. Plouraboué, Physical Review E - Statistical, Nonlinear, and Soft Matter Physics 92, 032722 (2015).
- Blanch-Mercader et al. (2018) C. Blanch-Mercader, V. Yashunsky, S. Garcia, G. Duclos, L. Giomi, and P. Silberzan, Physical Review Letters 120, 208101 (2018).
- Lauga et al. (2006) E. Lauga, W. R. DiLuzio, G. M. Whitesides, and H. A. Stone, Biophysical Journal 90, 400 (2006).
- Berke et al. (2008) A. P. Berke, L. Turner, H. C. Berg, and E. Lauga, Physical Review Letters 101, 038102 (2008).
- Aranson (2022) I. Aranson, Reports on Progress in Physics (2022).
- Cisneros et al. (2007) L. H. Cisneros, R. Cortez, C. Dombrowski, R. E. Goldstein, and J. O. Kessler, Experiments in Fluids 43, 737 (2007).
- Gompper et al. (2020) G. Gompper, R. G. Winkler, T. Speck, A. Solon, C. Nardini, F. Peruani, H. Löwen, R. Golestanian, U. B. Kaupp, L. Alvarez, T. Ki rboe, E. Lauga, W. C. Poon, A. Desimone, S. Muiños-Landin, A. Fischer, N. A. Söker, F. Cichos, R. Kapral, P. Gaspard, M. Ripoll, F. Sagues, A. Doostmohammadi, J. M. Yeomans, I. S. Aranson, C. Bechinger, H. Stark, C. K. Hemelrijk, F. o. J. Nedelec, T. Sarkar, T. Aryaksama, M. Lacroix, G. Duclos, V. Yashunsky, P. Silberzan, M. Arroyo, and S. Kale, Journal of Physics Condensed Matter 32 (2020).
- Tsang et al. (2020) A. C. H. Tsang, E. Demir, Y. Ding, and O. S. Pak, Advanced Intelligent Systems 2 (2020).
- Vutukuri et al. (2020) H. R. Vutukuri, M. Hoore, C. Abaurrea-Velasco, L. van Buren, A. Dutto, T. Auth, D. A. Fedosov, G. Gompper, and J. Vermant, Nature 586, 52 (2020).
- Alert (2022) R. Alert, Journal of Physics A: Mathematical and Theoretical 55 (2022).
- Lamazière et al. (2007) A. Lamazière, F. Burlina, C. Wolf, G. Chassaing, G. Trugnan, and J. Ayala-Sanmartin, PLoS ONE 2, e201 (2007).
- Roux et al. (2002) A. Roux, G. Cappello, J. Cartaud, J. Prost, B. Goud, and P. Bassereau, Proceedings of the National Academy of Sciences of the United States of America 99, 5394 (2002).
- Osawa et al. (2009) M. Osawa, D. E. Anderson, and H. P. Erickson, The EMBO Journal 28, 3476 (2009).
- Keber et al. (2014) F. C. Keber, E. Loiseau, T. Sanchez, S. J. DeCamp, L. Giomi, M. J. Bowick, M. C. Marchetti, Z. Dogic, and A. R. Bausch, Science 345, 1135 (2014).
- Kumar et al. (2019) G. Kumar, N. Ramakrishnan, and A. Sain, Physical Review E 99, 022414 (2019).
- Hoffmann et al. (2022) L. A. Hoffmann, L. N. Carenza, J. Eckert, and L. Giomi, Science Advances 8 (2022).
- Yakimov et al. (1998) M. M. Yakimov, P. N. Golyshin, S. Lang, E. R. B. Moore, W.-R. Abraham, H. Lunsdorf, and K. N. Timmis, International Journal of Systematic Bacteriology 48, 339 (1998).
- Head et al. (2006) I. M. Head, D. M. Jones, and W. F. M. Röling, Nature reviews. Microbiology 4, 173 (2006).
- Passow and Hetland (2016) U. Passow and R. Hetland, Oceanography 29, 88 (2016).
- Passow and Overton (2021) U. Passow and E. B. Overton, Annual Review of Marine Science 13 (2021).
- Kleindienst et al. (2015) S. Kleindienst, M. Seidel, K. Ziervogel, S. Grim, K. Loftis, S. Harrison, S. Y. Malkin, M. J. Perkins, J. Field, M. L. Sogin, T. Dittmar, U. Passow, P. M. Medeiros, and S. B. Joye, Proceedings of the National Academy of Sciences of the United States of America 112, 14900 (2015).
- Brakstad et al. (2014) O. G. Brakstad, P. S. Daling, L.-G. Faksness, I. K. Almås, S.-H. Vang, L. Syslak, and F. Leirvik, Marine Pollution Bulletin 84, 125 (2014).
- Prince and Butler (2014) R. C. Prince and J. D. Butler, Environmental Science and Pollution Research 21, 9506 (2014).
- Hazen et al. (2010) T. C. Hazen, E. A. Dubinsky, T. Z. DeSantis, G. L. Andersen, Y. M. Piceno, N. Singh, J. K. Jansson, A. Probst, S. E. Borglin, J. L. Fortney, W. T. Stringfellow, M. Bill, M. E. Conrad, L. M. Tom, K. L. Chavarria, T. R. Alusi, R. Lamendella, D. C. Joyner, C. Spier, J. Baelum, M. Auer, M. L. Zemla, R. Chakraborty, E. L. Sonnenthal, P. D’haeseleer, H.-Y. N. Holman, S. Osman, Z. Lu, J. D. Van Nostrand, Y. Deng, J. Zhou, and O. U. Mason, Science (New York, N.Y.) 330, 204 (2010).
- McFarlin et al. (2014) K. M. McFarlin, R. C. Prince, R. Perkins, and M. B. Leigh, PLoS ONE 9 (2014).
- Prince (2015) R. C. Prince, Environmental Science and Technology 49, 6376 (2015).
- Bookstaver et al. (2015) M. Bookstaver, A. Bose, and A. Tripathi, Langmuir 31, 5875 (2015).
- Abbasi et al. (2018) A. Abbasi, G. D. Bothun, and A. Bose, Langmuir 34, 5352 (2018).
- Omarova et al. (2019) M. Omarova, L. T. Swientoniewski, I. K. Mkam Tsengam, D. A. Blake, V. John, A. McCormick, G. D. Bothun, S. R. Raghavan, and A. Bose, ACS Sustainable Chemistry & Engineering 7, 14490 (2019).
- Lee et al. (2013) K. Lee, T. Nedwed, R. C. Prince, and D. Palandro, Marine Pollution Bulletin 73, 314 (2013).
- White et al. (2019) A. R. White, M. Jalali, and J. Sheng, Scientific Reports 9, 1 (2019).
- Fernandez et al. (2022) V. I. Fernandez, R. Stocker, and G. Juarez, Scientific Reports 12, 1 (2022).
- Hickl and Juarez (2022) V. Hickl and G. Juarez, Marine Pollution Bulletin 178 (2022).
- Daling et al. (2014) P. S. Daling, F. Leirvik, I. K. Almås, P. J. Brandvik, B. H. Hansen, A. Lewis, and M. Reed, Marine Pollution Bulletin 87, 300 (2014).
- Rühs et al. (2014) P. Rühs, L. Böcker, R. Inglis, and P. Fischer, Colloids and Surfaces B: Biointerfaces 117 (2014).
- Datta et al. (2010) S. S. Datta, H. C. Shum, and D. A. Weitz, Langmuir 26, 18612 (2010).
- Poulichet and Garbin (2015) V. Poulichet and V. Garbin, Langmuir 31, 12035 (2015).
- Xu et al. (2005) H. Xu, S. Melle, K. Golemanov, and G. Fuller, Langmuir 21, 10016 (2005).
- You et al. (2018) Z. You, D. J. Pearce, A. Sengupta, and L. Giomi, Physical Review X 8 (2018).
- You et al. (2021) Z. You, D. J. Pearce, and L. Giomi, Science Advances 7 (2021).
- Mar (2020) Nature Physics 2020 17:2 17, 251 (2020).
- Li (2015) Z. Li, Technical Reports for Deepwater Horizon Water Column Injury Assessment: Oil Particle Data from the Deepwater Horizon Oil Spill, Tech. Rep. (2015).
- Camilli et al. (2010) R. Camilli, C. M. Reddy, D. R. Yoerger, B. A. Van Mooy, M. V. Jakuba, J. C. Kinsey, C. P. McIntyre, S. P. Sylva, and J. V. Maloney, Science 330, 201 (2010).
- North et al. (2015) E. W. North, E. E. Adams, A. E. Thessen, Z. Schlag, R. He, S. A. Socolofsky, S. M. Masutani, and S. D. Peckham, Environmental Research Letters 10 (2015).
- Paris et al. (2012) C. B. Paris, M. L. Hénaff, Z. M. Aman, A. Subramaniam, J. Helgers, D. P. Wang, V. H. Kourafalou, and A. Srinivasan, Environmental Science and Technology 46, 13293 (2012).
- Lindo-Atichati et al. (2016) D. Lindo-Atichati, C. B. Paris, M. Le Hénaff, M. Schedler, A. G. Valladares Juárez, and R. Müller, Deep-Sea Research Part II: Topical Studies in Oceanography 129, 301 (2016).
- White et al. (2020) A. R. White, M. Jalali, and J. Sheng, Frontiers in Marine Science 7, 1 (2020).
- Bar-Ziv et al. (1999) R. Bar-Ziv, T. Tlusty, E. Moses, S. A. Safran, and A. Bershadsky, Proceedings of the National Academy of Sciences of the United States of America 96, 10140 (1999).
- Nelson et al. (1995) P. Nelson, T. Powers, and U. Seifert, Physical Review Letters 74, 3384 (1995).
- Alstrøm et al. (1999) P. Alstrøm, V. M. Eguíluz, M. Colding-Jørgensen, F. Gustafsson, and N. H. Holstein-Rathlou, Physical Review Letters 82, 1995 (1999).