A Chemical Map of the Outbursting V883 Ori system: Vertical and Radial Structures
Abstract
We present the first results of a pilot program to conduct an Atacama Large Millimeter/sub-millimeterArray (ALMA) Band 6 (211 – 275 GHz) spectral line study of young stellar objects (YSO) that are undergoing rapid accretion episodes, i.e. FU Ori objects (FUors). Here, we report on molecular emission line observations of the FUor system, V883 Ori. In order to image the FUor object with a full coverage from 0.5 to the map size of 30, i.e. from disc to outflow scales, we combine the ALMA main array (the 12-m array) with the Atacama Compact Array (7-m array) and the total power (TP) array. We detect HCN, HCO+, CH3OH, SO, DCN, and H2CO emission with most of these lines displaying complex kinematics. From PV diagrams, the detected molecules HCN, HCO+, CH3OH, DCN, SO, and H2CO probe a Keplerian rotating disc in a direction perpendicular to the large-scale outflow detected previously with the 12CO and 13CO lines. Additionally, HCN and HCO+ reveal kinematic signatures of infall motion. The north outflow is seen in HCO+, H2CO, and SO emission. Interestingly, HCO+ emission reveals a pronounced inner depression or “hole” with a size comparable to the radial extension estimated for the CH3OH and 230 GHz continuum. The inner depression in the integrated HCO+ intensity distribution of V883 Ori is most likely the result of optical depth effects, wherein the optically thick nature of the HCO+ and continuum emission towards the innermost parts of V883 Ori can result in a continuum subtraction artifact in the final HCO+ flux level.
keywords:
ISM: jets and outflows, ISM: molecules, accretion, accretion discs, ISM: dust, extinction, techniques: interferometric.1 Introduction
The chemistry governing planet formation is set early during the formation and evolution of discs surrounding young stellar objects (YSOs). Highly energetic events, such as outflows and outbursts, beginning at the earliest stellar formation phases likely impact and mold the final outcome of disc evolution, ultimately determining the architectures of exoplanet systems (Hubbard, 2017; Tychoniec et al., 2020). It is believed that outflows and their effects on discs and planet building are intimately connected to the accretion process (Frank et al., 2014, and refs. therein) which, in turn, is punctuated by occasional sharp increases in accretion rate (Audard et al., 2014, and refs. therein). Thus, it is not surprising that YSOs that are undergoing rapid accretion episodes, such as FU Orionis star-disc systems (FUors), also show high levels of outflow activity (Hartmann & Kenyon, 1996; Ruíz-Rodríguez et al., 2017a, b).
These classical FUors are known to present accretion rates between 10-6 and 10-4 yr-1, reaching bolometric luminosities of 100-400 , during every outburst episode, usually a few years or decades of duration (e.g. Audard et al., 2014). In effect, this very brief, but powerful, interaction between the central source and its surroundings alters the physical structure and chemical abundances of the young disc itself (e.g. Cieza et al., 2016; Van ’t Hoff et al., 2018; Lee et al., 2019; Leemker et al., 2021). For example, Cieza et al. (2016) used 1.3 mm continuum observations to claim the first-time detection of a water snow-line in a circumstellar disc via Atacama Large Millimeter/sub-millimeter Array (ALMA) observations of an FUor object, V883 Ori, with the enlarged radius of the snow-line ( 40 au) being a direct result of the heating of the disc during the outburst. Similarly, it has been suggested that the presence of different molecules (e.g. HCO+, CH3OH) in the gas phase as a function of radius can be useful in the location of the snow-line, which in turn are likely being affected by the ongoing outburst episode (Van ’t Hoff et al., 2018; Lee et al., 2019; Leemker et al., 2021).
Since only a handful of FUors have been identified, meaning that most YSOs are currently in a low luminosity phase, it is difficult to estimate a time scale since the last outburst occurred and/or predict an oncoming outburst for any given system (Molyarova et al., 2018; Principe et al., 2018). Without a clear estimate of an evolutionary time scale and periodicity of these outbursting phenomena, the impact of the FUor-outburst on the disc and envelope chemical structure remains unknown, preventing us to set the initial conditions for planet formation. Fortunately, besides shaping the disc physical structure (e.g. Cieza et al., 2016), outbursts must leave footprints on the disc and envelope chemical composition (Rab et al., 2017). The intricate connection between high energy emission generated during massive outbursts (e.g. X-rays, UV radiation) and the properties of burst events (e.g. their duration, repetition time, and peak flux) results in an enhanced molecular ionization, which leads to rich chemistry that can be probed by different tracers. For instance, Jørgensen et al. (2013) observed the low-mass proto-star IRAS 15398-3359 on 0.5 (75 au diameter) scales with ALMA at 340 GHz and detected a ring-like structure with a radius of about 1-1.5 (150-200 au) from H13CO+ emission. These authors proposed that inner-disc water vapor, produced by an accretion burst within the last 100-1000 yr, may have destroyed any present HCO+. Also, Cleeves et al. (2017) reported variation in the optically thin H13CO+ emission in the IM Lup disc, which can potentially be explained via X-ray driven chemistry enhancing the HCO+ abundance in the upper layers of the disc atmosphere during large or prolonged flaring events. Thus, ongoing and past outbursts likely play a significant role in the chemical and physical evolution of YSOs, whose impact can be detected from different molecular tracers at different vertical layers and radial scales (e.g. Ruíz-Rodríguez et al., 2020). Nevertheless, the impact of high-energy-induced molecular ionization and the potential importance of energetic outbursts during FUor and FUor-like events at the earliest evolutionary stages remains unexplored.
In this paper, we report on ALMA Band-6 observations of V883 Ori, searching for chemical signatures observed in density tracers (HCN, HCO+, DCN), and shock tracers (CH3OH, SiO, SO), which can be used to identify and distinguish regions of shock-excited gas, and thermal desorption of these species by high-energy (UV and X-ray) radiation. V883 Ori is a 1.3 object located in the Orion molecular cloud at a distance of 417 pc (Menten et al., 2007). Initially, this object was found to have a detectable water snow-line at a radius of 45 au from the central source, considering a sublimation temperature of water of 100 K at the mid-plane (Cieza et al., 2016). However, more recent HCO+ and CH3OH observations have suggested that the snowline may be much further out (Van ’t Hoff et al., 2018; Leemker et al., 2021) if the location of the snow line is taken as the radius where half of the water is in gas-phase and the other half is frozen out onto the grains. To date, several molecular species have been detected in V883 Ori with impressive morphological structures, however, these studies are focused only on the disc structures (e.g. Van ’t Hoff et al., 2018; Lee et al., 2019), independent of cavities and outflows traced by 12CO and 13CO emission lines (Ruíz-Rodríguez et al., 2017b). Characterizing these systems in their entirety offers valuable insights of density and thermal structures related to other sources of energy such as X-rays and UV radiation.
Here, we present the emission detections of HCN, HCO+, SO, DCN, and H2CO in the V883 Ori environment, together with other well-utilized molecular tracers (12CO, 13CO, CH3OH, H13CO+) already presented in previous studies (e.g. Ruíz-Rodríguez et al., 2017b; Lee et al., 2019). These emission lines are collectively used as a probe of the circumstellar disc and outflows as well as their “transition" layers. Thus, these chemical tracers offer a unique view of the vertical and radial structure of the disc-outflow system at the scale of 100 - 2000 au, whose significance in understanding the chemical properties in FUor objects is relevant to the final outcome, i.e. planetary systems. The aim of this work is to investigate whether or not chemistry alone can explain the radial emission profiles of these molecules, or if other high-energy radiation sources are required to produce the observed emission features.
2 ALMA Observations and Data Analysis
| Array | Observation | Bandpass | Flux | Phase | Time On | Median PWV |
| Date | Calibrator | Calibrator | Calibrator | Source [mm:ss] | [mm] | |
| ALMA Cycle 5 | Project ID: | 2017.1.00015.S | PI: J. Williams | |||
| 12-m 44 | 21-Jan-2018 | J0607-0834 | J0607-0834 | J0541-0541 | 17:21 | 0.98 |
| 12-m 43 | 12-Jul-2018 | J0542-0913 | J0522-3627 | J0542-0913 | 08:48 | 2.25 |
| 7-m 11 | 31-Oct-2017 | J0522-3627 | J0607-0834 | J0607-0834 | 34:45 | 1.43 |
| 7-m 11 | 01-Nov-2017 | J0522-3627 | J0607-0834 | J0607-0834 | 34:11 | 0.58 |
| TP | 03-May-2018 | J0542-0913 | J0542-0913 | J0542-0913 | 38:01 | 0.63 |
| TP | 04-May-2018 | J0542-0913 | J0542-0913 | J0542-0913 | 38:01 | 0.71 |
| TP | 06-May-2018 | J0542-0913 | J0542-0913 | J0542-0913 | 38:01 | 1.40 |
| TP | 15-May-2018 | J0607-0834 | J0607-0834 | J0607-0834 | 38:01 | 0.89 |
| ALMA Cycle 6 | Project ID: | 2018.1.01131.S | PI: D. Ruiz-Rodriguez | |||
| 12-m 41 | 28-Apr-2019 | J0423-0120 | J0532-0307 | J0529-0519 | 05:03 | 1.0 |
| 7-m 11 | 06-Mar-2019 | J0423-0120 | J0423-0120 | J0501-0159 | 05:02 | 2.7 |
| TP | 28-Apr-2019 | J0607-0834 | J0607-0834 | J0607-0834 | 39:25 | 0.95 |
| TP | 02-May-2019 | J0607-0834 | J0607-0834 | J0607-0834 | 39:25 | 1.1 |
2.1 ALMA Observations
| Cycle | Line | Rest Freq. | 12-m | 7-m | TP | |||
| Bandwidth | Channel | Bandwidth | Channel | Bandwidth | Channel | |||
| [GHz] | [MHz] | [] | [MHz] | [] | [MHz] | [] | ||
| Cycle 5 | SiO v=0 5-4 | 217.105 | 58.5 | 480 | 62.5 | 512 | 62.5 | 512 |
| DCN v=0 J=3-2 | 217.238 | 58.5 | 480 | 62.5 | 512 | 62.5 | 512 | |
| H2CO 3(2,1)-2(2,0) | 218.760 | 58.5 | 480 | 62.5 | 512 | 62.5 | 512 | |
| C18O v=0 2-1a | 219.560 | 58.5 | 960 | 62.5 | 1024 | 62.5 | 1024 | |
| SO 3 v=0 6(5)-5(4) | 219.949 | 58.5 | 960 | 62.5 | 1024 | 62.5 | 1024 | |
| 13CO v=0 2-1a | 220.398 | 58.5 | 960 | 62.5 | 1024 | 62.5 | 1024 | |
| 12CO v=0 2-1a | 230.55 | 117.2 | 960 | 62.5 | 1024 | 125 | 1024 | |
| 13CS v=0 5-4 | 231.221 | 117.2 | 960 | 125 | 1024 | 125 | 1024 | |
| Cycle 6 | CH3OH v t=0 4(3,1)-4(2,2) | 251.867 | 187.5 | 480 | 2000 | 512 | 2000 | 512 |
| HCN v=0 J=3-2 | 265.886 | 937.5 | 1920 | 1000 | 2048 | 1000 | 2048 | |
| HCO+ v=0 3-2 | 267.558 | 937.5 | 1920 | 1000 | 2048 | 1000 | 2048 | |
a CO isotopologues will be presented in Ruiz-Rodriguez et al. In prep.
We obtained ALMA Cycle 5 and Cycle 6 Band 6 observations toward V883 Ori with a center position of (J2000) = 18h 14m 10.47s ; (J2000) = -32o4734.50. In order to image the FUor object with a full coverage from 0.5 to the map size of 30, we combine the ALMA main array (12-m array) with the Atacama Compact Array (7 m array) and the total power (TP) array (12-m diameter, single-dish). By combining the 12-m, 7-m, and TP data, the observations are sensitive to emission, from disc to outflow scales. Table 1 summarizes the observational logs for this project.
In Cycle 5, V883 Ori was observed (project ID: 2017.1.00015.S PI: J. Williams) using the compact (baselines 55 to 91 m) and the extended configurations, C43-2 (15 - 315 m) and C43-5 (15 - 1400 m), on 2017 October 31, 2018 Jan 21, and July 12, respectively (Table 1). The FoV of 30 30 was covered by a mosaic of 27 pointing (12-m array). The shorter uv distance range was fulfilled by observations using a 7 pointing mosaic (7-m array) with a maximum resolvable size of 30, and the TP observations covered the diffuse emission over the entire mapped region. The spectral windows targeted 12CO(J = 2-1), 13CO(J = 2-1), C18O (J = 2-1), SO (J = 6(5)-5(4)), DCN (J = 3-2), SiO (J= 5-4), 13CS (J = 5-4) and continuum, at rest frame frequencies of 230.588, 220.398, 219.560, 219.949, 217.238, 217.104, 231.220, and 232.50 GHz, respectively (Table 2). The correlator for these spectral windows were set to have bandwidths between 58.5 MHz and 2000 MHz. More details can be found in table 2.
In cycle 6, the 12-m array observations were obtained on 2019 April 28, the 7-m observations on 2019 March 06, and the TP observations on 2019 April 28 and May 02 (see Table 1), and as part of the program 2018.1.01131.S (PI: D. Ruiz-Rodriguez). The array configuration was C43-4 with the shortest and longest baselines of 15 m and 784 m, respectively. The correlator was set up with three spectral windows in dual polarization mode, centered at 265.886 GHz (HCN J = 3-2 line), 267.557 GHz (HCO+ J = 3-2 line), and 251.866 GHz (CH3OH). The bandwidths used in the spectral windows are summarized in Table 2 for each configuration.
| Line | Rest Freq. | Peak Flux | Integrateda | Beam | P.A. | rms | |
|---|---|---|---|---|---|---|---|
| [GHz] | [Jy beam-1 km s-1] | [Jy km s-1] | [" "] | [deg.] | [ 10-2 Jy/beam] | ||
| ALMA Cycle 5 | |||||||
| SiO v=0 5-4 | 217.105 | Not detected | – | 1.5 1.1 | -77.0 | 1.5 | |
| DCN v=0 J=3-2 | 217.238 | 0.80 0.02 | 1.12 0.04 | 1.5 1.1 | -77.0 | 2.4 | |
| H2CO 3(2,1)-2(2,0) | 218.760 | 0.95 0.02 | 1.20 0.04 | 1.5 1.1 | -77.1 | 5.5 | |
| SO 3 v=0 6(5)-5(4) | 219.949 | 0.80 0.04 | 1.10 0.10 | 1.5 1.1 | -77.8 | 1.6 | |
| 13CS v=0 5-4 | 231.221 | Not detected | – | 1.5 1.1 | -77.3 | 2.6 | |
| ALMA Cycle 6 | |||||||
| CH3OH v t=0 4(3,1)-4(2,2) | 251.867 | 0.47 0.01 | 0.71 0.02 | 0.5 0.4 | -83.1 | 4.5 | |
| HCN v=0 J=3-2 | 265.886 | 0.97 0.03 | 4.60 0.16 | 0.5 0.4 | -84.1 | 1.1 | |
| HCO+ v=0 3-2 | 267.558 | 0.31 0.03 | 6.50 0.50 | 0.5 0.4 | -86.2 | 7.0 |
a The uncertainty includes a 10 systematic flux calibration error.


2.2 Data Analysis
Data were calibrated using the standard calibration script in the CASA software package (Version 4.7.2- Cycle 5, and 5.4.0 - Cycle 6). In order to concatenate all data sets, we initially converted the TP map into visibilities by using the Total Power to Visibilities (TP2VIS) package that runs on the CASA platform (Koda et al., 2019, and references therein). We adopt the root-mean-square (rms) noise in the TP map111A more detailed description of the reduction process can be found in Appendix A. as the optimal weight of the TP visibilities222https://github.com/tp2vis/distribute. For line imaging, we initially subtracted the continuum emission by fitting a first-order polynomial to the continuum in the uv-plane. After subtracting continuum emission determined at the emission-free channels, we then combined the 12-m, 7-m, and TP data in u-v space using the CASA task concat and deconvolved them jointly. We determined weights of the visibility data using the task statwt. Unfortunately, the sensitivity of the extended configuration C43-5 from Cycle 5 observations is not optimal for the combination. We attempted to combine the 12-m, 7-m, and TP data by concatenating the visibility data together using different weights, however, the resulting rms becomes higher when including the C43-5 array. We opted to not include these observations in the final products. Nevertheless, for completeness, we list in Table 1 the cycle 5 C43-5 array observations.
After concatenating the visibility data, the reduction process was done using the TCLEAN task with a multi-scaled deconvolver of 0, 20, 60 for cycle 5 and scales of 0, 6, and 20 for Cycle 6, which applies an iterative procedure with a decreasing threshold parameter to automatically mask regions during the cleaning process (e.g. Kepley et al., 2020). To achieve a good balance between sensitivity and angular resolution the Briggs weighting parameter R was set to 0.5 for the spectral line image cubes. For Cycle 5 data, the spectral data cubes were constructed on a 512 512 pixel grid with 0.05" pixel size, and with 0.18 km s-1 velocity resolution. For Cycle 6 data, the spectral data cubes were constructed on a 512 512 pixel grid with 0.08" pixel size, and with 0.6 km s-1 velocity resolution. The parameters of the final images for the two sets of observations are shown in Table 3.


3 Results
3.1 Line detections and emission morphologies
| Line | Beamwidth | Radial Extension | ||
|---|---|---|---|---|
| [au] | [au] | [au] | ||
| ALMA cycle 6 | ||||
| CH3OHa | 607 | 560 | 131 10 | |
| HCNa | 831 | 560 | 315 20 | |
| HCO+a | 3238 | 560 | 1610 100 | |
| ALMA cycle 5 | ||||
| DCN | 880 | 558 | 340 15 | |
| H2COb | 846 | 560 | 324 20 | |
| SO | 2570 | 580 | 1250 100 |
a Radial extension estimated from the degraded ALMA images, see Sec. 3.1.
b Radial extension of the bulk H2CO emission at 7.
We detected nine out of eleven of our target emission lines. Table 3 shows a summary of the line detections and non-detections presented in this paper333We will report CO and its isotopologues from Cycle 5 observations in a coming paper (Ruiz-Rodriguez et al. In prep.) with a more detailed kinematic analysis.. Figure 1 displays the velocity-integrated intensity (moment-0) maps for CH3OH, HCN, HCO+, DCN, H2CO, and SO emission. These moment maps are integrated over the velocity range -5.0 to 10 km s-1, -0.2 to 8.8 km s-1, 2.2 to 6.8 km s-1, 2.2 to 6.52 km s-1, 2.2 to 6.52 km s-1, and 2.56 to 6.88 km s-1 for HCN, CH3OH, HCO+, DCN, H2CO, and SO, respectively, using thresholds according to their rms values (see Table 3). The velocities are with respect to the local standard of rest (LSR). From our observations, the integrated CH3OH, HCN, DCN, H2CO, and SO emission are centrally peaked on the V883 Ori position at 0.47 Jy beam-1 km s-1, 0.97 Jy beam-1 km s-1, 1.00 Jy beam-1 km s-1, 1.1 Jy beam-1 km s-1, and 0.80 Jy beam-1 km s-1, respectively. In contrast, the integrated HCO+ emission is off center, revealing a ring-like emission structure that is discussed in Section 4.
The relative spatial distributions of the line emissions close to the central source can be parameterized by extracting azimuthally averaged radial profiles from all observed integrated intensities. These profiles are derived by computing mean values of pixels in radial bins of one-quarter of a Beam size (see Table 3) over the full azimuthal range of 2. The extracted radial intensity profiles are azimuthally averaged after deprojecting for the V883 Ori disk inclination444All position angles are specified north through east. ( 38o and P.A. 120 o, see Cieza et al. (2016) and Ruíz-Rodríguez et al. (2017b), respectively). To bring both data sets to comparable resolutions, we convolved the Cycle 6 data with the Cycle 5 ALMA Clean synthetic beam of size 1.5" 1.1". These data are called the degraded ALMA images. The extracted azimuthally averaged radial profiles are displayed in Fig. 3. For our purposes, we used the full widths at half maximum () of the profiles to derive deconvolved sizes. To that end, we have estimated as the region enclosing 70 of the flux and considering only emission above 3, where is the rms noise as determined from the nearby line-free channels. Thus, the radial extent of the structure dominating the emission can be estimated through deconvolution using the formula:
| (1) |
where the flux within marks the radial extension, and , the mean FWHM of the beam. The uncertainties for the radial flux profiles are estimated as the standard deviation of the pixel values in each bin () at a given radius divided by the square root of the beam area. The resulting radial extensions are listed in Table 4.
As the ring-like structure disappears in the degraded HCO+ emission image owing to the larger beam, we also used the sharp (resolved) break in the intensity profile detected in the original HCO+ emission at 460 au and the inner edge of the HCO+ ring-like structure at 170 au in order to estimate a deconvolved size of these features (see solid green lines in Fig. 3). Based on eq. 1, and with a half of a beam size of 102 au, we assume that , where represents the position of these features in the HCO+ intensity profile. We then estimate that the HCO+ ring emission has an inner radius at 130 au and an outer radius at 450 au.
From these estimates, we note that the observed HCO+ ring structure extends out to 450 au, well beyond the outer radius of dust emission (125 au; Cieza et al., 2016). However, as the channel maps in Appendix 13 show, the HCO+ emission appears more extended to the northern cavity (see Ruíz-Rodríguez et al., 2017b), tracing an outflow that reaches up to 1600 au with a narrow velocity range between 4.0 and 5.5 km s-1 (see Fig. 13). In contrast, HCN is detected mostly close to the central object within a radius of 320 au (see Table 4 and Fig. 14), and at what seems to be a transition layer between the disc and a starting point of the outflows (see Sec. 3.2.2 ). The DCN emission line traces similar regions as the HCN emission (see Fig. 15), rising from within a radius of 330 au (Table 4). Similarly to HCO+, but to a smaller extent and slower, SO emission is detected around the source and traces an outflow with a very narrow velocity range (4-5 km s-1; see Fig. 17), reaching distances of 1200 au. The H2CO emission displays the most complex structure, with distinct core and extended components (Fig. 16; see Sec 3.2); thus, probing material that belongs to the outflow-envelope structure with velocities close to the systemic velocity (i.e. 4.5 km s-1) of 4-5 km s-1 (see Fig. 16) that may trace the inner part of the large envelope, where the rotation starts to dominate, see Fig. 2. However, the bulk of the H2CO emission (7) originates around the central protostar (Fig. 1) where the greatest velocity dispersion is found within a radius of 325 au.
Using the CASA task , we estimated the total integrated fluxes and peak intensities by fitting two-dimensional Gaussians to the moment zero maps. Integrated fluxes of 0.71 Jy km s-1, 4.6 Jy km s-1, 1.12 Jy km s-1 1.20 Jy km s-1, and 1.10 Jy km s-1 were estimated for CH3OH, HCN, DCN, H2CO, and SO within circular regions of radius 0.7", 1.3", 2.1", 2", and 2.8", respectively. For the HCO+ emission ring, we used an annulus region centered at the V883 Ori position with r1 = 0.2" and r2 = 1.5", yielding a total flux of 6.5 Jy km s-1. The derived values are summarized in Table 3.


3.2 Velocity field
Figure 2 presents the intensity-weighted velocity (moment 1) maps for V883 Ori. The integration range for all detected lines are chosen to match the moment-0 maps (see Fig. 1) and display the kinematic structure of these molecular lines. When creating these maps, the data were clipped at 3 in each channel, except for H2CO and SO, where we clipped at 3 and 7 in order to distinguish two distinct regions, as further presented below.
The moment 1 maps of HCN, HCO+, CH3OH, DCN, H2CO, and SO in Fig. 2 all reveal a velocity shift indicative of rotation about the central YSO. That is, each of these molecules displays a pattern of blue-shifted and red-shifted emission to the south-west and north-east, respectively, along P.A. 30o, which is approximately perpendicular to the outflow rotation axis (P.A. 120o), as determined from the CO emission (Cieza et al., 2016; Ruíz-Rodríguez et al., 2017b). On the other hand, after clipping the data at 3, the red- and blue-shifted SO emission reveals outflow material at the north-west and south-east sides of the object tracing the bottom part of the cavities previously detected in CO emission (Ruíz-Rodríguez et al., 2017b), while, when clipped at 7, the SO data show signs of rotation close to the central star. Similarly, the H2CO moment-1 map reveals two distinct regions of the FUor system with a strong velocity gradient on small scales, indicating rotational motion along the southwest to northeast direction of the disc; whereas, at larger distances, the H2CO line also traces material that appears to trace the stellar envelope, given its radial velocities (4.0 and 5.0 km s-1; Fig. 16).
3.2.1 Position - Velocity Diagrams
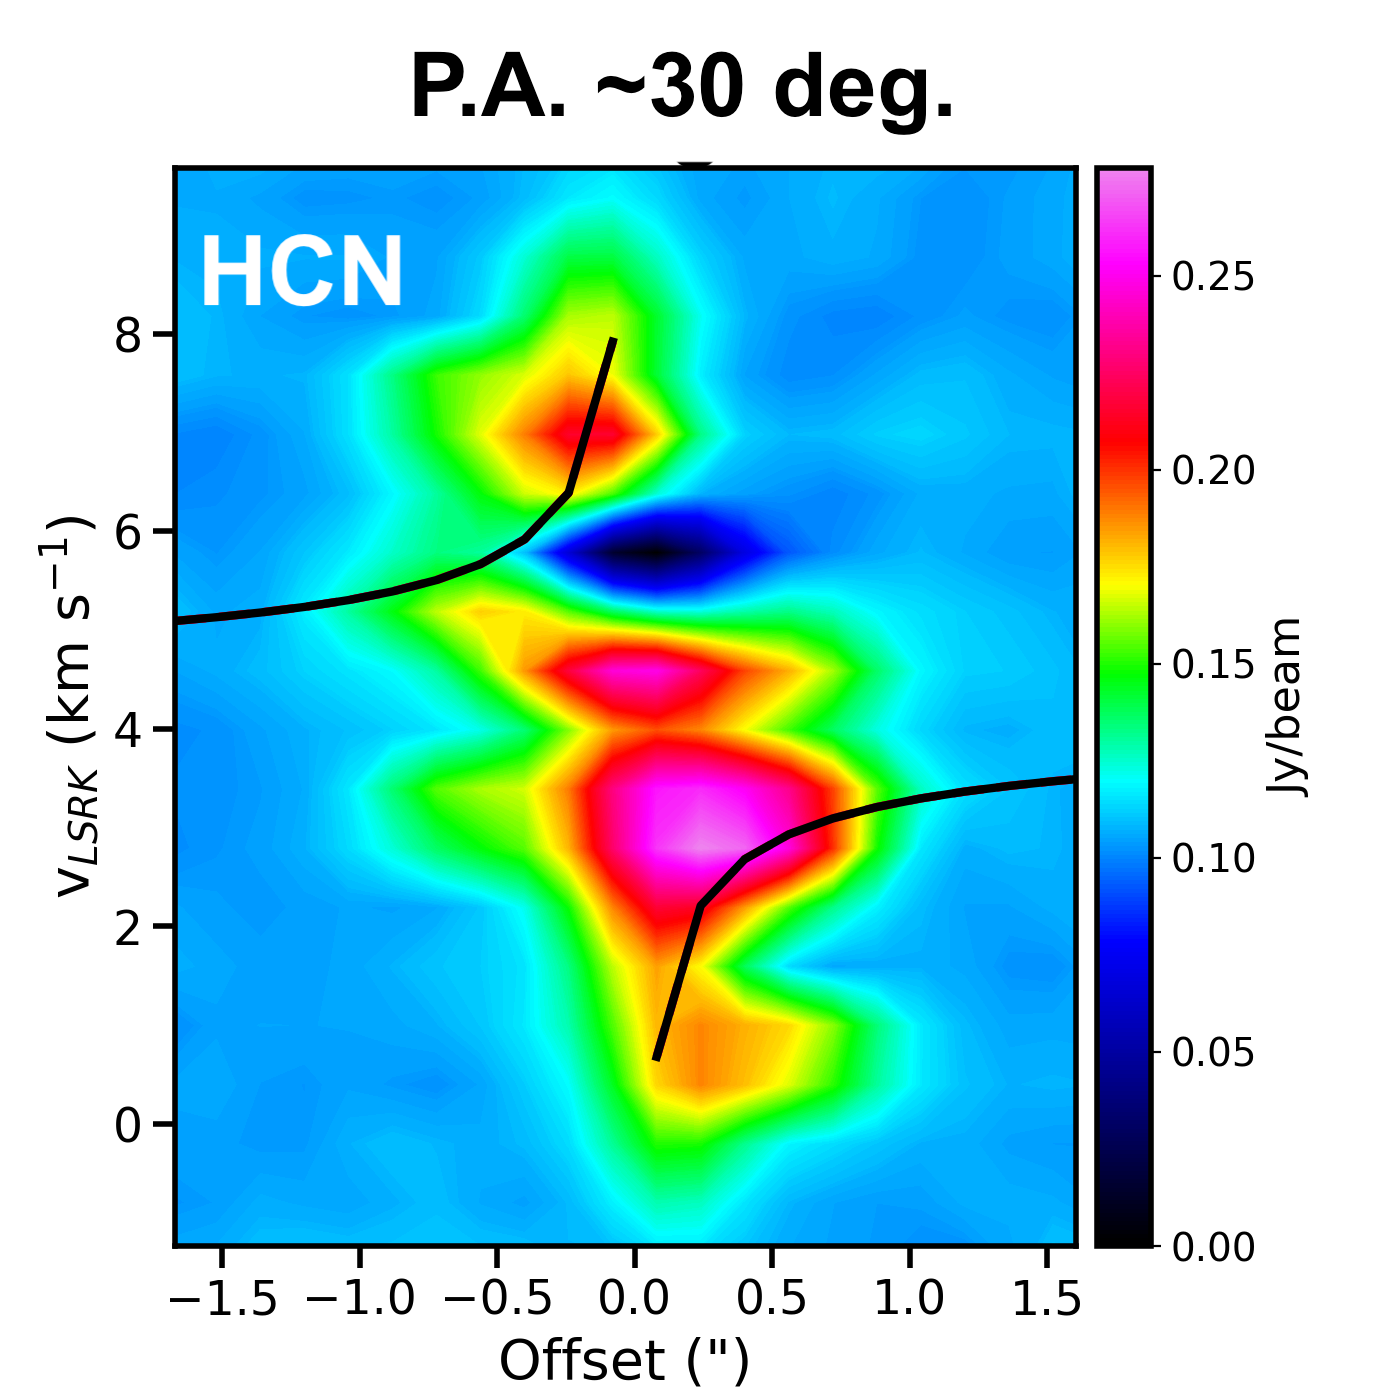
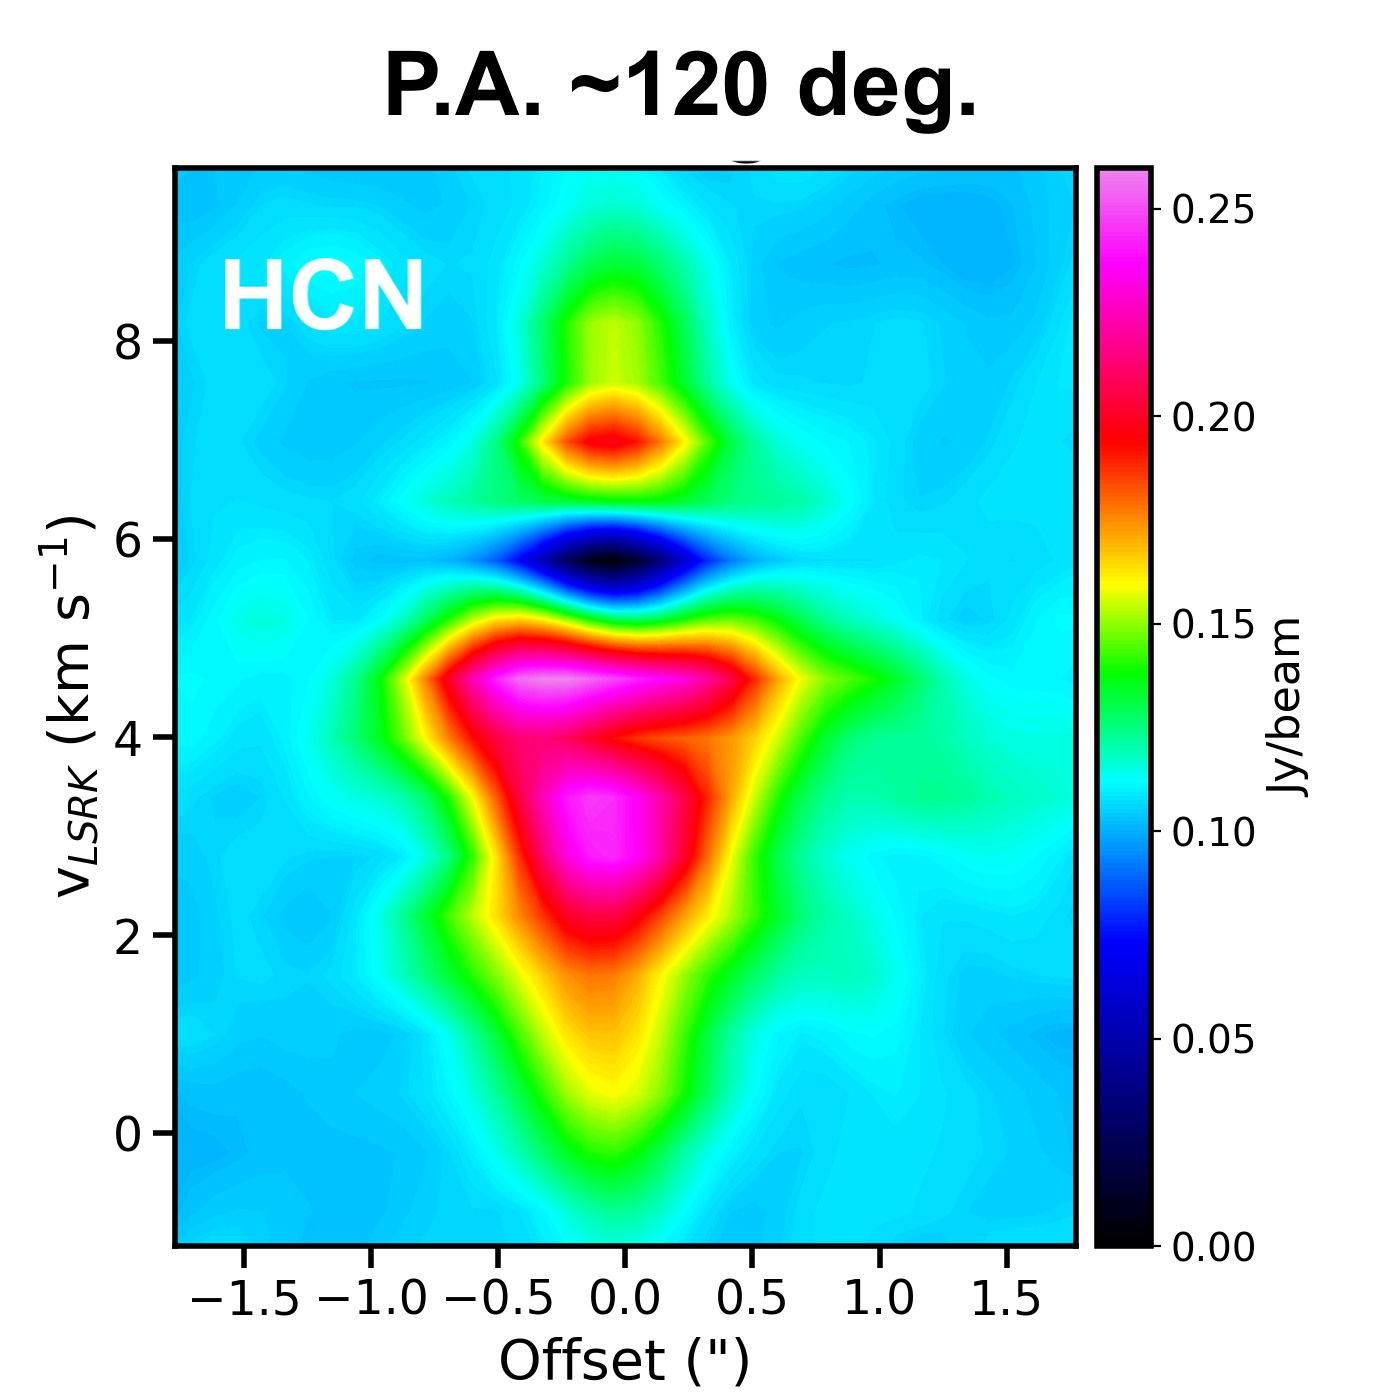
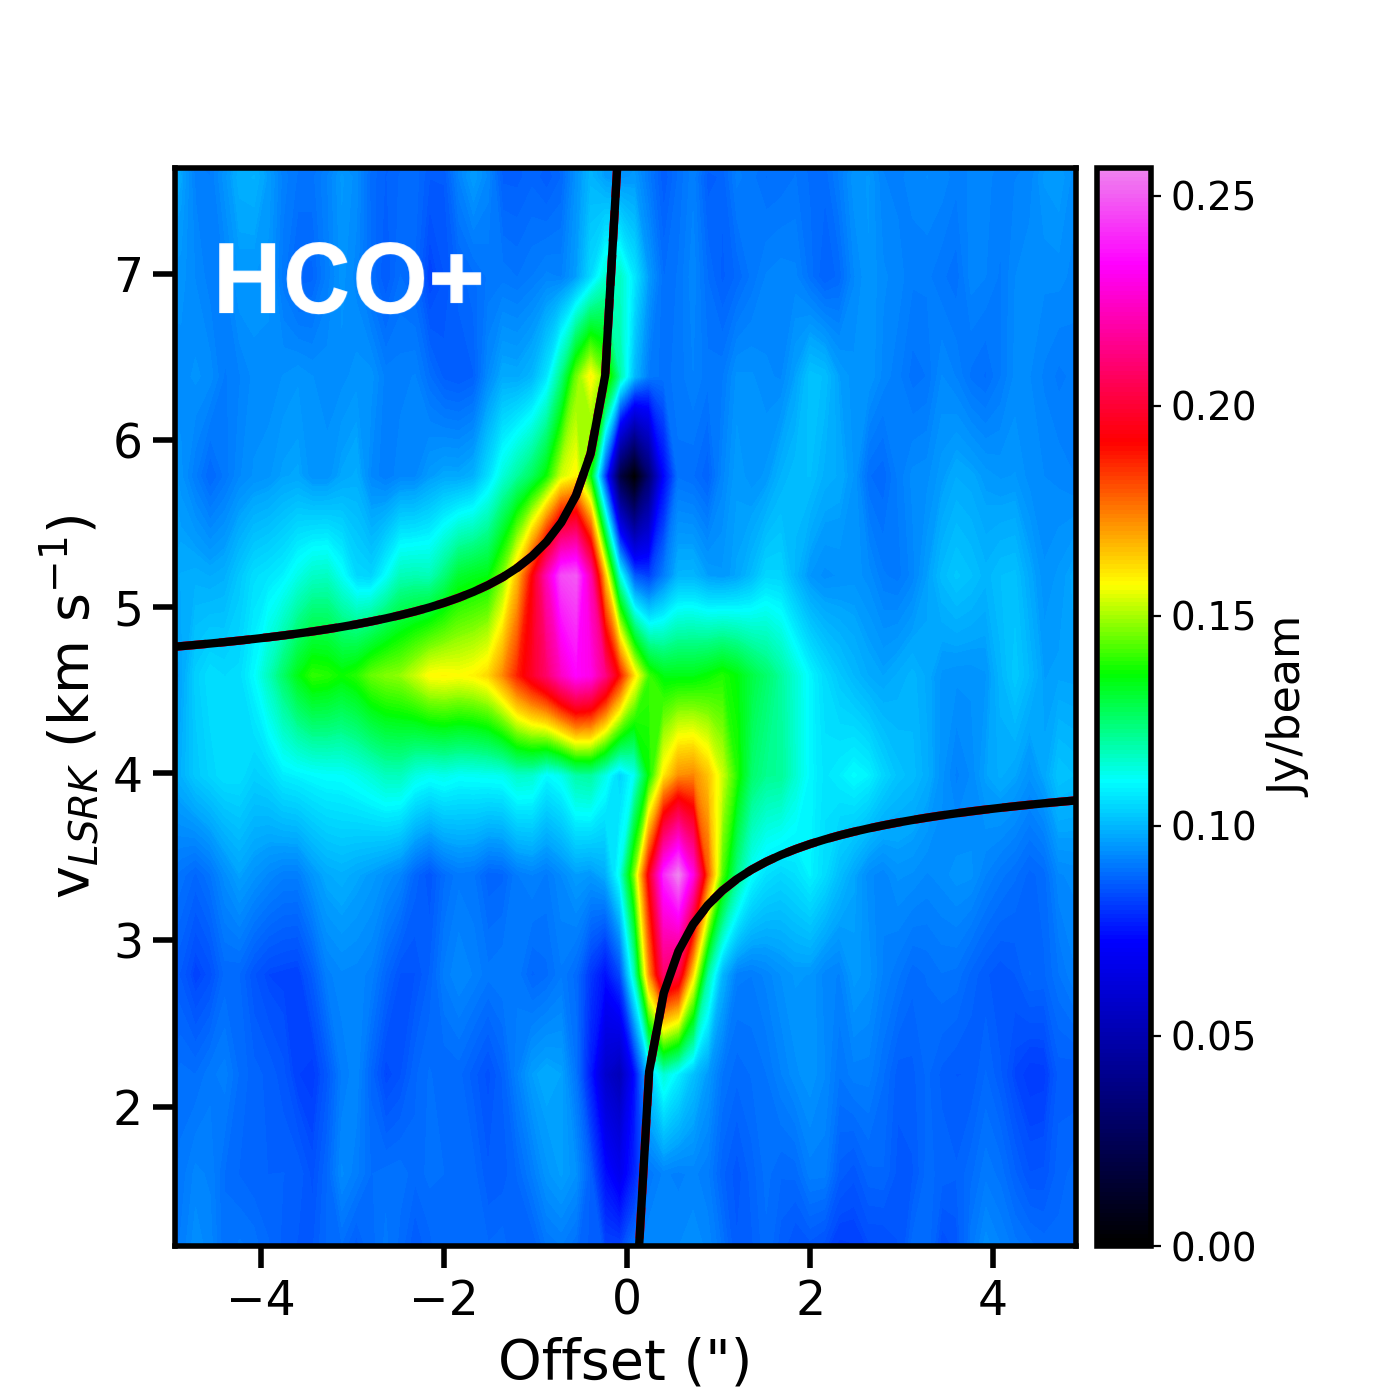
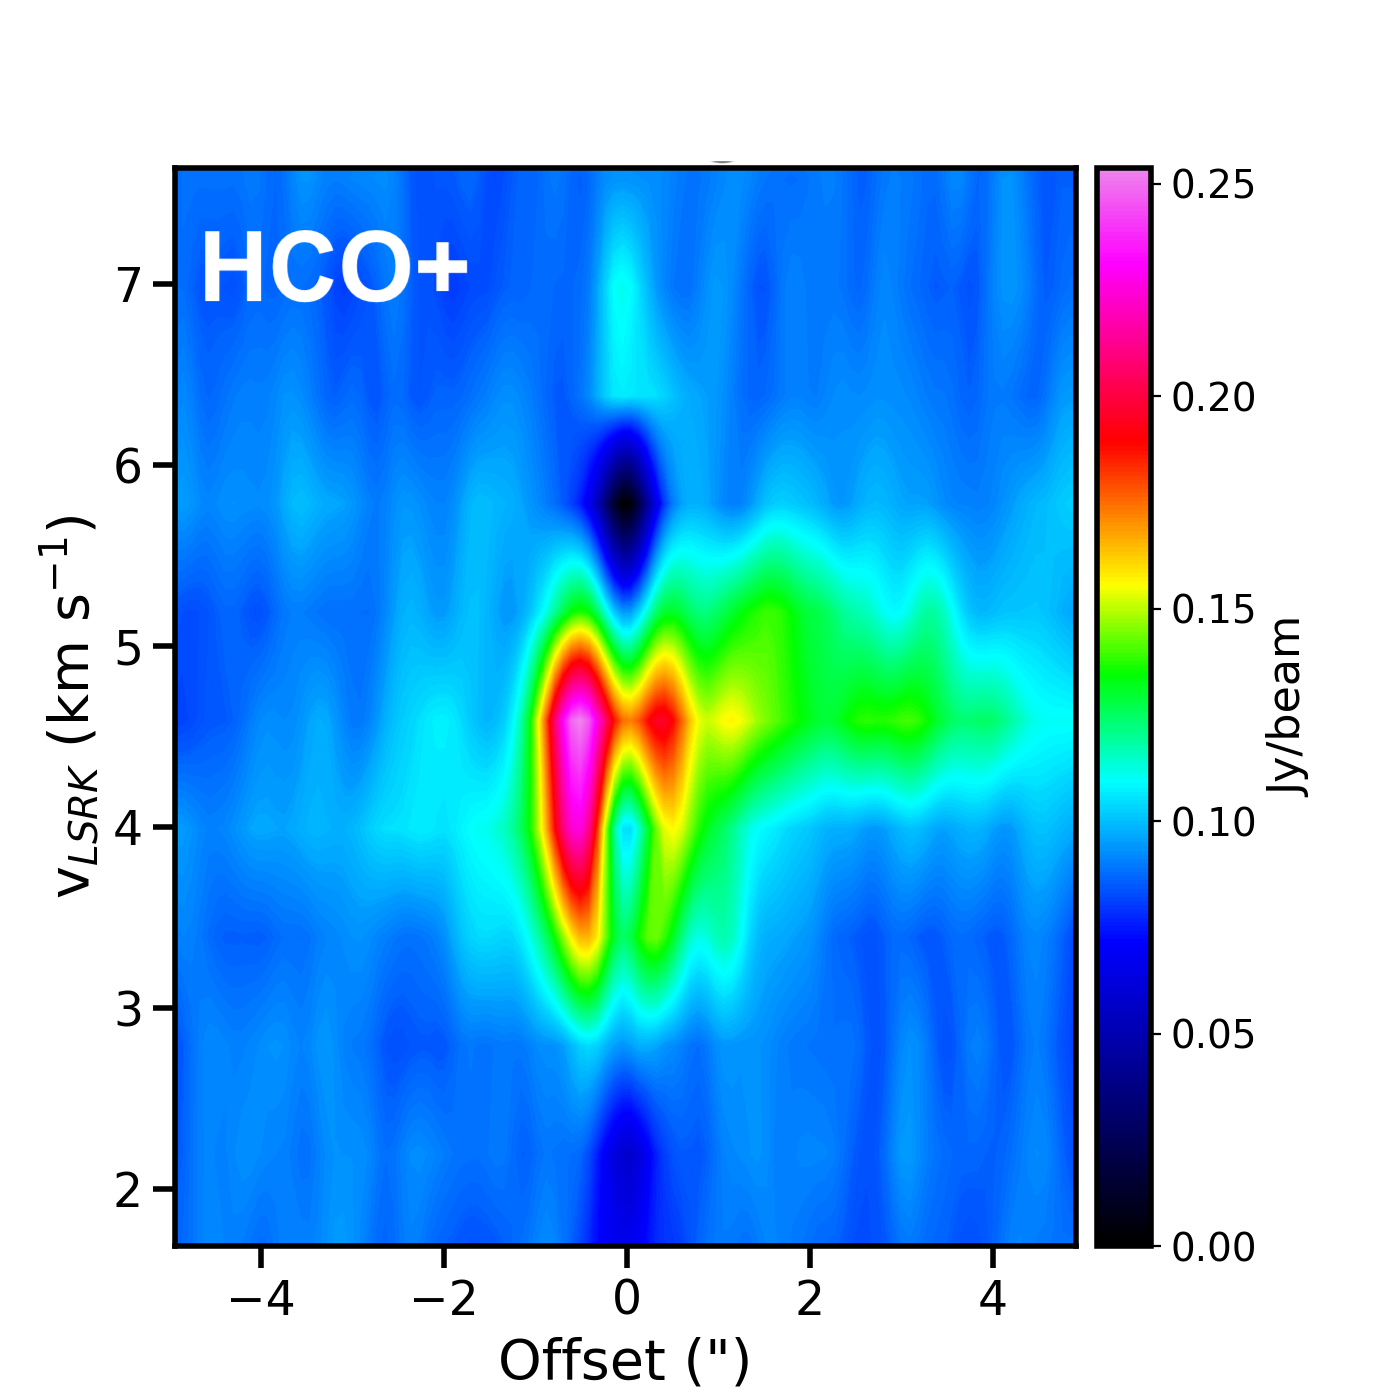
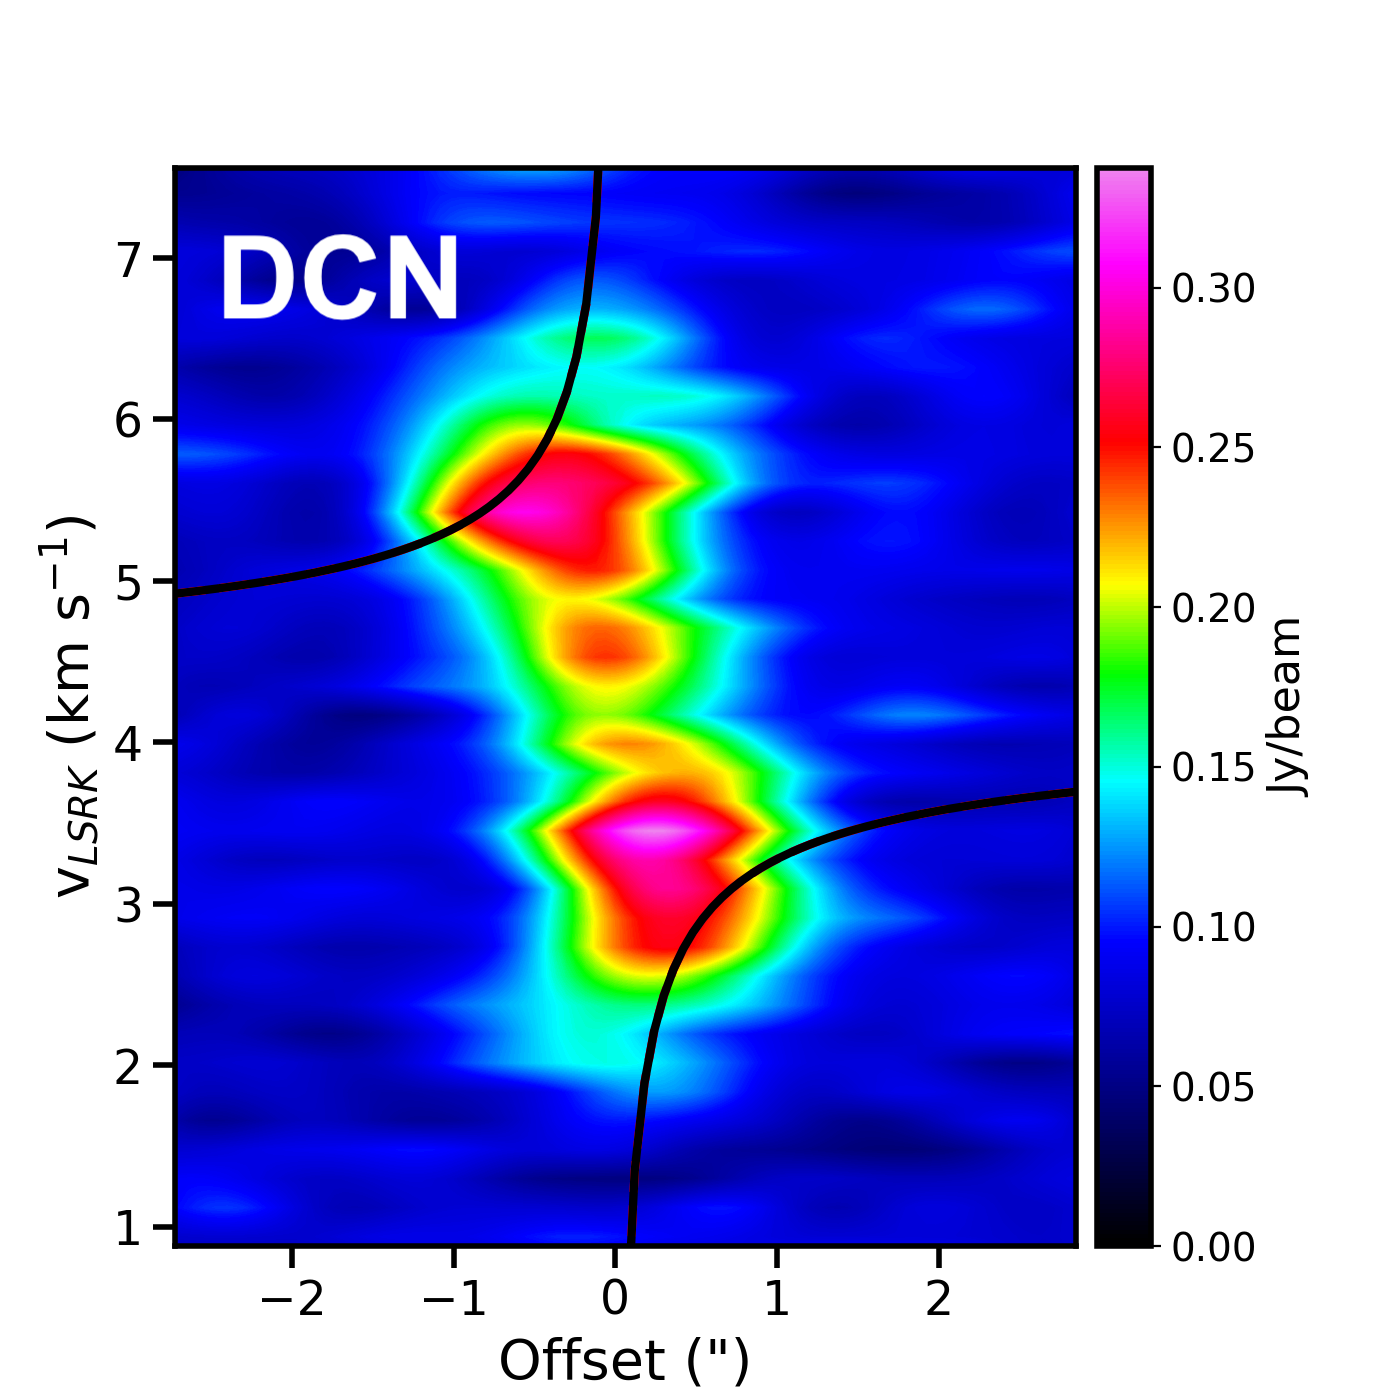
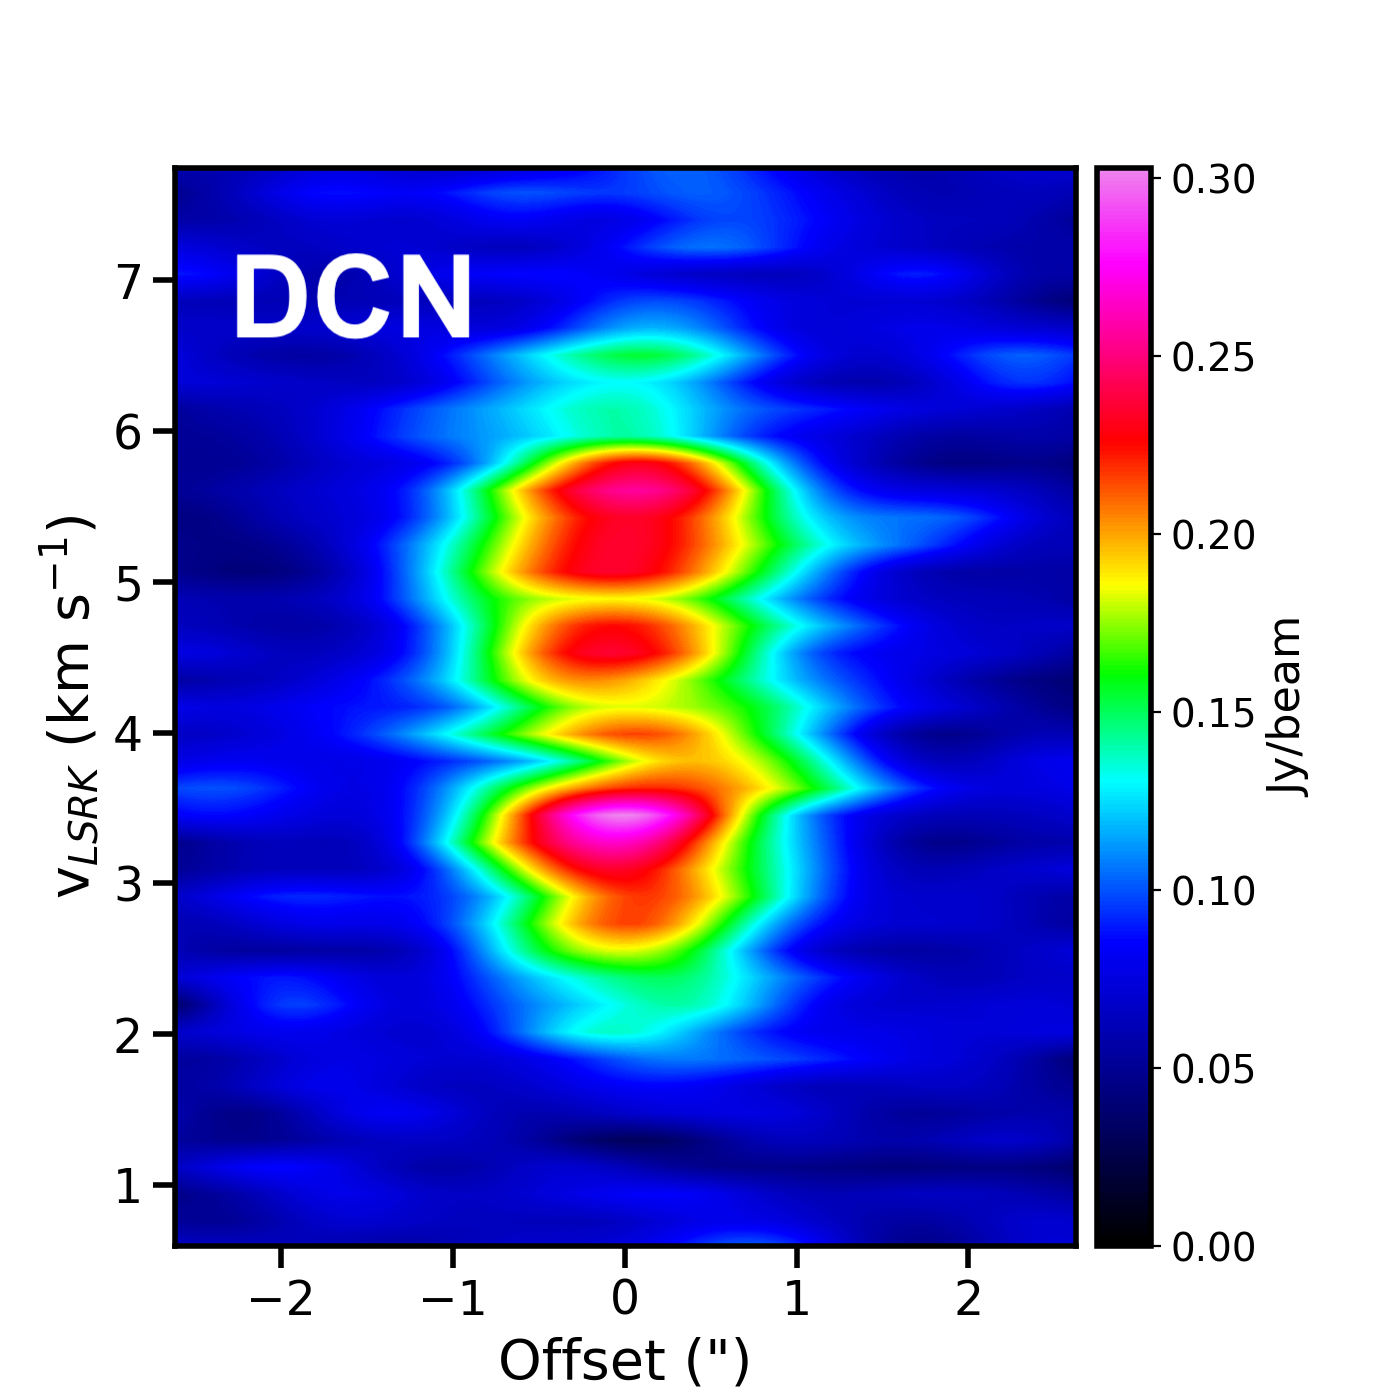
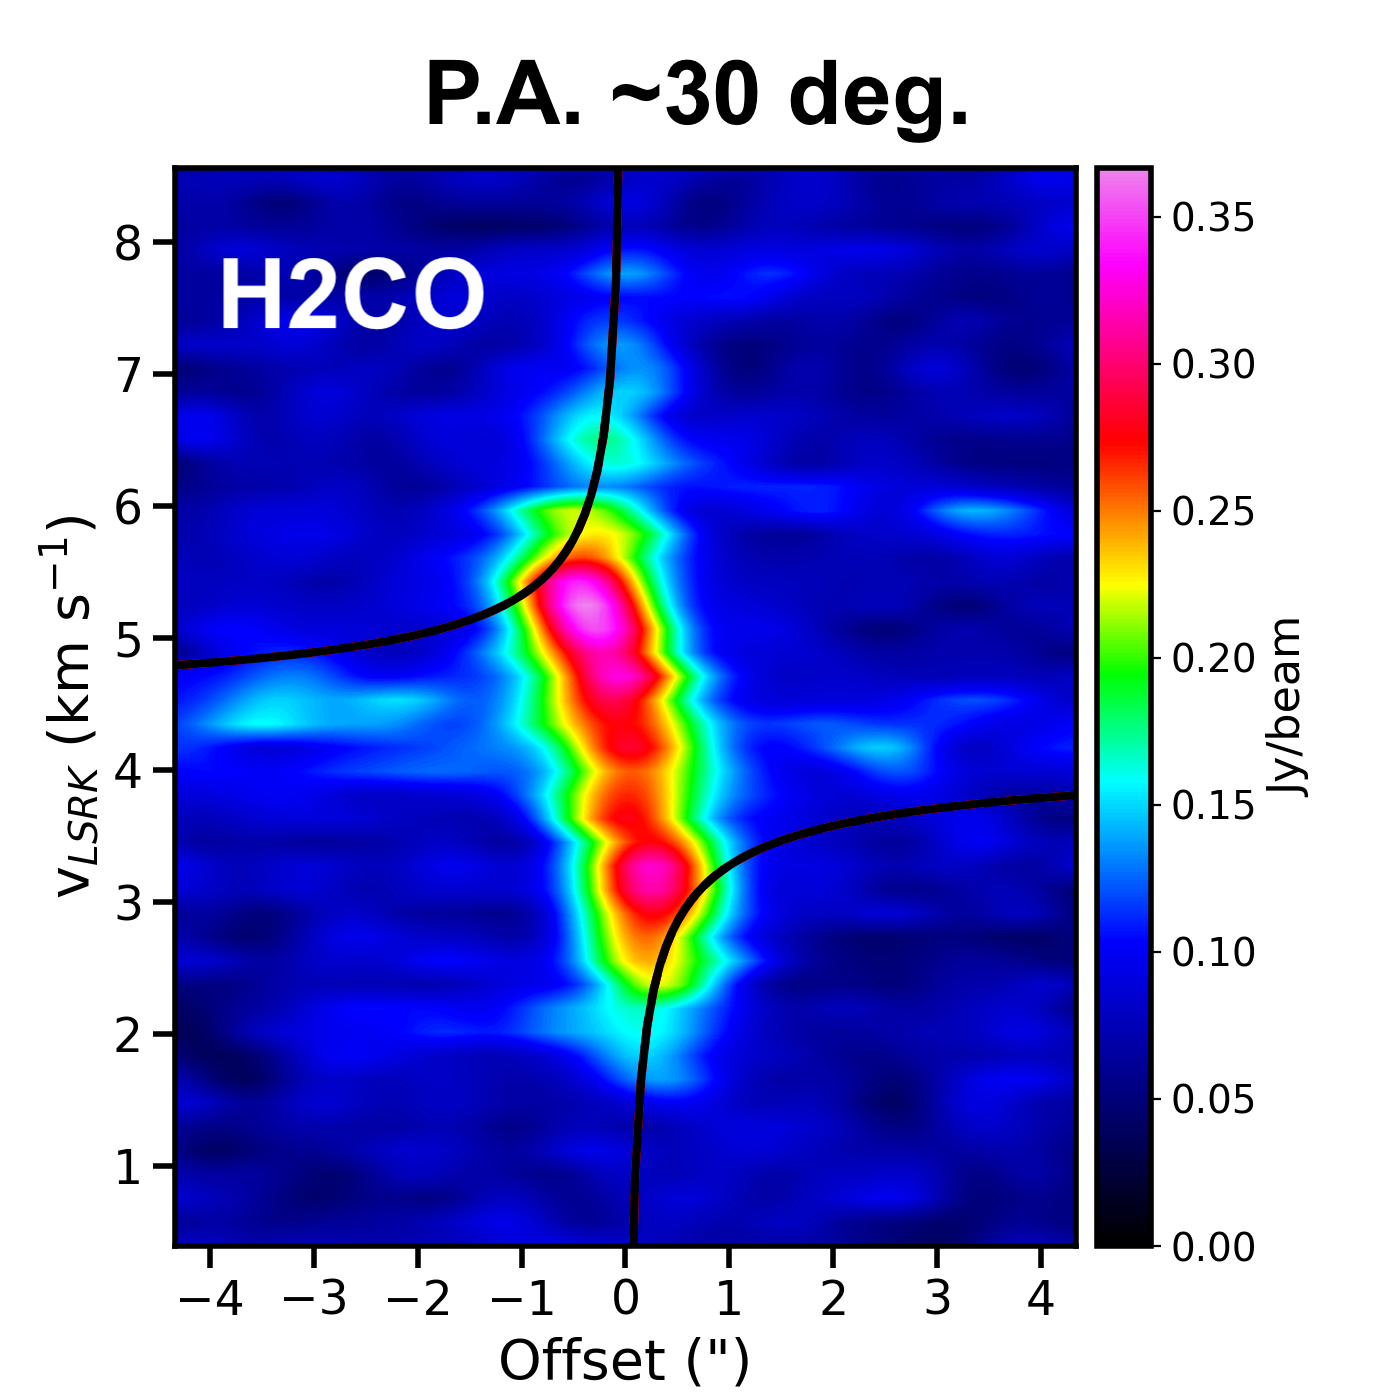
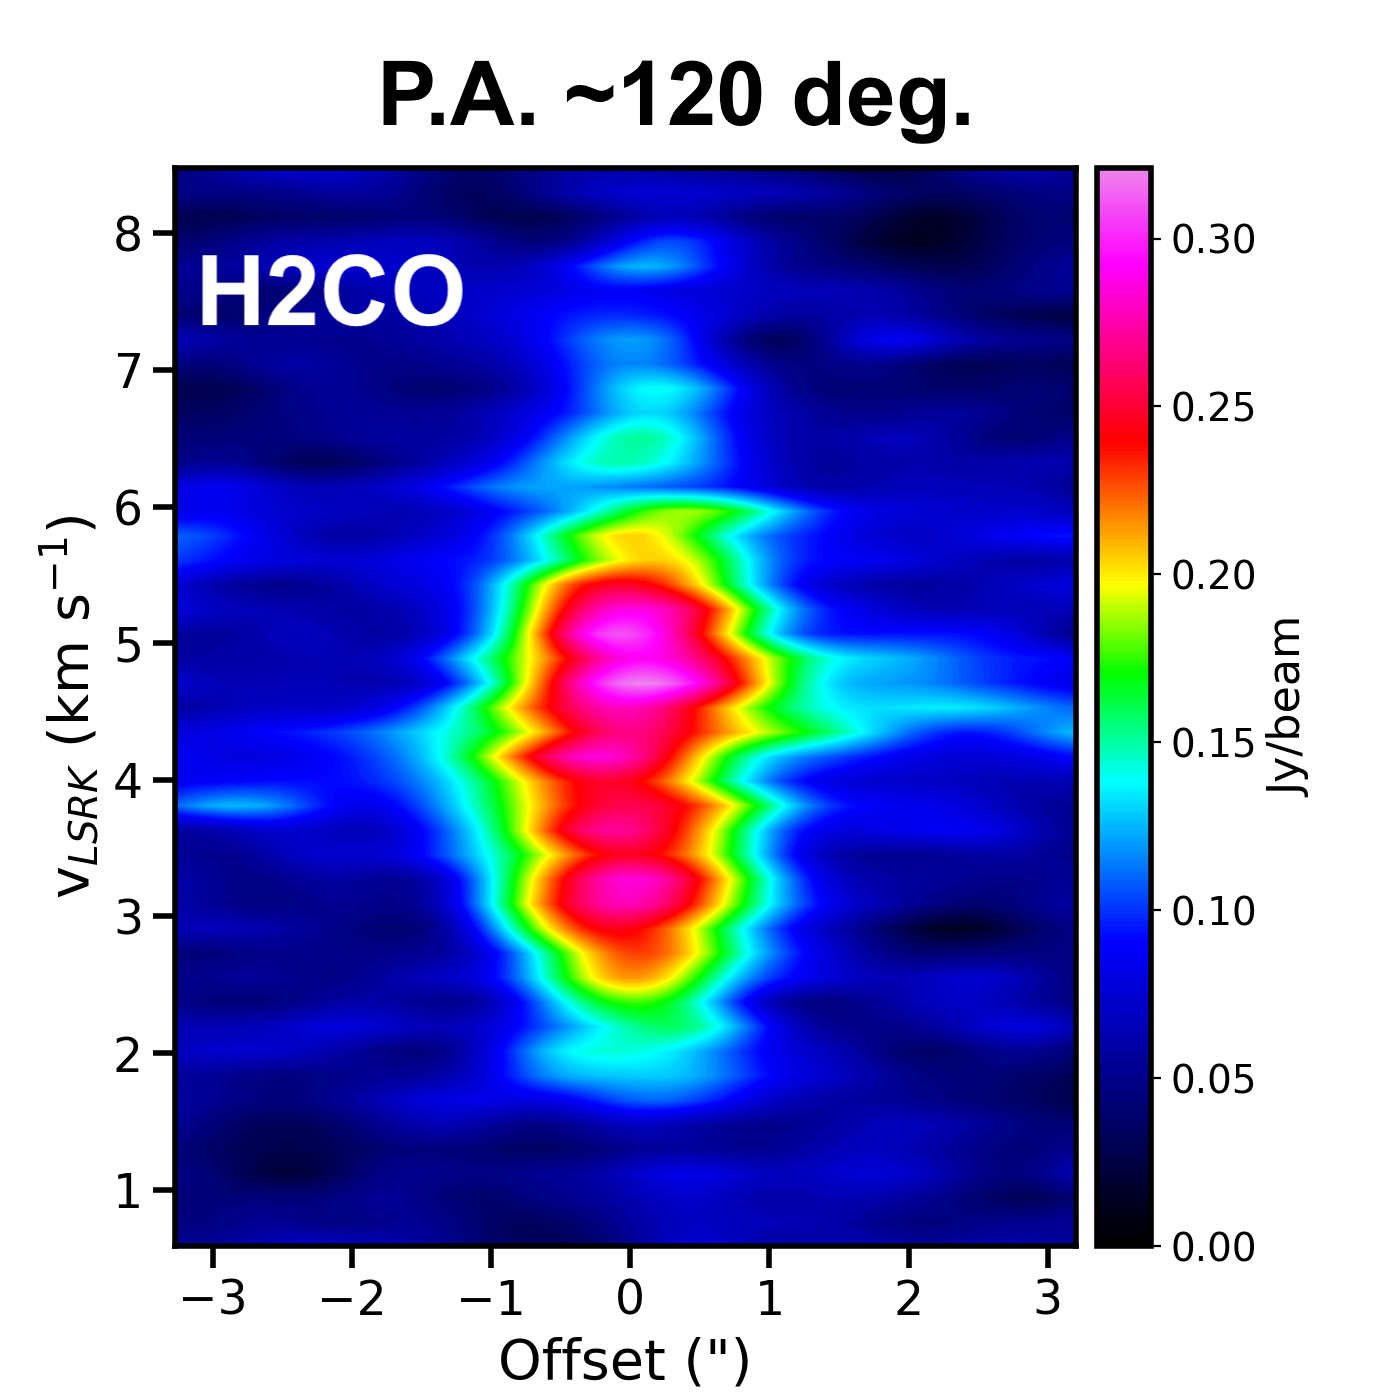
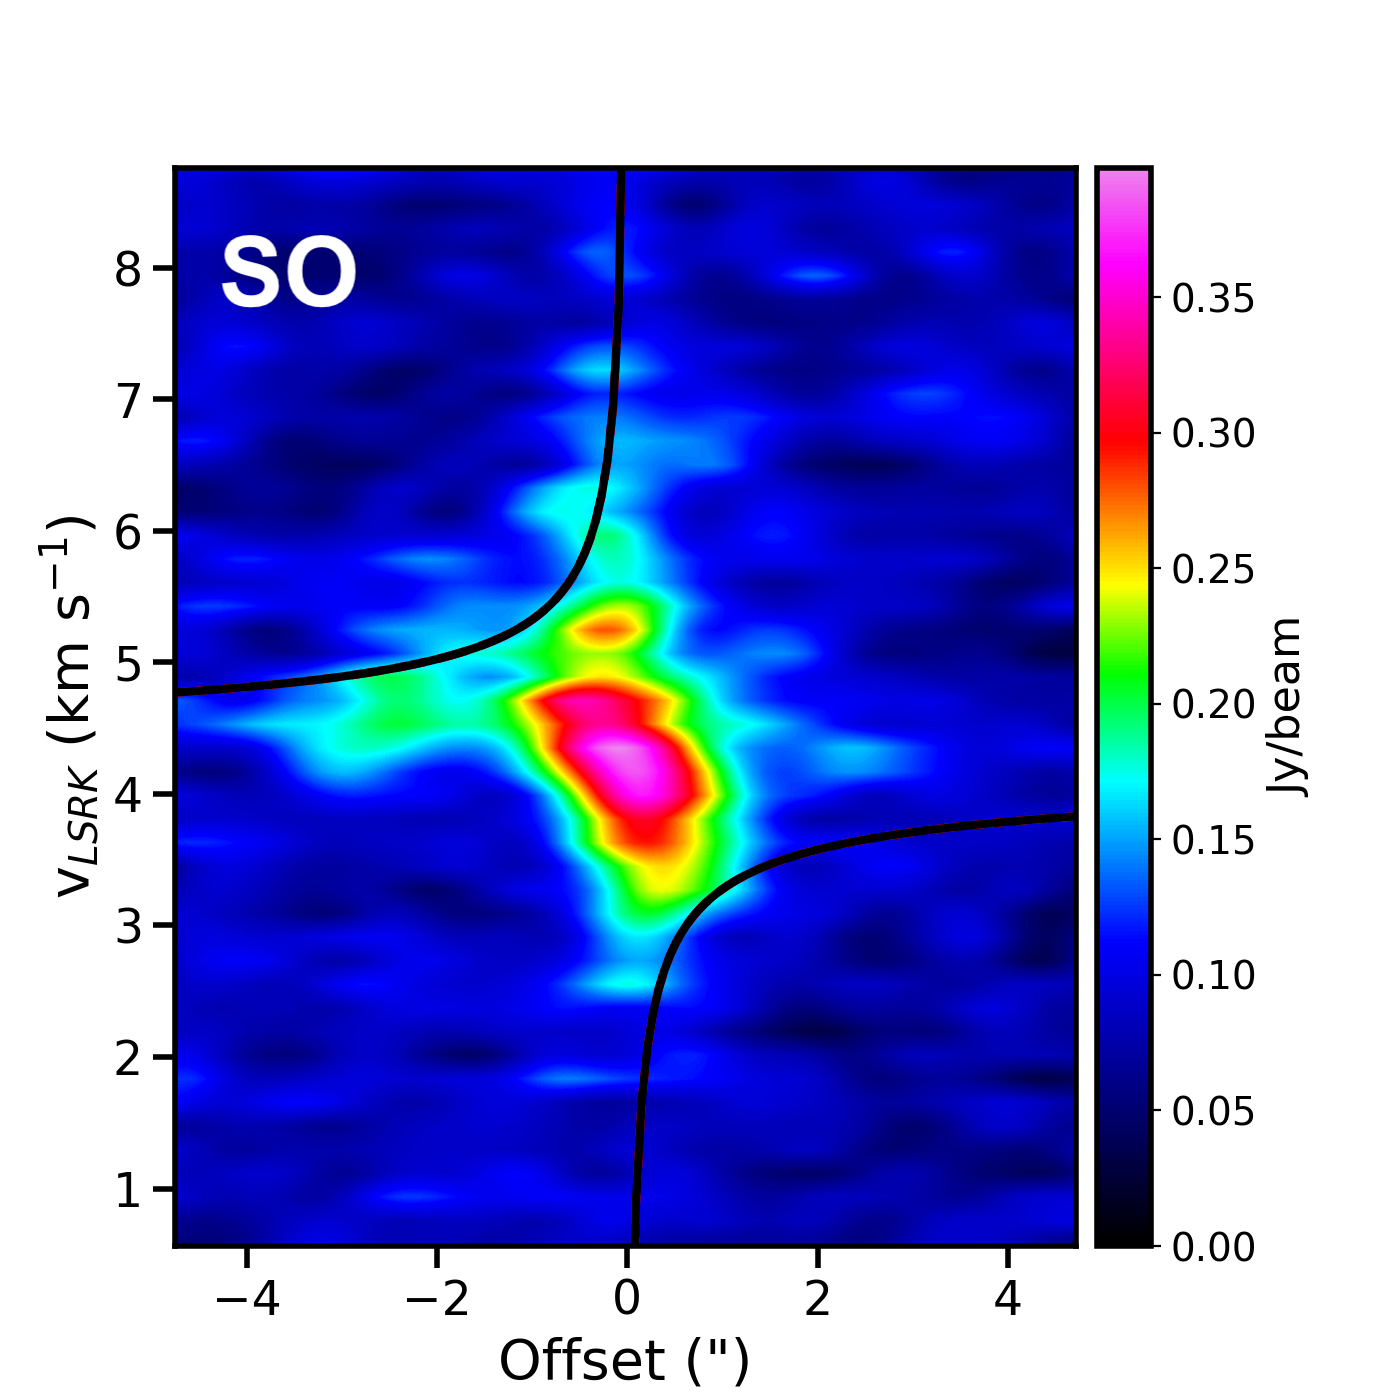
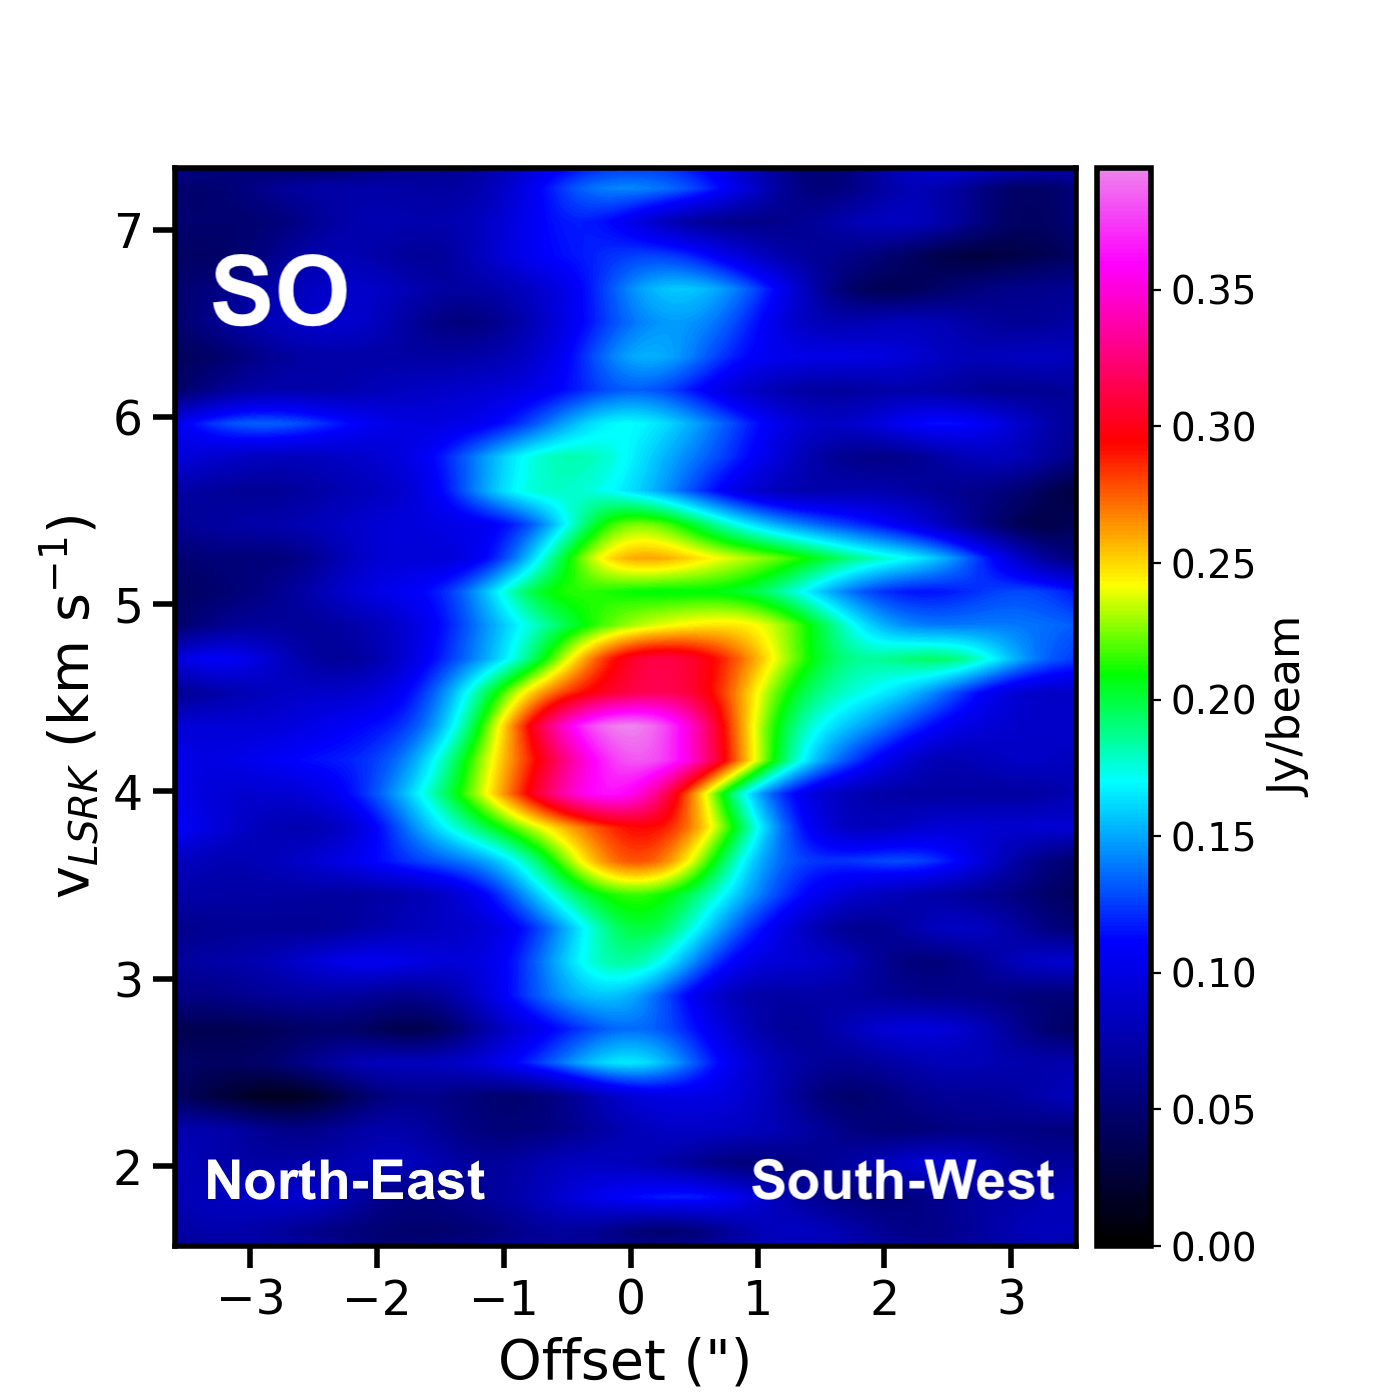
In order to disentangle outflowing and infalling gas from disc emission, we examine the velocity structures based on the position-velocity (PV) diagrams of the observed emission lines. To do so, we construct the PV diagrams along the horizontal direction through the centre of the disc ( 30o), and perpendicular to it, i.e. rotational axis of 120o (Ruíz-Rodríguez et al., 2017b). The reference cuts are illustrated by magenta dashed and blue solid lines in Fig. 2, top-middle. Figure 4 shows PV diagrams of these emission lines for slices through the central source along and perpendicular to the outflow rotation axis555The slow outflow traced by CO emission is oriented along a P.A. of 120 o (Ruíz-Rodríguez et al., 2017b). We do not include a PV diagram for CH3OH emission given the more compact nature of the disk structure traced by this molecule, thus preventing us from completely resolving any type of motion. Nevertheless, CH3OH emission has been previously detected in V883 Ori at higher resolution data with a compact structure of radius 125 au and characterized by a Keplerian rotation motion around the central source (Lee et al., 2019; Van ’t Hoff et al., 2018).
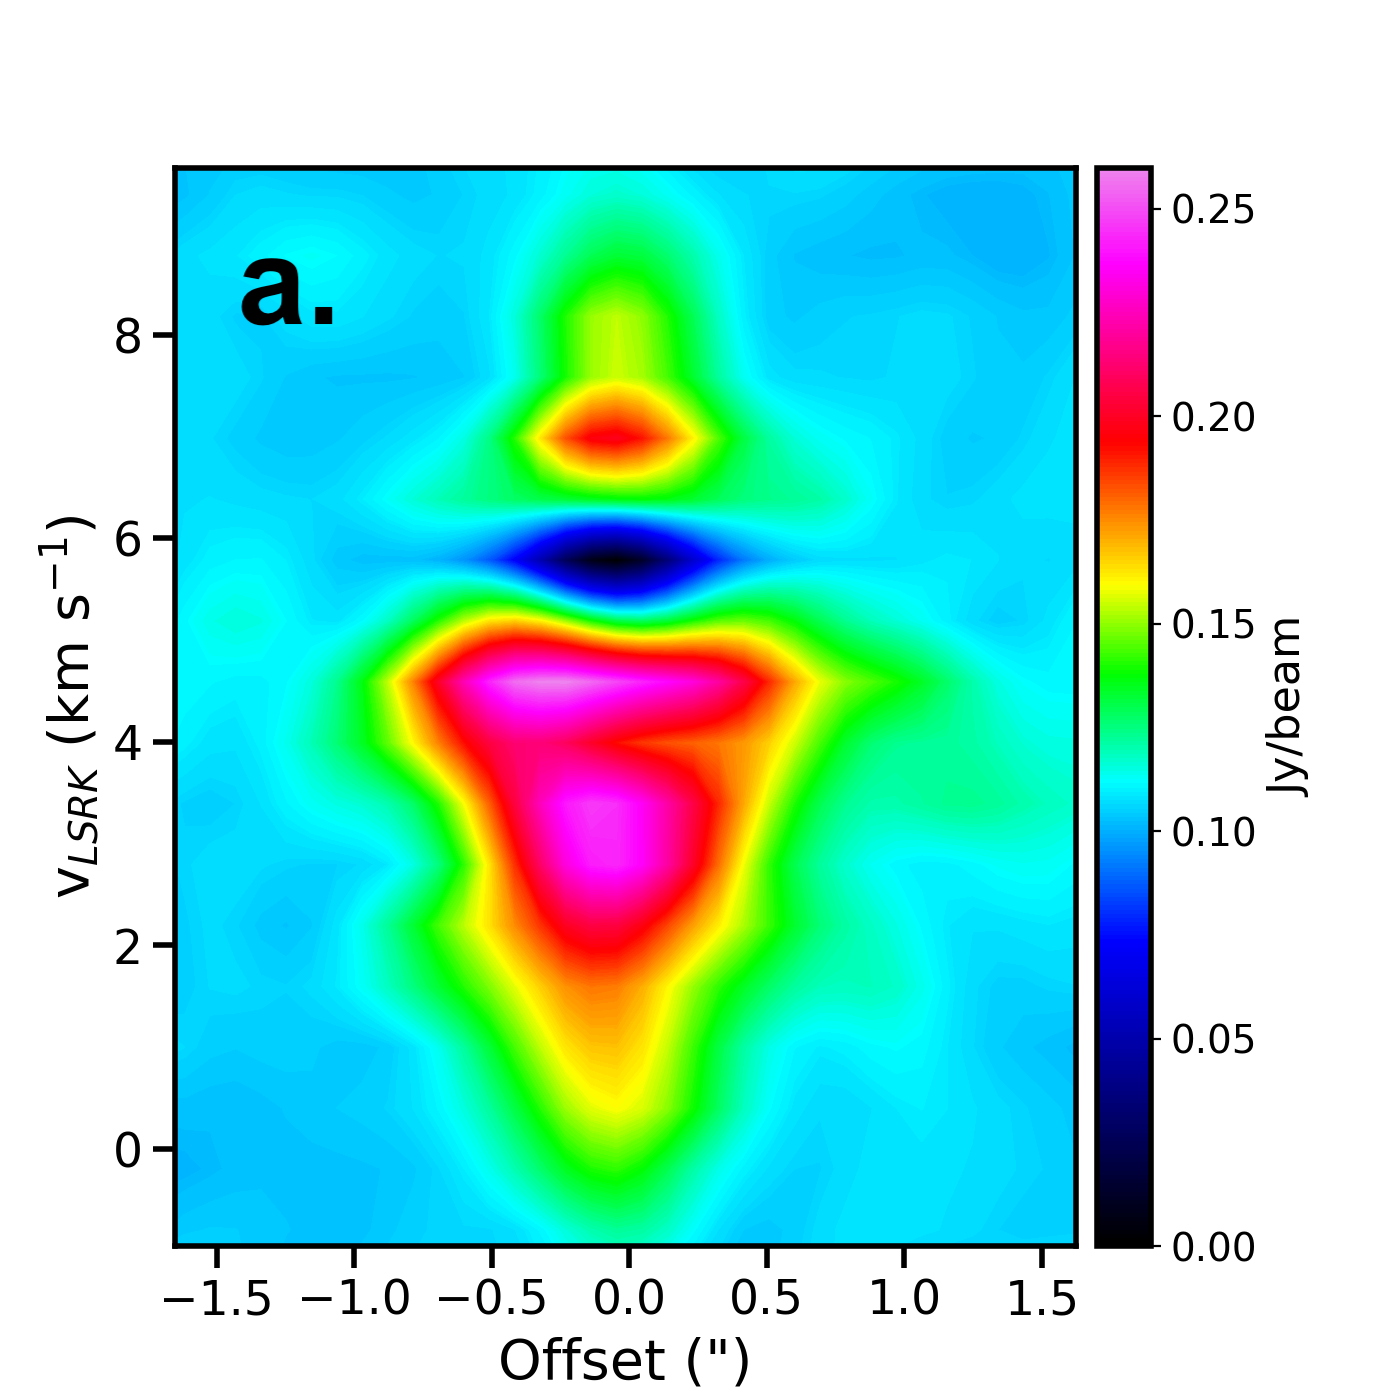
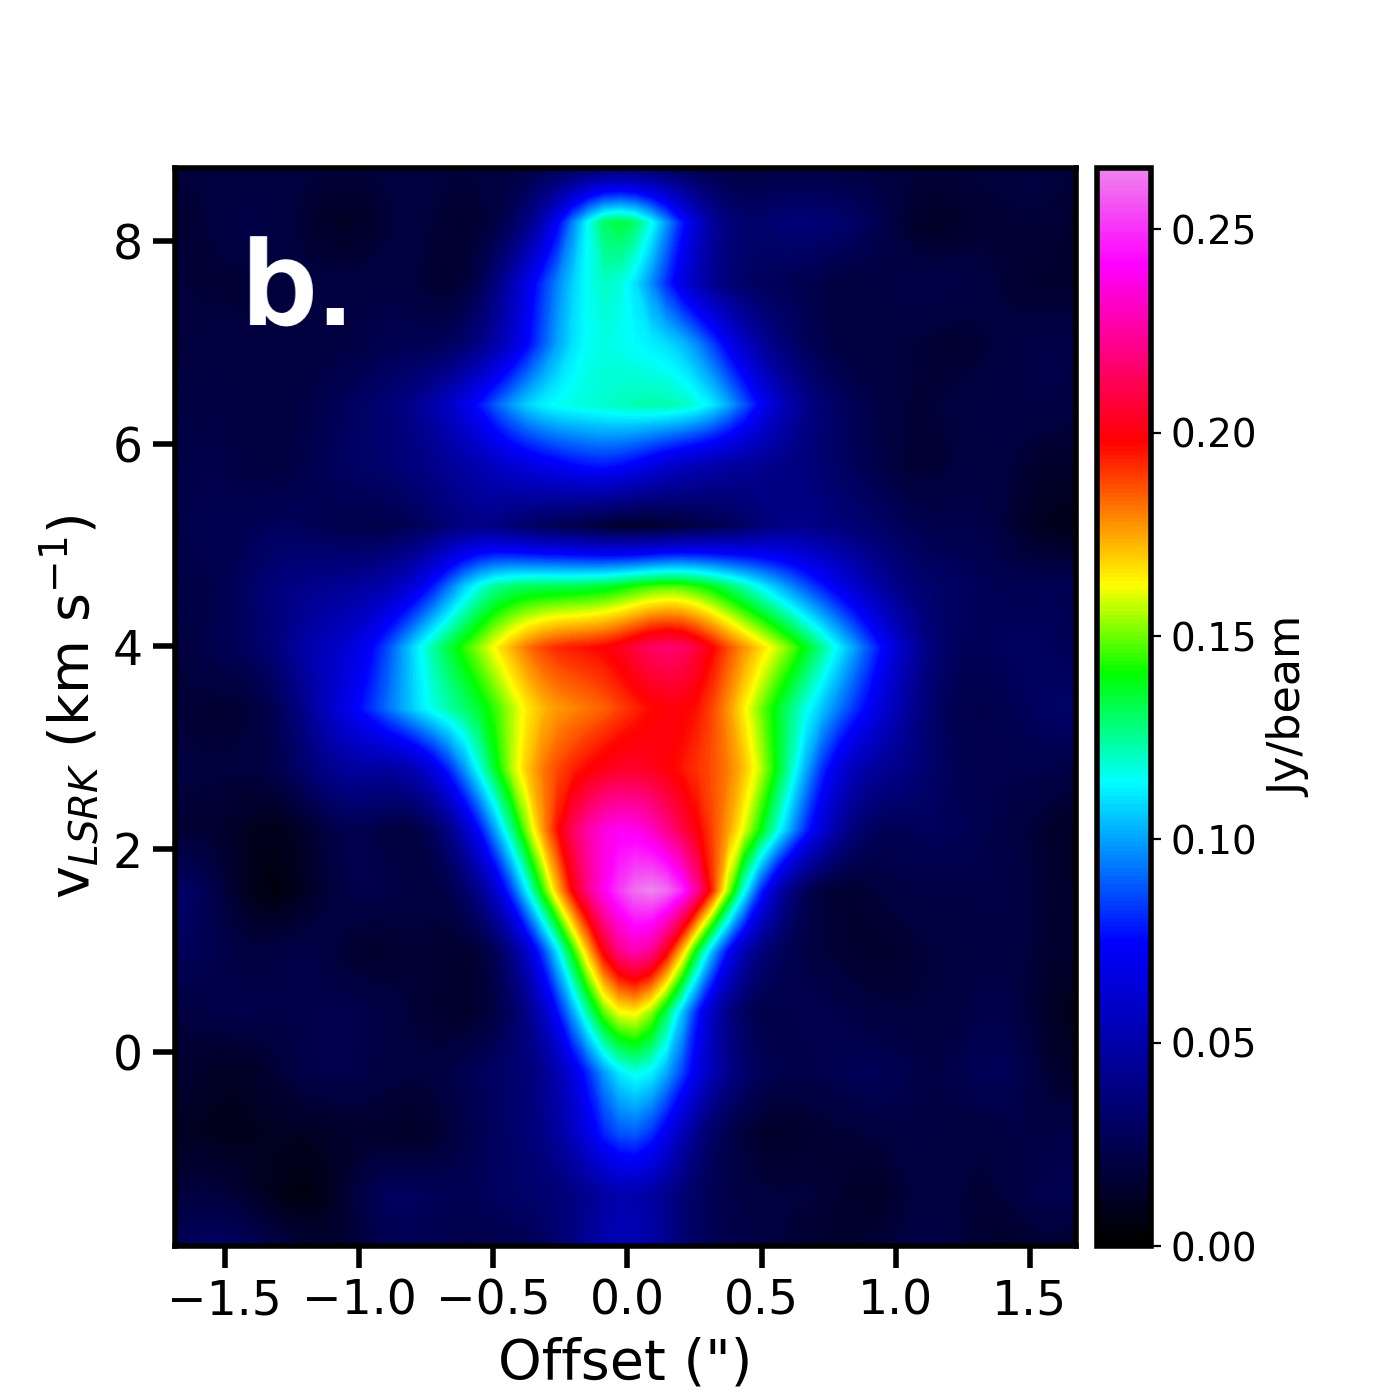
The PV diagrams extracted along P.A. 30o show blue-shifted and red-shifted components, suggestive of Keplerian rotation along the disc plane (Fig. 4, left panels). In particular, the HCO+, H2CO, and SO PV diagrams show a nearly constant velocity field centered at the systemic velocity of 4.5 km s-1, which extends up to 4" ( 2000 au), and trace material that belongs to the surrounding envelope and material falling towards the central source. On the other hand, the PV diagrams of lines such as HCO+ and HCN emission are indicative of infall motion along the rotational axis, i.e. P.A. 120o (Fig. 4, right panels). These emission PV diagrams present both red-shifted and blue-shifted emission at each side of the protostar position, resembling a “diamond PV shape", which is characteristic of material infalling close to the central source (e.g. Tobin et al., 2012). The infalling motion of HCO+ and HCN is supported by the strong red-shifted absorption features seen around 5.8 km s-1 and across the disc, see Figures 13 and 14.
3.2.2 Infall motion
To study in more detail whether the observations show evidence of infalling motion in the innermost ( 800 au) part of the V883 Ori system, we perform radiative transfer calculations via the Line Modelling Engine (LIME; Brinch Hogerheijde 2010) code to constrain the kinematics of the infalling material along the rotational axis. To that end, we adopted the canonical “inside-out" collapse model (Shu, 1977) based on a molecular cloud characterized by an inner region dominated by infalling motions and an outer region in a nearly static phase. In addition, we use the kinematic and density profiles resulting from the collapse of slowly rotating material from the inner regions of a molecular cloud (Ulrich, 1976; Cassen & Moosman, 1981; Terebey et al., 1984). As an initial assessment as to whether infall may be present, we compare these models with the HCN data. The non-LTE radiative transfer calculations for HCN use the collisional rate coefficients scaled to H2 taken from the LAMDA database (Dumouchel et al., 2010). The effects of the outburst in V883 Ori is represented by a generalized radial profile of temperature as follows:
| (2) |
where 100 K and 40 au. For V883 Ori, we adopted a central mass of 1.3 M⊙, an inclination of 38 deg. and a systemic velocity 4.5 km s-1 (Cieza et al., 2016). The initial radius of the infalling particle is assumed to be 320 au, see Table 4. In order to reproduce the red-shifted self-absorption feature together with the observed intensity levels, we have applied an HCN abundance of 1 10-8 and a mass infall rate of 5 10-6 yr-1 in our modeling process. To compare our model to the ALMA data, we produced synthetic line cubes with similar imaging parameters according to the data, see Sec. 2.1. Thus, the produced synthetic cubes were convolved with the observed beam size obtained for the HCN emission. Figure 5 shows PV diagrams for HCN, synthetic and observed, where the modeled velocity field and intensity levels are in good agreement with the data. The comparison in Fig. 5 hence confirms that the diamond-shaped velocity pattern traced by HCN emission in the PV diagram is consistent with the presence of material infalling toward V883 Ori in a direction perpendicular to the disk.
4 Discussion
4.1 Kinematics and Structure
Our ALMA observations reveal in the small velocity range 0 - 10 km s-1, a dense molecular structure traced by HCN, DCN, and HCO+ towards the central source and material likely heated by shocks detected in HCO+, SO, and H2CO emission at larger distances of 1500 au (see Figs. 1 and 3). The velocity maps and PV diagrams (Figs. 2, 4) reveal that these species trace different regions of the disc-cavity system. In particular, HCN and DCN likely trace material feeding the central object and are associated with the densest molecular regions as these species tend to be abundant in regions where gas number densities range from 106 to 108 cm-3 (Willacy, 2007; Walsh et al., 2010), whereas HCO+ likely delineates an intermediate, dense, and possibly turbulent mixing layer, whose more diffuse nature indicates an interface between disc and envelope material (see also Sec. 4.4). The HCO+ emission is mostly observed at the northern side (Fig. 13), since V883 Ori is non-uniformly embedded in the molecular cloud with a visible southern outflow carving out the surrounding material (Strom & Strom, 1993). These kinematic features are consistent with the previous 12CO, 13CO, and C18O observations presented in Ruíz-Rodríguez et al. (2017b), where 12CO traces the southern side of the cavity, 13CO traces marginally optically thick material from the northern side of the cavity, and C18O traces optically thin material from the disc midplane. The HCO+ emission morphology is also consistent with that found in H2CO and SO, which trace the northern outflow cavity wall structure, but at different scales, from the disc throughout the surrounding envelope (Figs. 1 and 2).
In general, emission from molecules such as H2CO, SO, and CH3OH is known to be enhanced in the gas phase by shocks and has been detected in active outflow-shocked regions (e.g. Jørgensen et al., 2004). Accordingly, CH3OH is expected to be found along the cavity walls. Instead, a compact CH3OH emission with a radius of 120 au was detected around the central source (Fig. 1). This indicates that the CH3OH enhancement in V883 Ori is not directly associated with high velocity shocks but more likely results from the shear between the disc and relatively slow outflows (Ruíz-Rodríguez et al., 2017b) or any other strong mechanism that releases ices from grain mantles (e.g. X-rays), thus heating the grain surfaces and liberating the grain mantles (e.g. Walsh et al., 2014), as further discussed below. This interpretation is also supported by the production of H2CO around the central source, which likely is evaporated directly from the icy dust mantles (e.g. Loomis et al., 2015), and similar to CH3OH and HCN, only survive sputtering or desorption of grain mantles at low-shock velocities of 10 km s-1 or less (Van Dishoeck & Blake, 1998). The absence of velocities 10 km s-1 also explains the lack of SiO emission that requires grain core or mantle destruction, a process that occurs at shock velocities in excess of25 km s-1 (Schilke et al., 1997). Another possible scenario, explaining an enhancement of CH3OH and H2CO with no SiO may be related with the shock evolution in V883 Ori, tracing a post-outburst stage within molecular depletion timescales of 103 yr (e.g. Mikami et al., 1992; Burkhardt et al., 2019), where it is expected that SiO molecules are re-incorporated to the grains while some molecules such as CH3OH and H2CO remain in the gas-phase in presence of weak shocks.
4.2 HCO+ and CO Rings: Chemistry, or Optical Depth Effects?
At first glance, the most striking feature of the molecular line data is a ring-shaped molecular structure detected in HCO+ with inner radius of 130 au (Sec. 3.1), and whose inner cavity radius appears to match that of the continuum (125 au; Cieza et al., 2016). Interestingly, a similar ring-like structure has been previously observed in 12CO and 13CO emission (Ruíz-Rodríguez et al., 2017b), where the inner depression or “hole” detected in these lines also has a size very similar to that estimated for the sub-millimeter continuum ( 100 au; Figure 19). These slight discrepancies in continuum and inner cavity radii are likely due to the different beam sizes (0.5 for HCO+ vs. 0.35 for the CO isotopologues).
4.2.1 Optical Depth Effects
The fact that a central cavity is obtained in HCO+, 12CO and 13CO suggests that the emission from these molecules is affected by a combination of self-absorption and/or absorption of continuum emission. This, in turn, implies that these emission lines are optically thick (as commonly found in dense YSO environments) and/or that the dust is optically thicker than the HCO+, HCN, 12CO and 13CO emission towards the innermost region (0.3") of the V883 Ori system. This can be inferred from the strong red-shifted absorption against the bright continuum emission detected in the PV diagrams of HCN, HCO+, 12CO, and 13CO as well as the less deep blue-shifted absorption of the HCO+, 12CO, and 13CO lines (see Figs. 4 and 20). The strong red-shifted absorption feature can also be seen in Figs. 13 and 14, where the HCO+ and HCN channel maps show negative flux values mainly at the central rest line frequency, 265.886 and 267.557 GHz, respectively (i.e. 5.8 km s-1). The negative values indicate that the absorption of continuum emission by foreground cold gas is responsible for this inner depression in these channel maps, given that an actual absorption by colder material in the line of sight is necessary to yield negative fluxes after the process of continuum subtraction.
In addition, it has been shown that when the line emission is optically thick, such that it significantly absorbs the continuum, this leads to overestimating the dust contribution and then underestimating the emission at the line frequency in the continuum subtraction process (e.g. Boehler et al., 2017; Weaver et al., 2018). To investigate whether the ring-like feature may also be a continuum subtraction artifact, we imaged the line data without continuum subtraction (see App. D). From a visual inspection of the resulting data cubes and product maps (i.e. peak intensity maps), we can confirm that this is also an artifact of subtracting the continuum from the HCO+ emission, indicating that the continuum is absorbing part of the line emission and that the HCO+ emission is optically thick towards the innermost region of V883 Ori.
The combination of these two optical depth effects can then explain the observed ring-like morphology of the HCO+ moment 0 emission map. Whereas the blue-shifted absorption can be explained by an optically thick line and disc continuum, the red-shifted absorbing layer could be either foreground infalling envelope or foreground ambient cloud material, wherein the star has a 1.5 km s-1 blue-shift with respect to the ambient cloud. We note that owing to the data angular resolution of the HCO+ emission, which allow us to probe only scales 90 au, and that disc temperatures may reach 100 K in the inner region, there may be other possible mechanisms that impact the chemistry of the disc mainly within 50 au (water-snow location) and upper surfaces at 50 au as explained below.
4.2.2 Destruction Pathways
Though the foregoing (optical depth) scenario appears to best explain the central cavity of 130 au in the HCO+ moment 0 map, we have also considered whether the lack of HCO+ emission might be due to chemical destruction pathways, at least to a lesser extent, in disc regions where temperatures reach out values of 100 K radially and vertically dependent. Such another possible scenario to explain a lack of HCO+ emission is related to the high energy sources (e.g. X-rays, UV radiation), largely generated by the recent outburst and high accretion levels in V883 Ori, that tend to produce warm ionized layers of the disc and outflow exposed to it, influencing its chemistry. In this scenario, higher ionization rates increase the amount of H, which readily destroys CO to form HCO+, primarily via the reaction:
| (3) |
To explain the observed inner depression in HCO+, a chemical destruction pathway has been suggested requiring temperatures of 100 K, consistent with the outgoing outburst in V883 Ori and its effects on the surroundings (Jørgensen et al., 2013; Leemker et al., 2021). Specifically, dipolar and neutral molecules such as H2O, which is sublimated at the inner region of V883 Ori at temperatures of 100 K (Brown & Bolina, 2007; Cieza et al., 2016), can destroy HCO+ efficiently (Jørgensen et al., 2013) via the mechanism:
| (4) |
If that is the case, HCO+ may coexist with frozen water delimiting the location of the snow-line at layers higher up from the disc mid-plane, i.e. intermediate layers, and at radii 50 au, while there is a lack of HCO+ inside the water snow-line (i.e. 50 au). However, the optically thick nature of HCO+ in YSOs (e.g. Van ’t Hoff et al., 2021) prevents us to observationally confirm or discard this scenario. Following this approach, HCO+ isotopologue emission can be expected to arise from denser and colder regions (80 K), coexisting with frozen water as described below.


4.3 Tracing water snow lines with HCO+ isotopologues and CH3OH emission
It has been suggested that if the temperature of the dust grains rises above 85 K, the destruction of HCO+ due to sublimated water is viable and CH3OH could be also liberated from the grain surfaces through thermal desorption (Brown & Bolina, 2007; Jørgensen et al., 2013). Hence, it is possible to trace the water snow line location determined by high temperatures in V883 Ori studying these molecules. However, as mentioned above, it is necessary to use optically thin tracers such as H13CO+ and HC18O+ lines, whose critical densities allow to probe deeper and denser regions in the system, rather than the parent chemical, HCO+.
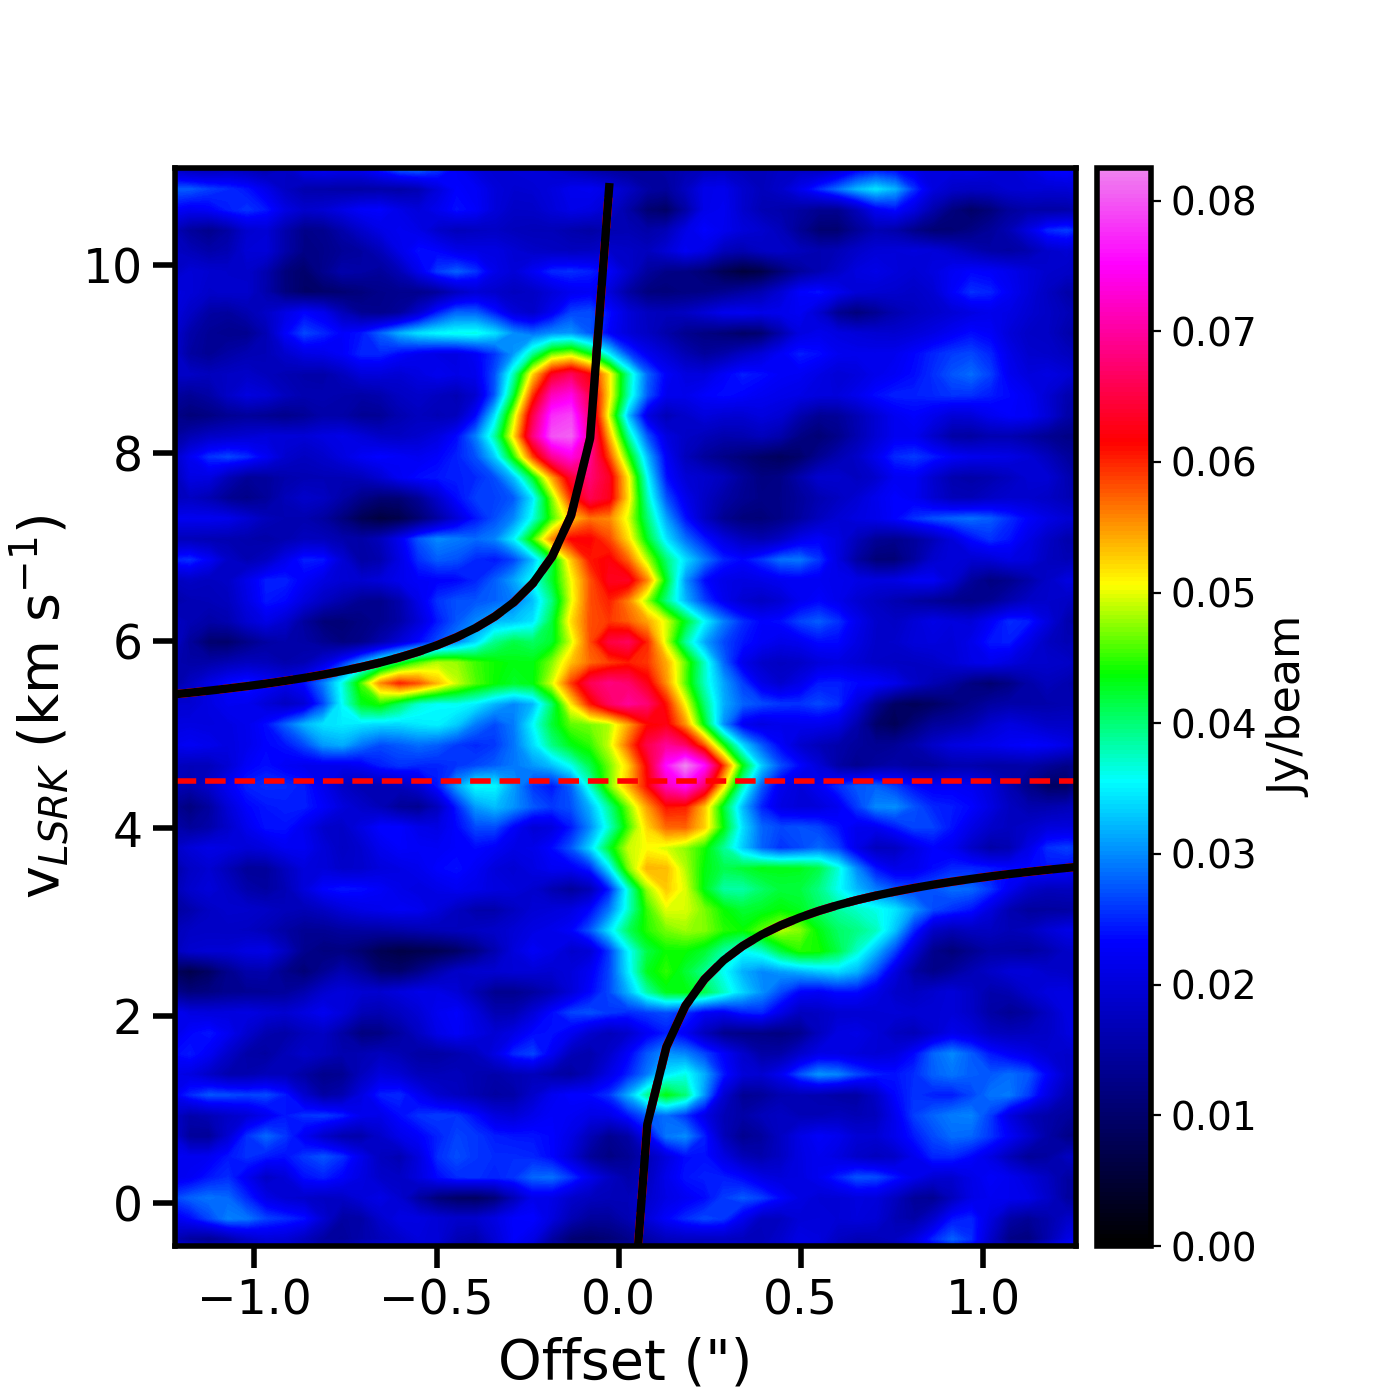
For our purposes, we collected archival raw data from the project 2017.1.01066.T (PI: Jeong-Eun Lee) to complement our analysis in Band 7 (275-373 GHz), which includes the H13CO+ J = 4-3 at 346.998 GHz transition. These observations were taken during Cycle 5 with a final synthesized beam of 0.19 arcsec 0.17 arcsec and a spectral resolution666More observational details can be found in Lee et al. (2019). of 0.24 km s-1. Unfortunately, H13CO+ is blended with transitions from acetaldehyde (CH3CHO) making necessary to reduce line blending effects by using the Keplerian velocity of the disc to calculate the Doppler shift of the emission in each pixel (e.g. Yen et al., 2016; Lee et al., 2019). A more complete analysis of this data set was reported in Leemker et al. (2021) for more details. Using this approach, H13CO+ emission is detected at 5 but is still blended with acetaldehyde lines that are expected to peak on-source as further discussed below. Figure 6 shows the integrated intensity of the isotopologue H13CO+ J = 4-3 line towards V883 Ori. Closely matching the outer radial extension of the ring-like structure detected in HCO+ emission, see Fig. 1, H13CO+ is located within a radius of 300 au, see Table 5, and presents an inner rotating-supported Keplerian disc as revealed by its PV diagram, see Fig. 21. The distribution of these molecules indicates that the HCO+ emission is indeed optically thick tracing also colder outflow material (Fig. 13), and that its ring-like emission structure obtained in the moment-0 map is mainly a result of optical depth effects (see 4.2.1). The detection of the optically thin H13CO+ emission within a radius of 300 au also suggests a higher abundance of HCO+ towards the disc midplane at lower temperatures (i.e. < 80 K) and higher densities, where both molecules are thought to exist due to their similar critical densities of 2.8106 cm-3 for H13CO+ J = 4-3 and 1.4106 cm-3 for HCO+ J = 3-2 in a temperature range between 20 and 70 K 777The collisional rates are adapted from the Leiden LAMDA database (Schöier et al., 2005; Van der Tak et al., 2020)..
In addition, from ALMA band-7 observations at a higher resolution (0.05") taken during Cycle 4 (2016.1.00728.S, PI: Lucas Cieza), Lee et al. (2019) detected a CH3OH ring-like emission structure with an inner radius of 40 au (Fig. 7), close to the water snow-line location at 42 au at the midplane (Cieza et al., 2016). These authors claimed that the dust continuum opacity is too high to detect sublimated CH3OH in the inner region ( 50 au), while around the water snow line, the continuum opacity becomes low enough allowing CH3OH emission to be detected at larger radii. From our observations with a coarser beam (0.5"), CH3OH is highly concentrated near the central object position, and spatially matches the dust continuum outer radial extension ( 125 au; Cieza et al., 2016). This indicates that the CH3OH emission arises in a compact, warm and dense region where the entire dust grains are heated thermally to 80-100 K, and thus the icy mantle evaporates, releasing CH3OH into the gas phase.
In order to further compare the distribution of the detected CH3OH and H13CO+ emission lines with the dust extension and water snowline location estimated previously from higher-resolution observations (Cieza et al., 2016), we additionally extracted the radial intensity profiles for the high-resolution CH3OH emission presented in Lee et al. (2019) together with the H13CO+ emission line (Figs. 6 and 7). To do so, we follow a similar approach as described in Sec. 3.1. For consistency, we extracted CH3OH data cubes with the coarser resolution of the H13CO+ data. The resulting radial profiles are displayed in Figure 8, and parameters are listed in Table 5. Despite the line blending in H13CO+ line, we have been able to estimate a radial extension of 290 au from the outer region of the emission, however, we are unable to resolve substructures within the very central region of the disc which is still contaminated by relatively strong CH3CHO features. This can be seen in Fig. 8, where the H13CO+ azimuthal radial profile displays an intensity break at 130 au resulting from the presence of strong CH3CHO features that were not possible to remove in the data reduction process. This H13CO+ intensity break also matches up with the radial extension estimated by Cieza et al. (2016) of 125 au making more difficult its interpretation. While we do not find firm evidence of differentiation in terms of their patterns in the moment-0 map and P-V diagram, we cannot completely rule out that H13CO+ emission may originate more prominently from smaller radii within the snow line location ( 50 au), which appears somewhat similar to the case of CH3OH with the coarser resolution. Likewise, the H13CO+ emission could appear to feature an annular gap, i.e., a ring-like depression in the emission profile similar to the HCO+ emission, but with the current data set this scenario is also inconclusive. Higher spatial and spectral resolution would be necessary to better describe the central component of the H13CO+ emission –a transition that is not blended with any COMs– in V883 Ori.
Although, it is difficult to establish the exact physical origin of the CH3OH and H13CO+ emission in the disc; i.e. midplane vs. surface layers, we should account that V883 Ori undergoes an outburst episode with resulting shocks that impact mostly the upper and intermediate layers of the dust grains. Thus, considering that CH3OH may work as a good proxy for water vapor as it desorbs at similar temperatures (i.e. 85 K), and the location of the water snowline in V883 Ori was estimated to be at 42 au at the midplane (Cieza et al., 2016), it would mean temperatures above 100 K along intermediate and surface layers at larger radii. Accordingly, the origin of CH3OH and H13CO+ may be located above and below the warm upper layer (T 85-100 K) in the disc, respectively.
4.3.1 Implications of the water snow line location in the disc midplane
The location of the water snow in the disc mid-plane is critically important for planet formation. Its position controls the efficiency in the growth of dust, planetesimal, ice giants, and the cores of gas giants (Blum & Wurm, 2008; Morbidelli et al., 2015). It also regulates the delivery of water to the surface of rocky planets interior to the snowline (Raymond et al., 2007). Because protoplanetary discs show a very high degree of dust settling (e.g Ruíz-Rodríguez et al., 2020), dust discs are geometrically very thin, with scales heights of only 1 au at 100 au radii (Pinte et al., 2016). Therefore, since the position of the snow line can be a strong function of the scale height, it becomes important to probe the location of the line as close to the midplane as possible, where planet formation is expected to occur.
The water snow line in protoplanetary discs around solar-type stars is expected to be located at 3-5 au in the midplane (Kennedy & Kenyon, 2008). However, in the case of FU Ori objects such as V883 Ori, the outburst luminosity can push the snow line to much larger distances. The exact position of the water snow in the disc midplane of V883 Ori has been a subject of intense debate in recent years. Initially, Cieza et al. (2016) suggested a distance of 42 au from the star based on intensity break seen at 0.1" in the 1.3 mm continuum image and on the brightness temperature of these data. Schoonenberg et al. (2017) modeled the intra-band spectral index (between 218 and 230 GHz) profile of the disc and concluded that water snow line is located at 50 au. From band-7 observations at 60 au resolution, Van ’t Hoff et al. (2018) detected CH3OH in the V883 Ori disc up to 140 au, suggesting that the snow line of water and CH3OH could be at distances as large as 100 au. Lee et al. (2019) also detected CH3OH at large distances from the star but explains this finding as the detection of gas-phase molecules in the surface layers of the disc. More recently, Leemker et al. (2021) argue that the ring-like shaped image of the HCO+ line presented here, see Fig. 1, is caused by the destruction of HCO+ by gas-phase water (see Eq. 2), serving as observational evidence for the water snow line being located at 75-120 au, but using the definition of the snowline as the mid-plane radius in where 50 of the water is in the gas phase and 50 is frozen out onto the dust grains.
As discussed in Sec. 4.2, we argue that the dust continuum is optically thicker than the HCO+ line at 0.3" and that HCO+ line traces self-absorption and absorption of dust emission in the inner region of the V883 Ori system. Overall, we find that the molecular lines available reveal a complex radial and vertical structure in the V883 Ori gas disc, making it difficult to identify the location of the water snowline in the disc midplane. However, as mentioned above, the dust disc is geometrically very thin, rendering continuum data easier to interpret in terms of its thermal structure. More recently, an analysis of the multi-frequency (44, 100, 230, 345 GHz) high-resolution (0.07") continuum images of V883 Ori suggests that the temperature of the dust reaches 100 K at 50 au (Cieza et al., in prep), indicating that the midplane water snow line is in fact well within 50 au from the star. In particular, the discrepancy with the snowline location found by Leemker et al. (2021) could be reconciled if the current lack of HCO+ actually traces the water vapor in the disc, but taking into account that there is a significant chemical lag following a sudden heating event (Hsieh, 2019). If V883 Ori has undergone a burst within the last 1001000 yrs, increasing its luminosity an order of magnitude larger, it is likely that water was sublimated in the midplane out to 100 au, while destroying HCO+ out to this radius. Currently, the luminosity of V883 Ori is lower and the dust has cooled down, which locates the 100 K radius at 50 au. Accordingly, the dust temperature traces the current water sublimation radius at the midplane, whereas HCO+ traces water vapor at intermediate layers above the midplane where temperatures reach 100 K.
4.4 Optical Depth and Physical Structure
Considering that HCN and HCO+ are high-density tracers, it is odd that from our data a similar ring pattern is not seen in HCN. A possible explanation might be related to optical depths effects and that these molecules are tracing different regions from the surface to midplane layers, and from the disc to shocking outflows, i.e. due to variations in density and temperature. While it is expected that HCN J = 3-2 and HCO+ J = 3-2 may be produced under similar physical conditions due to their similar dipole moments and high critical densities of 1107 cm-3 for HCN J = 3-2 and 1106 cm-3 for HCO+ J = 3-2 in a temperature range between 20 and 70 K888The collisional rates are adapted from the Leiden LAMDA database (Schöier et al., 2005; Van der Tak et al., 2020). For HCO+ J=3-2 and HCN J=3-2, the collisional coefficients are from Flower (1999) and Dumouchel et al. (2010)., different ionization rates can affect the HCO+ abundance (Krolik & Kallman, 1983), which is also thermalized at lower densities than HCN. As a result, HCO+ can remain abundant and excited in diffuse gas, such as those layers closer to the surface. This can explain the difference observed between a centralized HCN emission and a more extended HCO+, see Fig. 1, whose emission bulk of a radius 450 au trace the denser material orbiting and feeding the central source. This is consistent with a HCN/HCO+ ratio of 0.8 estimated within a circle region enclosed by the HCO+ ring diameter, and tracing gas with intermediate densities between CO and HCN since HCO+ has a critical density nearly an order of magnitude lower than HCN, i.e. densities of 106 cm-3. However, higher resolution observations are needed to probe or discard the existence of a real inner hole in HCN and HCO+ as observed in other tracers such as CH3OH (Lee et al., 2019), since our data might have suffered significantly from beam dilution as was the case with our ALMA cycle 6 CH3OH observation.
4.5 Shocks vs. High-energy radiation
An important, but yet unresolved, question concerns the impact of heating and/or ionizing sources on the reaction which leads to the production of the observed chemistry in FUor systems and its evolution. One possibility is shocks. As mentioned above, detections of CH3OH and H2CO tracing slow velocities – together with a lack of SiO – suggest weak shocks in V883 Ori, which may indicate a later stage in the shock evolution and after an outburst episode as also previously suggested by Ruíz-Rodríguez et al. (2017b). However, dense gas traced by HCO+ and HCN emission indicate that the weak and slow shocks alone are insufficient to explain the measured enhancements of these molecules near the central source (e.g. Tafalla, 2013), specially the HCO+ abundance variation on the 200- to 3000- au scale and observed as a sharp break in the intensity profile at 500 au. The last features suggest that an additional high-energy radiation source is also needed in order to produce these emissions concentrated towards the central star. On the one hand, the formation and fractionation of HCN are controlled by the UV radiation; the former through vibrational excitation of H2, the latter through self-shielding of N2. On the other hand, the HCO+ emission can potentially be explained via X-ray driven chemistry enhancing the HCO+ abundance in the intermediate layers close to the central source (Cleeves et al., 2017). Although V883 Ori would appear to have inefficient X-ray heating and a low ionization level based on a non-detection obtained with the XMM-Newton X-ray Observatory – an inferred 3 upper limit on X-ray luminosity of log Lx 29.7 erg s-1 assuming an intervening absorbing column of NH = 6.31021 cm-2 (Kuhn & Hillenbrand, 2019) – we must note that the non-detection does not mean that the X-rays are not present in the system, as the infalling envelope material seen along the line of sight toward the star-disk may have very high column densities which could absorb X-ray emission. That conclusion seems consistent with colors of V883 Ori. Specifically, the observed J-K color (J-K = 4.1) indicates E(J-K) 4 assuming A-type star photospheric colors, suggesting Ak 1.6 mag, Av 16 mag. This would translate to NH = 3.51022 cm-2, leading to an estimated upper limit on intrinsic X-ray luminosity of Lx 30.5 erg s-1. While self-absorption by the dust continuum and cold gas appear to be the dominant effect contributing to the pronounced inner depression in HCO+, a HCN/HCO+ ratio of 0.8 indicates that, at least within a radius of 500 au, these tracers are being produced under similar thermal and excitation conditions, however, it remains unexplained the level of influence of shocks and/or high-energy radiation on the rich-chemistry observed in V883 Ori.
5 Conclusions
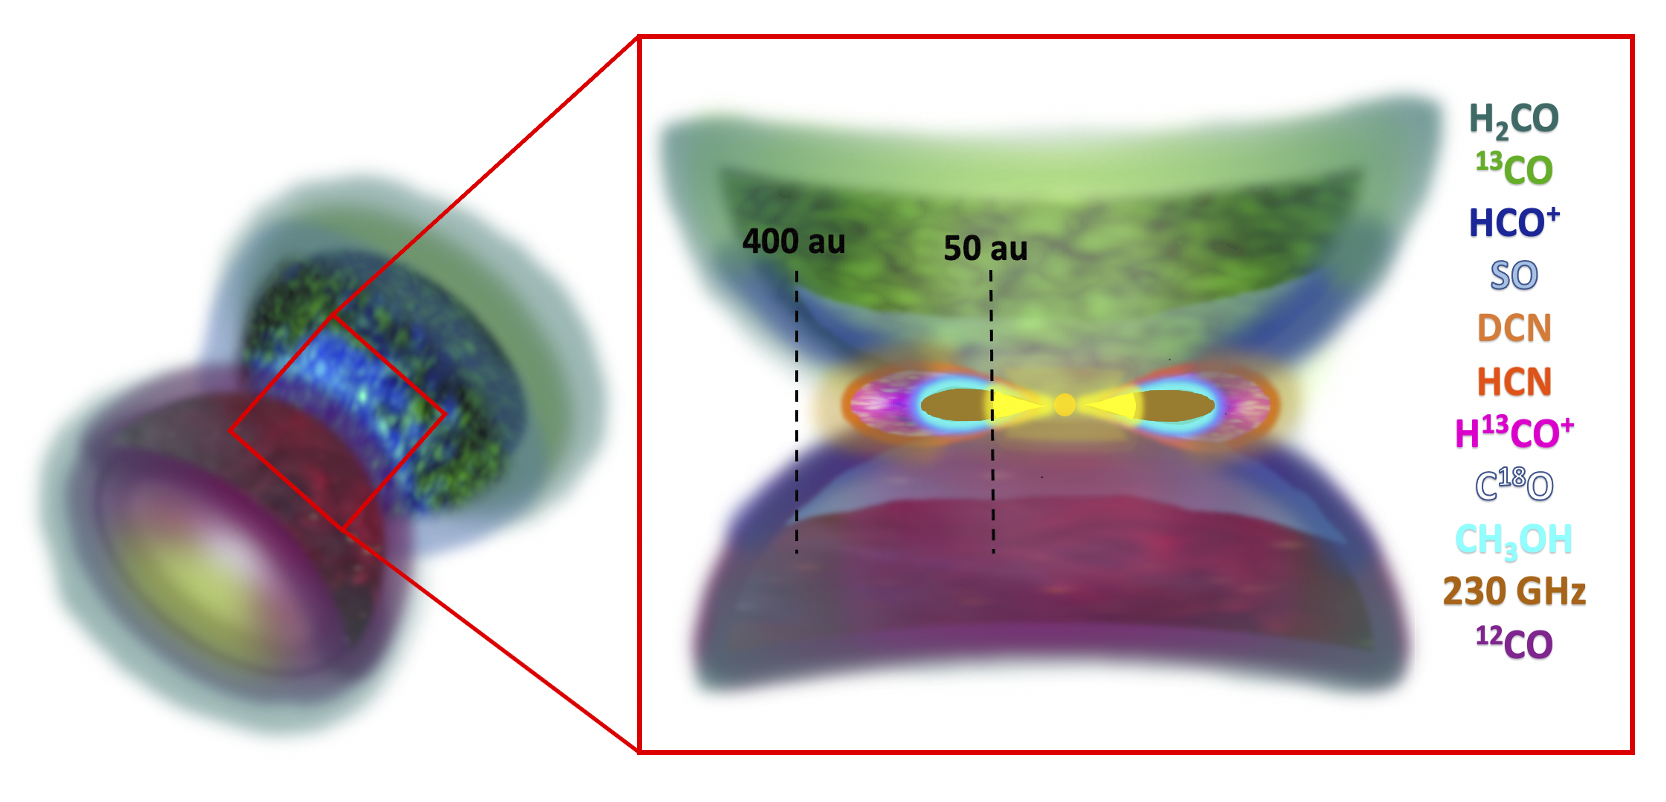
In this paper, we present an ALMA spectral line study of the V883 Ori system covering size scales from the disc to outflow and envelope material. To that end, we opted to combine the TP, 7-m, and 12-m arrays from ALMA, and this broad coverage allows us to detect a complex disk-outflow structure associated with V883 Ori on scales from 0.5 to 20 ( 200 - 8000 au at 417 pc). Using HCN, HCO+, CH3OH, SO, DCN, and H2CO, 12CO and 13CO emission, we have studied the kinematic and chemical structures in the circumstellar environment of V883 Ori. Fig. 9 presents an overview of the results, which are summarized below:
1. V883 Ori is characterized by a very slow molecular outflow, previously detected in 12CO and 13CO. Our ALMA observations confirmed that the kinematics from more diffuse gas to the densest regions are also dominated by slow velocities in the small velocity range 0 - 10 km s-1.
2. This FUor object presents a centralized dense structure within a radius of 400 au traced by HCN, HCO+ and DCN emission together with material heated by shocks detected in CH3OH, SO, H2CO emission, while farther out it is a combination of disc and outflow signal traced by HCO+, SO, and H2CO, 12CO and 13CO emission. The extensions of the CH3OH and dust continuum emission from the disc are similarly compact (Cieza et al., 2016). HCN rises from a slightly more compact region than DCN emission, while the bulk of the H2CO emission matches the radial extension of HCN. In addition, slow outflows are traced by HCO+, SO, 12CO and 13CO emission.
3. Every molecular line displays Keplerian rotation around the central stellar mass of 1.3 M⊙ from the south-west (blue) to north-east (red) direction of the disc. In addition, high-density tracers such as HCN and HCO+ display in-fall motion perpendicular to the disc rotation direction (P.A. 120 deg.).
4. HCO+ line emission of V883 Ori extends up to 2000 au, in contrast to the more compact HCN and DCN line emission. This could indicate that HCN emission raises from deeper layers, while HCO+ is located at intermediate and more diffuse layers in the system.
5. The various chemical tracers reveal a complex physical (radial and vertical) structure in the V883 Ori environment, with morphological differences between the tracers that are indicative of the varying dominance of shocks (e.g. SO, H2CO) vs. radiation fields as drivers of the chemistry (e.g. HCN, HCO+). For instance, CH3OH and continuum emission are tightly correlated with each other. Based on their spatial distribution and high temperatures in the inner region of the V883 Ori disc, CH3OH is most likely released from the grain mantles into the gas phase via thermal sublimation (desorption) in hot regions (100 K).
6. Emission from HCO+ reveals a pronounced inner depression or “hole” with a size comparable to the radial extension estimated for the 230 GHz continuum (125 au; Cieza et al., 2016) and CH3OH emission. This inner “hole” is likely produced by the optically thick nature of the HCO+ and continuum emission, which can result in an artifact when over-subtracting the continuum from the HCO+ emission over a narrow range of (mostly red-shifted) velocity channels. In this velocity range, it appears the continuum emission is absorbed by foreground, optically thick (cold, dense) HCO+. The presence of this red-shifted absorption is hence an additional indication that HCO+ traces gas infalling onto the V883 Ori disk.
7. Our results are consistent with the water snow currently being located at 40 to 50 au in the midplane, as derived from analyses based on the continuum. However, we can not rule out an scenario in which the observed HCO+ ring is the result of previous outburst (100-1000 years ago) that sublimated the midplane water up to 100 au. In order to probe conclusively whether this scenario plays an important role in the HCO+ destruction or optical depth effects are responsible for the observed ring-like structures in V883 Ori, future ALMA high resolution and sensitivity observations of tracers such as H13CO+ and HC18O+ are needed.
Acknowledgements
We thank the anonymous referee for the helpful comments, and constructive remarks on this article. The National Radio Astronomy Observatory is a facility of the National Science Foundation operated under cooperative agreement by Associated Universities, Inc. This paper makes use of the following ALMA data: ADSJAO.ALMA2017.1.00015.S and ADSJAO.ALMA2018.1.01131.S. ALMA is a partnership of ESO (representing its member states), NSF (USA) and NINS (Japan), together with NRC (Canada), MOST and ASIAA (Taiwan), and KASI (Republic of Korea), in cooperation with the Republic of Chile. The Joint ALMA Observatory is operated by ESO, AUI/NRAO and NAOJ. J.P.W. acknowledges support from NSF grant AST-1907486. JHK’s research is supported in part by NASA Exoplanets Research Program grant 80NSSC19K0292 to Rochester Institute of Technology. L.A.C acknowledges the support from Agencia Nacional de Investigacion y Desarrollo de Chile (ANID) given by the grant FONDECYT Regular number 1211656. L.A.C acknowledges support from FONDECYT Grant 1211656 and the Millennium Nucleus YEMS, NCN2021-080, from ANID, Chile. M.L. acknowledges support from the Dutch Research Council (NWO) grant 618.000.001.
DATA AVAILABILITY
The data underlying this article are available in the ALMA archive at https://almascience.nrao.edu under project codes 2018.1.01131.S and 2017.1.00015.S.
References
- Audard et al. (2014) Audard M., et al., 2014, Protostars and Planets VI, pp 387–410
- Blum & Wurm (2008) Blum J., Wurm G., 2008, ARA&A, 46, 21
- Boehler et al. (2017) Boehler Y., Weaver E., Isella A., Ricci L., Grady C., Carpenter J., Perez L., 2017, ApJ, 840, 60
- Brown & Bolina (2007) Brown W. A., Bolina A. S., 2007, MNRAS, 374, 1006
- Burkhardt et al. (2019) Burkhardt A. M., Shingledecker C. N., Le Gal R., McGuire B. A., Remijan A. J., Herbst E., 2019, ApJ, 881, 32
- Cassen & Moosman (1981) Cassen P., Moosman A., 1981, Icarus, 48, 353
- Cieza et al. (2016) Cieza L. A., et al., 2016, Nature, 535, 258
- Cleeves et al. (2017) Cleeves L. I., Bergin E. A., Öberg K. I., Andrews S., Wilner D., Loomis R., 2017, ApJ, 843, L3
- Dumouchel et al. (2010) Dumouchel F., Faure A., Lique F., 2010, MNRAS, 406, 2488
- Flower (1999) Flower D. R., 1999, MNRAS, 305, 651
- Frank et al. (2014) Frank A., et al., 2014, in Beuther H., Klessen R. S., Dullemond C. P., Henning T., eds, Protostars and Planets VI. p. 451 (arXiv:1402.3553), doi:10.2458/azu_uapress_9780816531240-ch020
- Hartmann & Kenyon (1996) Hartmann L., Kenyon S. J., 1996, ARA&A, 34, 207
- Hsieh (2019) Hsieh T.-H., 2019, in ALMA2019: Science Results and Cross-Facility Synergies. p. 59, doi:10.5281/zenodo.3585284
- Hubbard (2017) Hubbard A., 2017, ApJ, 840, L5
- Jørgensen et al. (2004) Jørgensen J. K., Hogerheijde M. R., Blake G. A., van Dishoeck E. F., Mundy L. G., Schöier F. L., 2004, A&A, 415, 1021
- Jørgensen et al. (2013) Jørgensen J. K., et al., 2013, ApJ, 779, L22
- Kennedy & Kenyon (2008) Kennedy G. M., Kenyon S. J., 2008, ApJ, 673, 502
- Kepley et al. (2020) Kepley A. A., Tsutsumi T., Brogan C. L., Indebetouw R., Yoon I., Mason B., Donovan Meyer J., 2020, PASP, 132, 024505
- Koda et al. (2019) Koda J., Teuben P., Sawada T., Plunkett A., Fomalont E., 2019, PASP, 131, 054505
- Krolik & Kallman (1983) Krolik J. H., Kallman T. R., 1983, ApJ, 267, 610
- Kuhn & Hillenbrand (2019) Kuhn M. A., Hillenbrand L. A., 2019, ApJ, 883, 117
- Lee et al. (2019) Lee J.-E., et al., 2019, Nature Astronomy, 3, 314
- Leemker et al. (2021) Leemker M., van’t Hoff M. L. R., Trapman L., van Gelder M. L., Hogerheijde M. R., Ruíz-Rodríguez D., van Dishoeck E. F., 2021, A&A, 646, A3
- Loomis et al. (2015) Loomis R. A., Cleeves L. I., Öberg K. I., Guzman V. V., Andrews S. M., 2015, ApJ, 809, L25
- Menten et al. (2007) Menten K. M., Reid M. J., Forbrich J., Brunthaler A., 2007, A&A, 474, 515
- Mikami et al. (1992) Mikami H., Umemoto T., Yamamoto S., Saito S., 1992, ApJ, 392, L87
- Molyarova et al. (2018) Molyarova T., Akimkin V., Semenov D., Ábrahám P., Henning T., Kóspál Á., Vorobyov E., Wiebe D., 2018, ApJ, 866, 46
- Morbidelli et al. (2015) Morbidelli A., Lambrechts M., Jacobson S., Bitsch B., 2015, Icarus, 258, 418
- Pinte et al. (2016) Pinte C., Dent W. R. F., Ménard F., Hales A., Hill T., Cortes P., de Gregorio-Monsalvo I., 2016, ApJ, 816, 25
- Principe et al. (2018) Principe D. A., et al., 2018, MNRAS, 473, 879
- Rab et al. (2017) Rab C., et al., 2017, A&A, 604, A15
- Raymond et al. (2007) Raymond S. N., Quinn T., Lunine J. I., 2007, Astrobiology, 7, 66
- Ruíz-Rodríguez et al. (2017a) Ruíz-Rodríguez D., et al., 2017a, MNRAS, 466, 3519
- Ruíz-Rodríguez et al. (2017b) Ruíz-Rodríguez D., Cieza L. A., Williams J. P., Principe D., Tobin J. J., Zhu Z., Zurlo A., 2017b, MNRAS, 468, 3266
- Ruíz-Rodríguez et al. (2020) Ruíz-Rodríguez D., Kastner J. H., Hily-Blant P., Forveille T., 2020, arXiv e-prints, p. arXiv:2012.10466
- Schilke et al. (1997) Schilke P., Walmsley C. M., Pineau des Forets G., Flower D. R., 1997, A&A, 321, 293
- Schöier et al. (2005) Schöier F. L., van der Tak F. F. S., van Dishoeck E. F., Black J. H., 2005, A&A, 432, 369
- Schoonenberg et al. (2017) Schoonenberg D., Okuzumi S., Ormel C. W., 2017, A&A, 605, L2
- Shu (1977) Shu F. H., 1977, ApJ, 214, 488
- Strom & Strom (1993) Strom K. M., Strom S. E., 1993, ApJ, 412, L63
- Tafalla (2013) Tafalla M., 2013, in Kawabe R., Kuno N., Yamamoto S., eds, Astronomical Society of the Pacific Conference Series Vol. 476, New Trends in Radio Astronomy in the ALMA Era: The 30th Anniversary of Nobeyama Radio Observatory. p. 177
- Terebey et al. (1984) Terebey S., Shu F. H., Cassen P., 1984, ApJ, 286, 529
- Tobin et al. (2012) Tobin J. J., Hartmann L., Bergin E., Chiang H.-F., Looney L. W., Chandler C. J., Maret S., Heitsch F., 2012, ApJ, 748, 16
- Tychoniec et al. (2020) Tychoniec Ł., et al., 2020, A&A, 640, A19
- Ulrich (1976) Ulrich R. K., 1976, ApJ, 210, 377
- Van Dishoeck & Blake (1998) Van Dishoeck E. F., Blake G. A., 1998, ARA&A, 36, 317
- Van der Tak et al. (2020) Van der Tak F. F. S., Lique F., Faure A., Black J. H., van Dishoeck E. F., 2020, Atoms, 8, 15
- Van ’t Hoff et al. (2018) Van ’t Hoff M. L. R., Tobin J. J., Trapman L., Harsono D., Sheehan P. D., Fischer W. J., Megeath S. T., van Dishoeck E. F., 2018, ApJ, 864, L23
- Van ’t Hoff et al. (2021) Van ’t Hoff M. L. R., et al., 2021, arXiv e-prints, p. arXiv:2110.08286
- Walsh et al. (2010) Walsh C., Millar T. J., Nomura H., 2010, ApJ, 722, 1607
- Walsh et al. (2014) Walsh C., Herbst E., Nomura H., Millar T. J., Weaver S. W., 2014, Faraday Discussions, 168, 389
- Weaver et al. (2018) Weaver E., Isella A., Boehler Y., 2018, ApJ, 853, 113
- Willacy (2007) Willacy K., 2007, ApJ, 660, 441
- Yen et al. (2016) Yen H.-W., Koch P. M., Liu H. B., Puspitaningrum E., Hirano N., Lee C.-F., Takakuwa S., 2016, ApJ, 832, 204
Appendix A Combining Arrays
In this appendix, we present an example of the generated products after combining the ALMA 12-m, 7-m, and TP data. To do so, we have followed two sources: (1) the Casa guide999https://casaguides.nrao.edu/index.php/M100-Band3-Combine-4.3 on the combination of ALMA 12-m, 7-m, and TP data with the (2) Total Power Map to Visibilities101010https://github.com/tp2vis/distribute (TP2VIS) method (Koda et al., 2019).
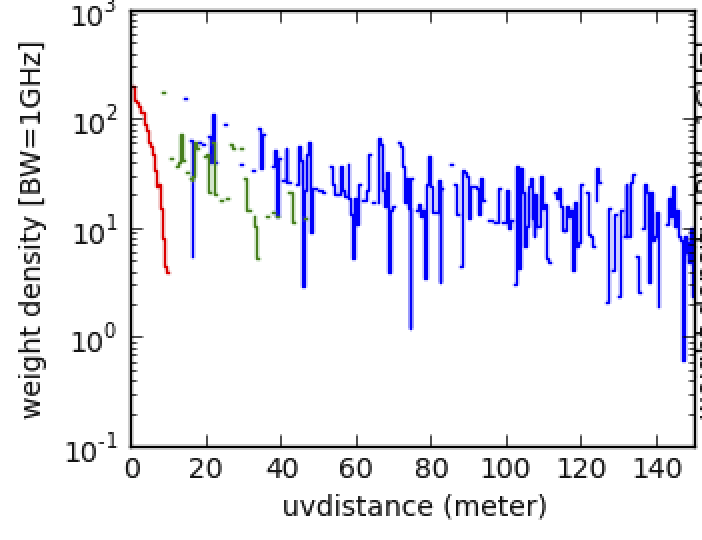
Initially, we run the Tp2vis function with three inputs: RMS, a mosaic pointing list, and the parameter nvgrp, which controls the number of visibilities generated. For that matter, we derive the RMS noise of the TP map for each line using the IMSTAT task in CASA. We also adopt the set of the mosaic pointing coordinates of the 12-m data around which the TP visibilities are generated, and a value of 10 for nvgrp. Thus, the Tp2vis function sets the weights so that their sum represents the RMS noise of the original TP map. This process creates a MS of the TP data. To visualize and evaluate the relative weights among TP, 7-m, and 12-m visibilities, we use the Tp2vispl function. Figure 10 displays the weight density of the configurations, which appear to transition smoothly from TP to 7-m, and to 12-m. After the calibrated TP cube is converted into visibilities, and subtracting the continuum emission from the 7-m and 12-m data, we concatenate TP, 7-m, and 12-m MS with the CONCAT task to generate a single MS. We then run the TCLEAN task and obtain clean maps. For our purposes, we only present HCO+ v=0 3-2 emission as a representative case of the line imaging process carried out in this paper combing the TP, 7-m, and 12-m data. Figure 11 compares the generated clean maps with Briggs value of 0.5 of the 12-m data alone, 12-m + 7-m data and combining TP7-m12-m data. To that end, we have integrated HCO+ emission in the range from 1.6 to 7.0 km s-1 to create the zeroth-moment maps. From these clean maps, it is evident that negative and noisier sidelobes are present in the moment-0 maps without TP data, while they are absent in the moment-0 map with TP data with a higher flux density level. Table 6 shows the missing flux of each array relative to the total flux measured by the TP array observations in the area of the TP beam size of 24" at the field center. As expected, the flux recovered by the combination of TP7-m12-m data is more evident at large scales because the uv space is better filled with the TP data recovering the more extended emission.
| Missing Flux | |||
| Line | 12-m | 7-m | |
| ALMA Cycle 5 | |||
| DCNa v=0 J=3-2 | 10 | 2 | |
| H2CO 3(2,1)-2(2,0) | 94 | 85 | |
| SO 3 v=0 6(5)-5(4) | 72 | 55 | |
| ALMA Cycle 6 | |||
| CH3OHa v t=0 4(3,1)-4(2,2) | – | – | |
| HCN v=0 J=3-2 | 47 | 27 | |
| HCO+ v=0 3-2 | 91 | 75 | |
a No TP emission detected.


Appendix B Channel maps
The CH3OH, HCO+, HCN, DCN, H2CO, and SO channel maps are displayed in Figs. 12, 13, 14, 15, 16, and 17, respectively.


Appendix C Radial Profiles
| Line | Rest Freq. | Peak Flux | FWHMa | Beamwidth | Radial Extensionb | |
|---|---|---|---|---|---|---|
| Jy beam-1 km s-1 | [au] | [au] | [au] | |||
| 12CO | 230.559 | 0.32 | 655 | 128 | 320 20 | |
| 13CO | 220.398 | 0.28 | 715 | 138 | 350 40 | |
| C18O | 219.560 | 0.22 | 620 | 137 | 310 10 |
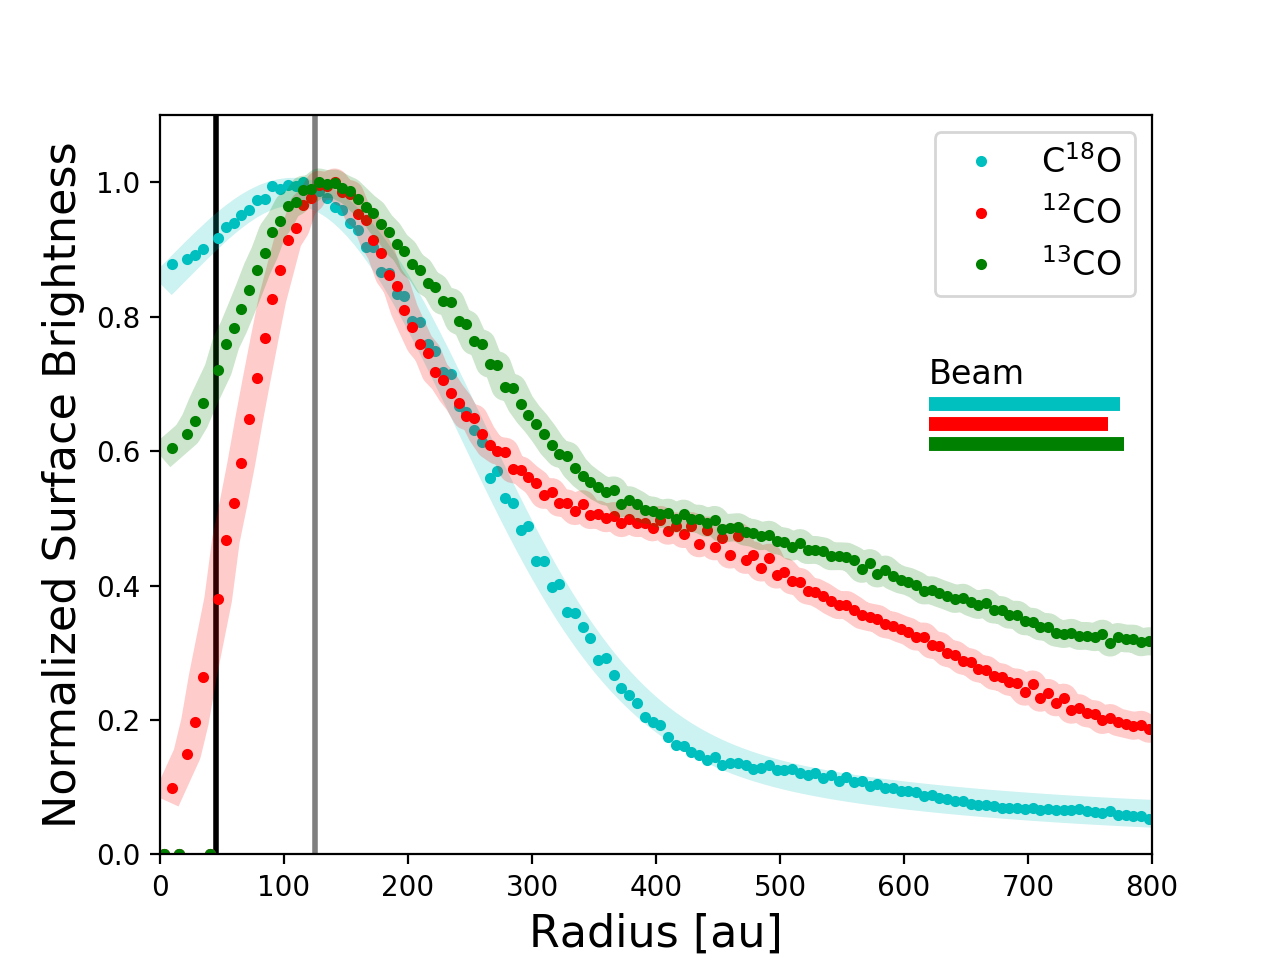
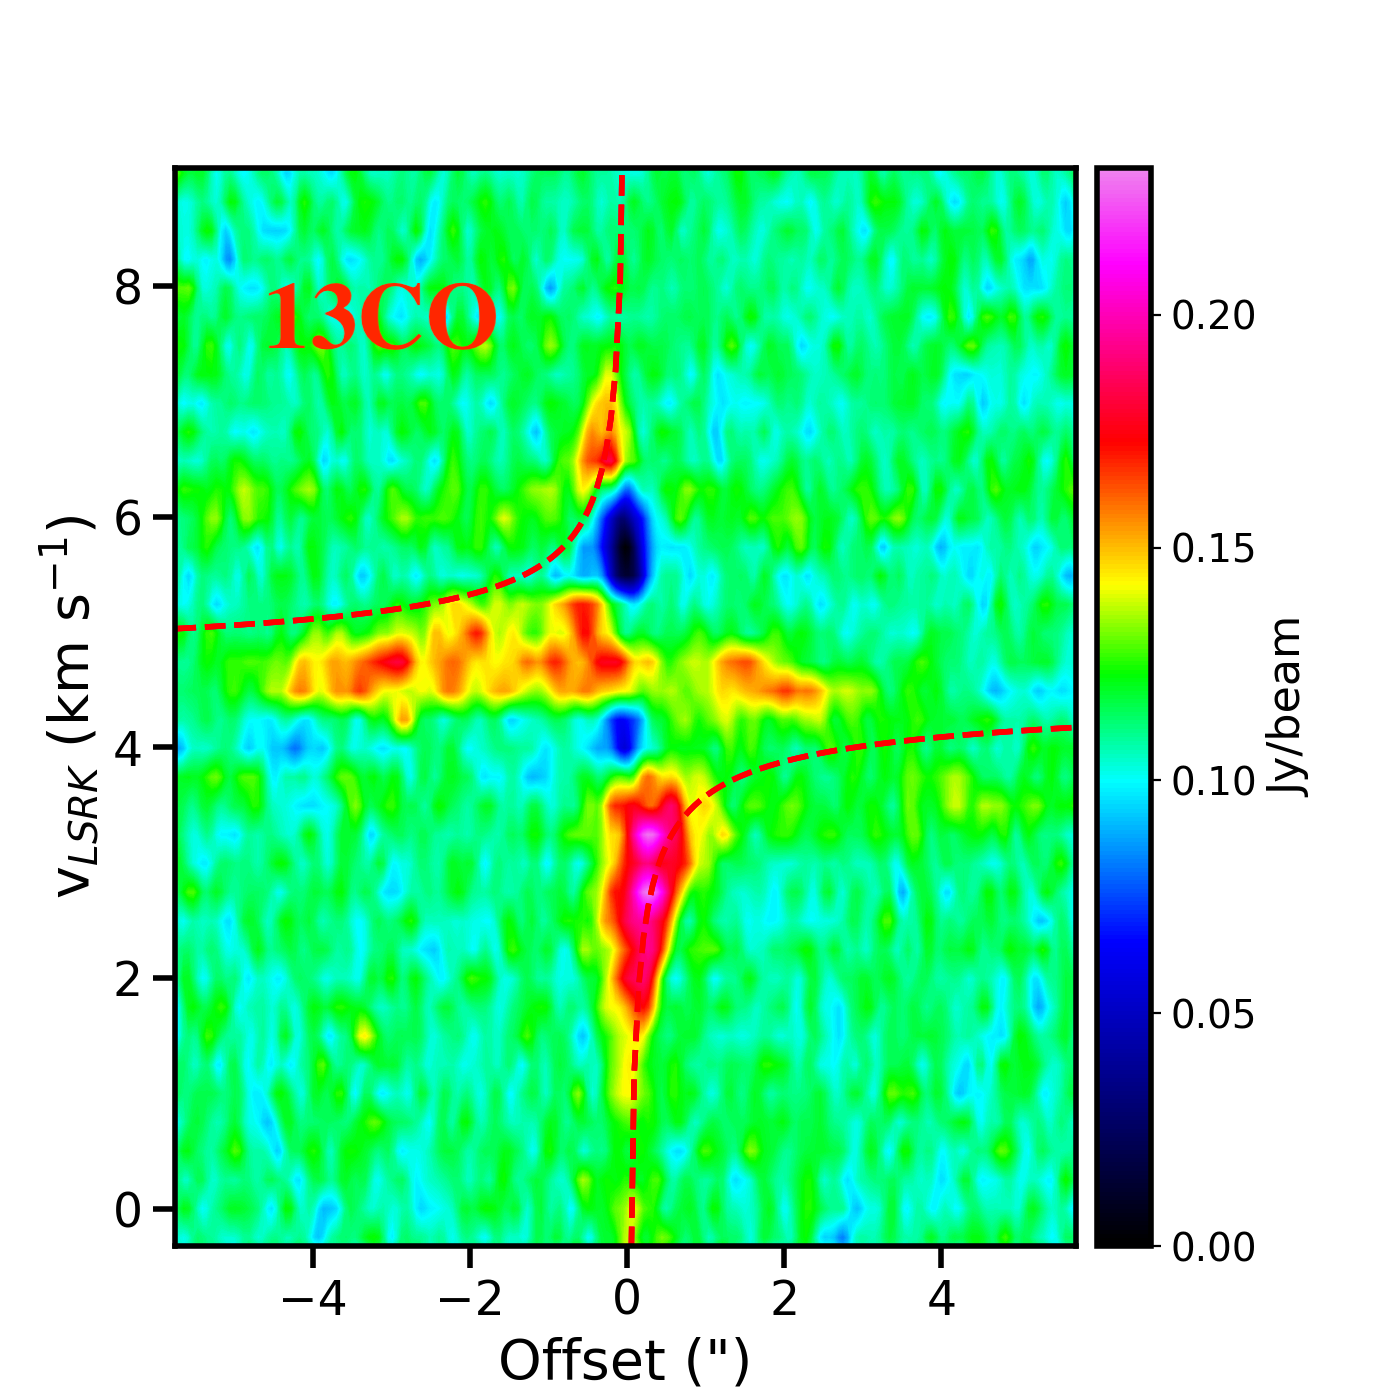
The chemical possible pathways taken place to generate the observed emission distribution were discussed in Section 4.2. To that end, we included the radial intensity profiles for 12CO, 13CO, and C18O calculated from the moment zero maps presented in (Ruíz-Rodríguez et al., 2017b). We followed the method described in Sec. 3 to characterize these molecule distributions (see Table 7), and using an inclination of 38 deg. for deprojecting and azimuthally averaging the radial profiles display in Figure 18. We have only considered the bulk of the 12CO, 13CO, and C18O emission at levels of 7. From these images, all molecule peaks are shifted further outward. At similar resolutions, these molecules peak at 130 au and appear depleted from the gas phase within the snow-line location and/or trace dust absorption. However, considering that the 12CO line emission is generally optically thick, and C18O is optically thin, it is likely depletion of CO gas throughout vertical layers with the largest depletion at the disc surface, as deduced from the 12CO radial profile, see Figure 18. In order to estimate the inner radial depression of 12CO, we have followed a similar approach as presented in Sec. 3.1 for the HCO+ original data. Thus, using 135 au and a 128, the inner depression is 120 au. In addition, Figure 19 displays the 12CO and 13CO moment zero maps, whose integration reveals each a pronounced inner depression or ‘’hole” with a size comparable to that estimated for the 230 GHz continuum by Cieza et al. (2016).
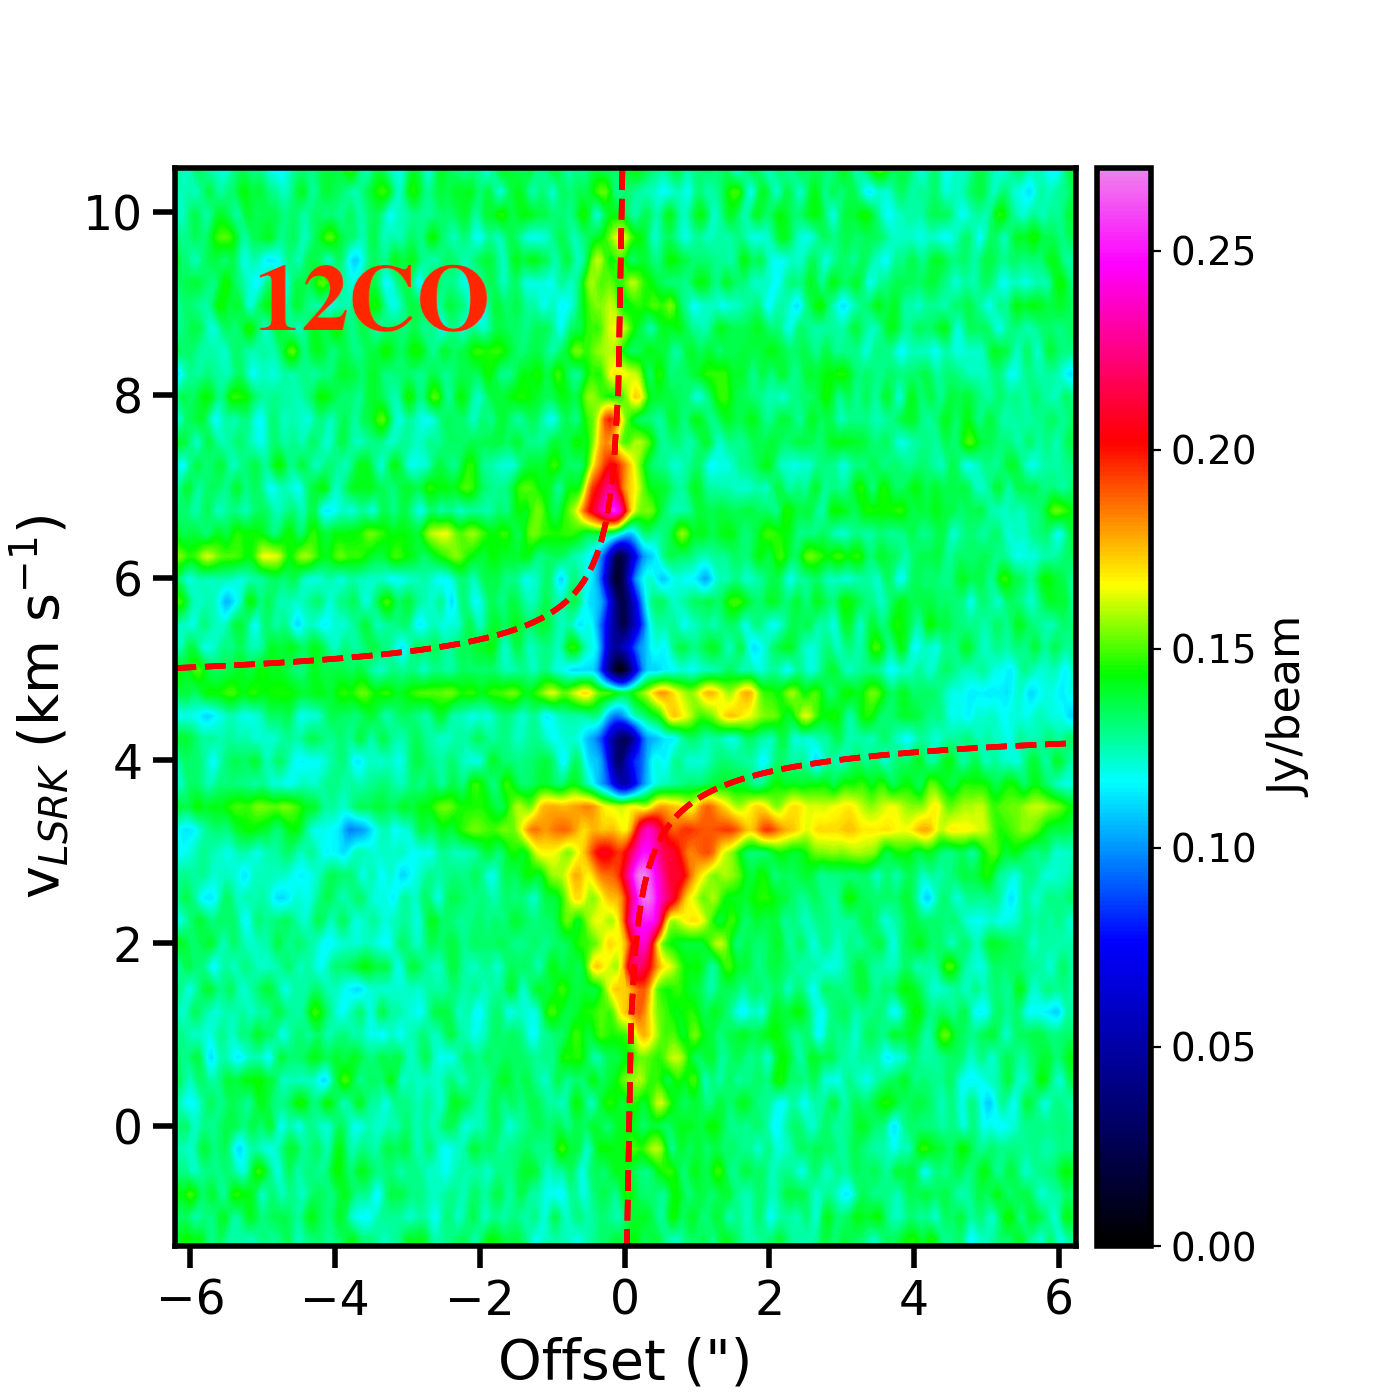
In addition, the 12CO, 13CO, and H13CO+ emission lines also present a typical Keplerian rotation and self-absorption emission around the central source. In Figures 20 and 21, we present PV diagrams along the disc major axis with P.A. of 30 deg. overlaid with curves representing Keplerian rotation in a geometrically thin disc with an inclination of 38 deg., a central mass of 1.3 M⊙ and systemic velocity of 4.5 km s-1, assuming a distance of 417 pc.


Appendix D Effects of subtracting optically thick lines and continuum emission.
In order to evaluate the amount of line emission removed by applying a flat continuum in the subtraction process of a very bright source as is the case of V883 Ori, we generated spectral line maximum and minimum peak intensity maps from HCO+ data cubes obtained with and without subtracting the continuum emission. Figure 22 displays the HCO+ peak emission calculated without subtracting the continuum emission (top -left panel) and after subtracting the continuum emission (top-right panel). Similarly, Fig. 23 displays the minimum intensity map without subtracting the continuum emission (top panel). In the maximum peak intensity map without subtracting the continuum, the emission significantly increases towards the center to account for the extra emission attributed to the strong continuum, while after subtracting the very bright continuum, emission is removed from the most inner disc region causing the false impression of a “hole”. The anti-correlation between the dust and HCO+ emission can be seen more clearly at the bottom panels of figure 22 showing the profiles extracted from the maximum peak intensity maps –with and without subtracting the continuum– along the disc keplerian rotation axis ( 30 deg; red lines drawn at the top-panels ). From these intensity profiles, it can be seen that the HCO+ emission, shown in blue lines, drops within a radius of 125 au, which corresponds to the dust continuum radial extension (Cieza et al., 2016). This reduction is the strongest at the center of the continuum, where the brightness intensity of the continuum is expected to be the highest. That is, HCO+ is absorbed by the optically thick continuum emission at the line frequency.
In this particular case, the minimum peak intensity maps serve to visualize the effects of applying a linear fit of the continuum based on the level measured in the line-free channel in a very bright source to subtract the dust continuum contribution. As expected for a very bright continuum emission, the minimum intensity map without subtracting the continuum emission probes the disc structure peaking at the center of the inner region. This outcome is particularly severe, as the dust in V883 Ori is much brighter due to high temperatures and densities in the inner disc. In addition, when the continuum is absorbed by foreground cold gas in the line of sight, this leads to overestimating the dust contribution and then underestimating the line emission, yielding negative flux values after the process of continuum subtraction. The profiles from the minimum peak intensity maps shown in Fig. 23b display the dust contribution (magenta line) and resulting negative flux values (blue line) after the process of continuum subtraction. Thus, the removal of line emission is maximized when both continuum and line emission are optically thick, absorbing each other, (Weaver et al., 2018) as is the case for V883 Ori.


