Generating Game Levels of Diverse Behaviour Engagement
Abstract
Recent years, there has been growing interests in experience-driven procedural level generation. Various metrics have been formulated to model player experience and help generate personalised levels. In this work, we question whether experience metrics can adapt to agents with different personas. We start by reviewing existing metrics for evaluating game levels. Then, focusing on platformer games, we design a framework integrating various agents and evaluation metrics. Experimental studies on Super Mario Bros. indicate that using the same evaluation metrics but agents with different personas can generate levels for particular persona. It implies that, for simple games, using a game-playing agent of specific player archetype as a level tester is probably all we need to generate levels of diverse behaviour engagement.
Index Terms:
Experience-driven procedural content generation, level generation, player experience, personalised levels, platformer gamesI Introduction
Procedural content generation (PCG), aiming at generating contents algorithmatically, has shown its effectiveness in generating various types of game contents [1, 2, 3, 4]. As the rapid development and applications of video games in different fields (e.g., serious games for autistic treatment) and expansion of player demography, game content tends to satisfy prospective players with different preference and experience [5]. More and more studies start to focus on experience-driven procedural content generation (EDPCG). To generate personalised contents, it is necessary to define evaluation metrics that can predict player experience on the evaluated contents. Basically, an evaluation metric can be seen as a function whose input is the gameplay data or content features that are controllable by game designers and its output is the quality of the content. This mapping is often mathematically formulated or learnt by machine learning models [6, 7]. For instance, Pedersen et al. [6] trained a model to predict several key affective states with a combination of gameplay features and controllable content features.
EDPCG can be applied to generate contents for general players or a particular player persona. EDPCG for general players exists in many forms of games, such as platformer games [8], dungeon games [9], puzzle games [10] and role playing games [11]. Besides, Some work categorised players into different groups according to the behaviour preference (personas) and try to generate content for specific groups[12, 13]. The common procedure of generating content for specific persona has two steps, identifying which profile the player belongs to, and then changing or adapting the generators correspondingly.
What if the same content evaluation metrics are used for different personas? There exists at least two advantages. (i) It is not necessary to design different content evaluation metrics for different personas. (ii) If the playing style changes, the generated content can also change since all the different playing styles share the same evaluation metrics. To our best knowledge, no work has ever considered general evaluation metrics for different player personas. Fernandes et al. [14] proposed a level generation approach to adapt to four rule-based persona agents over three different experience metrics respectively. However, the work [14] did not show the difference between the levels generated for different personas. This is important because it reflects whether the evaluation metrics can capture the preference of personas and affect the generation of levels.
Motivated by the above, two questions are raised in this work. How different the generated levels are if using the same evaluation metric but different evaluation agents? Furthermore, considering a level generated with a given evaluation agent, will a player that has similar persona to the evaluation agent gain more engagement compared with players that have another persona? In this paper, we attempt to answer the above questions with level generation and conduct case studies on Super Mario Bros. (SMB), a benchmark platformer game for procedural level generation.
The main contributions of this work are as follows111Code of this paper is available on Github: https://github.com/SUSTechGameAI/EngagementMetrics. First, existing metrics for evaluating game levels (not particularly for platformer game levels) are reviewed. Then, we propose a framework that is capable of generating levels of diverse behaviour engagement. The framework is implemented with three agents of different personas and four evaluation metrics considering the number, difficulty and diversity of events triggered by agents during game-playing. The aforementioned metrics and agents are integrated to the popular MarioGan [15] framework as fitness functions of an evolutionary algorithm which searches in the latent space of the level generator of MarioGan. Levels obtained with different combinations of evaluation metrics and agents are evaluated by their contents and gameplay data of different agents in order to verify their difference and whether they can adapt to agents used during level generation.
The rest of this paper is organised as follows. Section II reviews existing metrics for evaluating game levels. The motivation and design of our framework, details of an implementation of our framework for generating SMB levels, our evaluation metrics and agents are provided in Section III. Section IV presents the corresponding experimental studies and analysis. Section V concludes and discusses some future directions.
II Related Work
| Work | Evaluation factors | Whether categorize players/agents (Criterion) | Apply same evaluation metrics for different groups | Compare generated levels for different groups | ||
| content | gameplay | feedback | ||||
| [16] | - | - | - | |||
| [17] | - | - | - | |||
| [6] | - | - | - | |||
| [18] | - | - | - | |||
| [11] | - | - | - | - | ||
| [19] | - | - | - | - | - | |
| [10] | - | - | - | - | ||
| [8] | - | - | - | - | ||
| [13] | (Persona) | - | - | |||
| [12] | - | (Persona) | - | - | ||
| [20] | - | (Ability) | ||||
| [14] | - | - | (Persona) | - | ||
| Self | - | - | (Persona) | |||
Section II-A briefly reviews the related work in generating contents for different player (or agent) types. Focusing on game levels, Section II-B summarises and discusses what have been modelled in existing level evaluation metrics.
II-A Generating Levels for Different Player / Agent Types
Personalised level design has been comprehensively summarised in the survey of [21]. Here, research work that classifies players into several groups and generate levels are discussed. The classification approaches can be based on intuition or machine learning. The work of [12] categorised playing styles as Explorer, Enemy killer, Speed runner and the work of [14] defined four rule-based agent. Yu and Trawick [13] applied some clustering methods to categorise players and the naive Bayesian approach to identify playing styles. As shown in Table I, [12] and [13] applied different level evaluation metrics to different playing styles, while some work [20, 14] used the same evaluation metrics but different agents for simulating the game.
II-B Evaluating Levels
Table I also summarises the factors considered when designing a level evaluation metric in each related work, including the level content itself, game play data collected during the games played by players or agents and players’ feedback about their feelings.
The level evaluation metrics can be modelled by expert knowledge or machine learning methods. Most work considering players’ feedback trained a model that can predict “fun” degree of the levels based on the level content and (or) gameplay data [16, 17, 6, 13]. The work of [18] used the feedback of players during the game to adaptively change the challenge of the game. Although the work focusing on player modelling are not listed in Table I, they can also help level evaluation by imitating the decision making or players’ playing style [22, 23, 24, 25].
III Approach and Case study with SMB
In this work, we mainly consider the gameplay data collected during the games because we want to focus on whether the evaluation metrics can be sensitive to agents with different behaviour preference. We also expect to see if the generation of levels will change for different agents when only the gameplay data is used to evaluate levels.
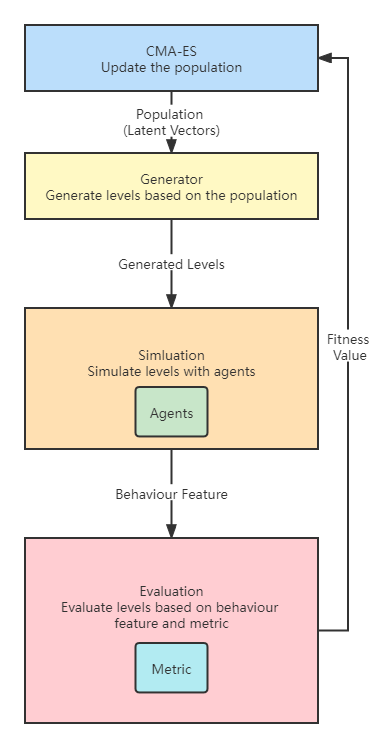
Our proposed framework is illustrated in Fig. 1. It is a general framework that can be extended to many games. Basically, it is a search-based approach with a generator to create new candidate levels, a simulator to generate gameplay data on the candidate levels and some evaluation metrics to evaluate the quality of the candidate levels based on the gameplay data.
Our framework is based on MarioGan [15], but differs from it as follows. In MarioGan [15], only one agent was used to simulate the generated levels and only the level completion rate and number of jumps by the agent are considered when evaluating levels. We extend it by considering various agents of different playing styles as level evaluation agents. Besides the original evaluation metrics, new metrics are designed considering more gameplay data, including the event number, event distribution and ability of agents.
III-A Agents of Different Personas
Inspired by the Bartle’s Taxonomy [26], which categorised players to Killer, Achiever, Explorer and Socializer, we design three different SMB agents: Runner, Killer and Collector. Despite of their common interest in passing the levels, their preference and reaction to different game mechanisms (such as coins and monsters) are different.
Runner, Killer and Collector agents are designed as variations of the winner agent in the 2009 Mario AI Competition [27]. Its ability of passing levels has been proved to be superior than human players. Different personas are implemented through the design of different heuristic function used for decision-making by each agent. The personas and corresponding agents are described as follows.
III-A1 Runner
Runner represents the players that try to complete a level as fast as possible. Speed run is a common way for players to break the game record and avoid monsters in many games. Its heuristic function punishes the actions that lead to states which cost longer time to finish, formulated as
| (1) |
where is the estimated time consumed by Mario to finish the level and is simply the elapsed time.
III-A2 Killer
Killer represents the players that prefer to kill all the monsters in a level. It represents an extreme case for players that enjoy stomping monsters. Its heuristic function rewards the actions that kill monsters, formulated as
| (2) |
where if Mario reaches the destination; if Mario falls or is killed by a monster; otherwise, . Introducing is to ensure the priority of completing levels since it is the common goal of all the players. is the ratio of monster killed by Mario and the total monsters.
III-A3 Collector
Collector represents the players that attempt to collect all the coins in a level. It represents achievers [26] who have fun when collecting all the props and earning additional reward in games. Its heuristic function rewards the actions that collect more coins:
| (3) |
where is the ratio of collected coins to the total number of coins.
III-B Design of Evaluation Metrics
Five different evaluation metrics are designed to evaluate the quality of levels by the agents’ gameplay features. Note that all the metrics are to be minimised in our work.
III-B1 Jump
The number of jumps is a common metrics used in SMB [15, 6] since jump is a basic operation for players. To be specific, we want to maximise the number of jumps of agents and formulate the following evaluation metric:
| (4) |
where is the fraction of levels that the agent completes. is to ensure that the level is playable. It is negative because we want to minimise the value.
III-B2 Event
Since jumping can be seen as an event during playing, we use the number of events as the metrics and want to study their difference for generating levels. Table II lists all the considered events. The corresponding metric is:
| (5) |
where is the number of events occurred.
| Event type | Description |
|---|---|
| Stomp | Stomp on and kill a monster |
| Fall | Monster falls |
| Jump | Jump up |
| Land | Land on the solid block |
| Collect | Collect a coin |
| Lose | Fall or be killed by a monster |
| Win | Complete the level |
III-B3 Fail rate
Fail rate is used to describe the danger during playing. As an agent, a search-based agent, is used, the ratio of the nodes searched by that cause a lose (denoted as ) to the total nodes searched by (denoted as ) can be calculated as . We want to maximise the fail rate of the agent in order to increase the difficulty degree of the levels, formulated as follows:
| (6) |
| Level | Agent | 1 | 2 | 3 | 4 | 5 | 6 | 7 | 8 | 9 | 10 | 11 | 12 | 13 | 14 | 15 | AVG |
|---|---|---|---|---|---|---|---|---|---|---|---|---|---|---|---|---|---|
| Completion | Runner | 1 | 1 | 0.53 | 1 | 1 | 0.41 | 1 | 1 | 1 | 0.53 | 1 | 0.37 | 1 | 1 | 0.11 | 0.79 |
| Killer | 1 | 1 | 0.71 | 0.93 | 1 | 0.41 | 1 | 0.87 | 1 | 0.57 | 1 | 1 | 0.35 | 1 | 0.93 | 0.85 | |
| Collector | 1 | 1 | 0.29 | 0.94 | 1 | 0.4 | 1 | 1 | 1 | 0.52 | 1 | 1 | 0.35 | 1 | 0.92 | 0.82 | |
| Monsters killed | Runner | 1 | 5 | 0 | 8 | 8 | 0 | 0 | 0 | 5 | 0 | 0 | 1 | 0 | 4 | 3.2 | 0.12 |
| Killer | 12.8 | 17 | 4.6 | 21.8 | 20.8 | 2 | 0 | 11.6 | 22 | 5 | 0 | 6.2 | 0 | 7 | 36 | 0.65 | |
| Collector | 4 | 10 | 1 | 11.8 | 9.8 | 0 | 0 | 3.2 | 5 | 2 | 0 | 1.4 | 0 | 5 | 11.6 | 0.24 | |
| Total | 15 | 18 | 6 | 26 | 28 | 6 | 12 | 12 | 31 | 6 | 15 | 8 | 0 | 10 | 50 | - | |
| Coins collected | Runner | 1 | 2 | 0 | 0 | 0 | 4 | 4 | 5 | 0 | 0 | 1 | 0 | 2 | 1 | 0 | 0.07 |
| Killer | 2.8 | 4 | 7 | 5.4 | 0 | 3 | 1.2 | 2.4 | 0 | 2.8 | 2 | 1 | 0 | 3 | 5.2 | 0.21 | |
| Collector | 13 | 12 | 4 | 13 | 4 | 8 | 20.6 | 22.8 | 0 | 8 | 14.4 | 3 | 7 | 3 | 14.2 | 0.54 | |
| Total | 21 | 23 | 23 | 21 | 8 | 22 | 35 | 27 | 0 | 23 | 16 | 3 | 24 | 5 | 17 | - | |
| Time | Runner | 9 | 8 | -1 | 12 | 10 | -1 | 12 | 10 | 10 | -1 | 13 | -1 | 8 | 8 | -1 | - |
| Killer | 12 | 11 | -1 | -1 | 15 | -1 | 13 | -1 | 14 | -1 | 10 | 25 | -1 | 10 | -1 | - | |
| Collector | 12 | 11 | -1 | -1 | 13 | -1 | 16 | 15 | 10 | -1 | 13 | 22 | -1 | 9 | -1 | - |
III-B4 Ability
We denote the basic three persona agents without any modification as perfect agents. A blind agent is defined as the agent that can only search positions half distance to the current position than a perfect agent. It means that the two agents own the same persona, but different abilities. We aim to generate levels with different skill-depth that require further planning and let the blind agent fail to complete. The metric is formulated as:
| (7) |
where and are the fractions of the level that the perfect agent and blind agent complete, respectively.
III-B5 Variance
Diversity of levels are regarded as an important factor to improve the engagement. We focus on the diversity of events triggered by an agent during playing. The event type is same in the Table II. We consider the coefficient of variance (CV) of the position of events, defined as the ratio of its standard deviation to its expectation:
| (8) |
if considering an event’s -coordinate value. We want to maximise the CV for both - and -coordinates of events in levels:
| (9) |
IV Experimental Study and Discussion
We first perform a preliminary experimental study to verify the behaviour preference of three agents on original SMB levels. Then, SMB levels are generated by searching in the latent spaces of a GAN generator with different evaluation metrics (cf. Section III-B) as the fitness function and different evaluation agents (cf. Section III-A) for simulation. After level generation, all the levels are evaluated with various metrics based on their contents. Results of simulation-based tests by different playing agents are also reported.
IV-A Validation of Agents
To verify if the designed agents (Runner, Killer and Collector) act differently when they play the same levels, they are tested on the 15 original SMB levels. The time limit for the agent to determine an action is 200ms. We record the fraction of the level that was completed, the number of kills and times of collecting in each level. Every agent played each level 5 times because an agent’s behaviour may vary when playing the same level twice.
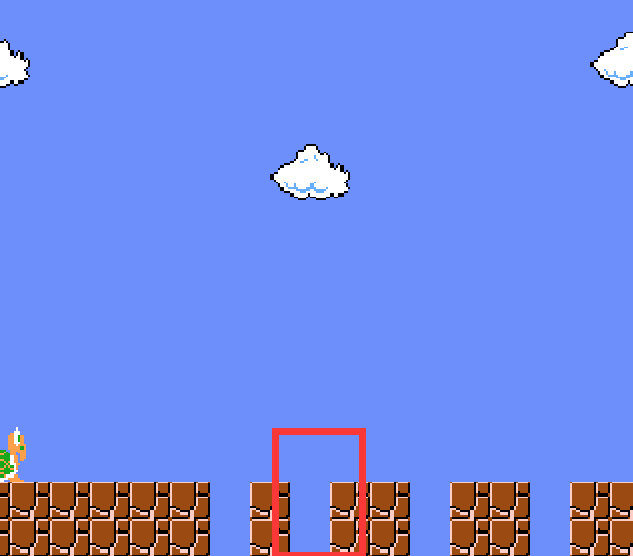
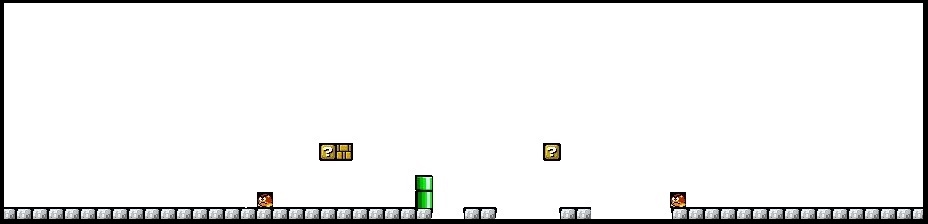
Table III shows the ratio of completion, monsters killed, coins collected and completion time of the three agents. Comparing the ratio of completion, three agents show the similar ability to complete the levels. Runner may pursue speed too much and choose a dangerous way in some levels, which leads to a low ratio of completion. As shown in Fig. 2, Runner lands on the edge of the block and fails to jump again, while Killer and Collector choose a safer policy and successfully jump over these gaps. Table III also shows the significantly different preference of agents. In all the 15 levels, Killer kills the most monsters, Collector collects the most coins and Runner finishes the levels with the minimum time. It proves that these agents have different behaviour preference when playing same levels.
IV-B Generating Levels of Different Behaviour Engagement
With five evaluation metrics and three agents of different persona, we generate levels for each evaluation metric and for each agent. Hence, there are 15 groups of levels in total. Each group contains 30 level segments after evolving the latent vector with CMA-ES. The parameter setting of CMA-ES is same as in [15]. The evaluation budget is 1,000, but 2,000 for metric Ability because every evaluation requires two game simulations (i.e., one game each by the perfect and blind agents). The game engine used is the Mario AI framework222https://github.com/amidos2006/Mario-AI-Framework.
To answer the two research questions, two sets of level tests are performed to compare the generated levels based on their content and gameplay data of different persona agents.
IV-B1 How different the generated levels are if using the same evaluation metric but different evaluation agent
In order to test whether the levels generated with different agents have different features, we evaluate the generated levels on their contents. Table IV shows the analysis on the generated levels. Each level is evaluated with the number of monsters, number of coins, number of gaps and the maximum width of gaps as those contents are the core elements in a SMB level.
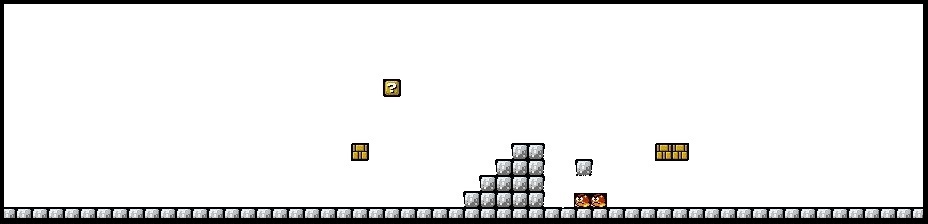
Comparing the levels generated using different evaluation metrics and a same evaluation agent, as illustrated in Table IV, it implies that game contents can be evolved in two ways: increasing element numbers and increasing difficulty. For instance, considering Collector as the evaluation agent, Jump and Event metrics show the number of coins in the levels are significantly higher than the ones obtained using other evaluation agents. However, in other metrics, the number of coins shows no increase and sometimes lower than the ones obtained with other evaluation agents. But the number of gaps and max width of gaps in Fail rate and Ability are greater than that in Jump and Event. It indicates that Jump and Event metrics tend to evolve content in the first way, while Fail rate and Ability metrics tend to evolve content in the second way. Fig. 3 shows this difference. Both two way of evolution can improve the engagement of Collector and they are captured by different evaluation metrics.
Comparing Jump and Event metrics, it is interesting that the number of monsters increases significantly for Killer. It indicates that the meaning of action (e.g., jump) is sometimes vague and may not guide the evolution as expected. For example, the purpose of jump can be killing monsters, dodging monsters, crossing gaps or even nothing. So this result shows that combining the action with game events can understand the player’s behaviour purpose better.
IV-B2 Considering a level generated with an evaluation agent, will a player that has similar persona gain more engagement compared with players that have another personas
To study whether the generated levels can improve the behaviour engagement for particular personas, we test all the 15 groups of levels with three agents. Tables V(a) to V(e) show the results of agents playing the 15 groups of levels. Reading guidelines are given in the table captions.
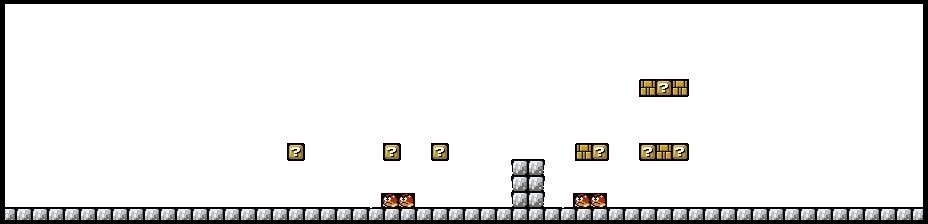
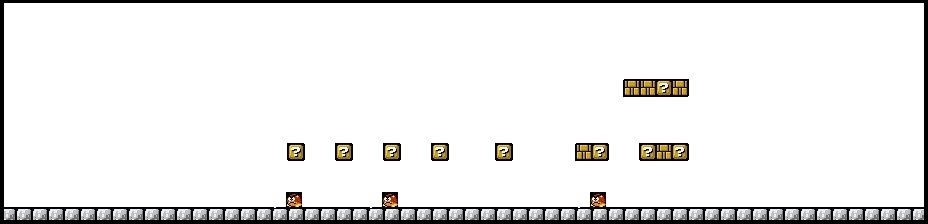
Considering Event and Jump, if fix the test agents, the test value like jump and number of events will be significantly higher when the test agent and the evaluation agent are the same. If fixing the evaluation agent and compare different test agents, more events are also triggered when the test agent and evaluation agent are the same. It indicates the generated levels have particular behaviour engagement indeed. For instance, Fig. 4 illustrates a level generated using the Event metric and Collector as its evaluation agent. This level tends to attract Collector to jump and collect coins, triggering more events. But for Runner and Killer, the presence of coins doesn’t increase the appeal.
Fail rate and Ability metrics also can generate levels for specific persona. For Collector as the evaluation agent, when test agent is Collector, the completion time, jump, event type, number of events are all higher than the ones obtained by other test agents. When Killer is used as the evaluation agent, the Fail rate is higher when the test agent is also Killer. This indicates that Fail rate and Ability can evolve levels that can be harder for specific persona, e.g., a coin hard to get or a monster hard to kill. It is consistent with the levels shown in Fig. 3.
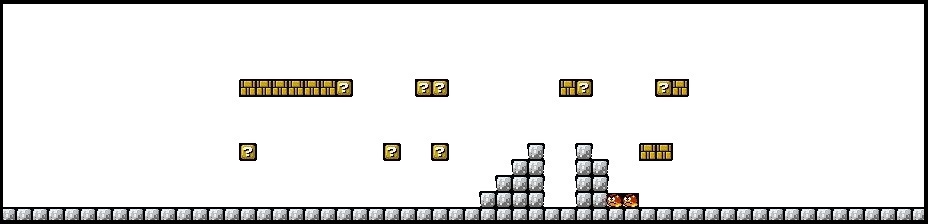
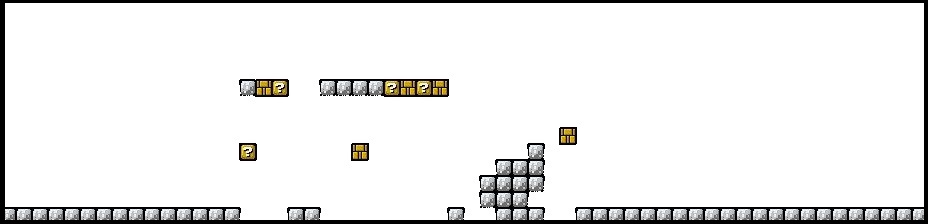
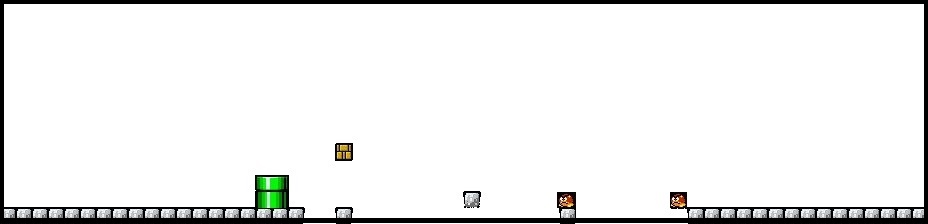
However, when fixing the test agent and considering different evaluation agents, both Collector and Killer have much larger Fail rate when Runner is the evaluation agent, compared with the corresponding evaluation agent. This indicates that levels generated with Runner as its evaluation agent can be also very challenging for Collector and Killer. From Table IV, the Max width of gaps in FailRate-runner and Ability-runner is significantly higher. Fig. 5 shows a level generated using the Fail rate and Runner. The agent needs to rely on several landing points to skip large interval segments. This level is very difficult for all the agents. Runner and Collector have 4.61% and 5.47% failure rates in this level. Killer cannot even complete the level with Fail rate 27.01%.
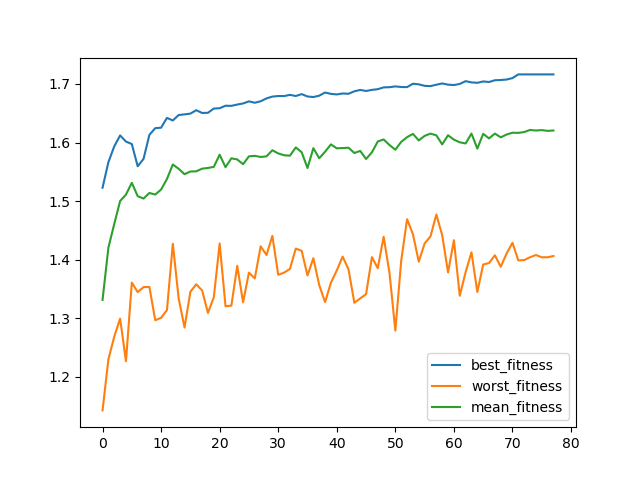
For Variance, the pattern is not clear and no obvious preference observed from the results. A possible reason is that Variance considers all the types of content together, while in many cases multiple events happen closely, such like jump and collect. Some meaningless event should also be excluded during evaluation. There is an extreme fail case for Variance. There is nothing but ground in the level, while Collector will jump time to time and increase the Variance on x-axis. Fig. 6 shows the premature convergence of fitness.
| Metric-Agent | Avg #monsters | Std #monsters | Avg #coins | Std #coins | Avg #gap | Std #gap | Avg max width | Std max width |
|---|---|---|---|---|---|---|---|---|
| Jump-Runner | 1.97 | 1.11 | 0.5 | 1.26 | 0.7 | 1.49 | 1.47 | 4.03 |
| Jump-Killer | 1.77 | 1.26 | 1.2 | 1.89 | 0.83 | 1.61 | 1.13 | 2.28 |
| Jump-Collector | 2.43 | 1.54 | 4.63+ | 2.9 | 0.73 | 1.12 | 1.23 | 2.01 |
| Fail rate-Runner | 3 | 1.86 | 1.67 | 1.66 | 1.13 | 1.26 | 6.07 | 7.42 |
| Fail rate-Killer | 3.03 | 2.81 | 1.67 | 1.83 | 2.27+ | 1.88 | 4.37 | 3.84 |
| Fail rate-Collector | 3.2 | 3.25 | 2.5 | 2 | 1.97 | 1.94 | 3.67 | 4.26 |
| Ability-Runner | 0.93 | 1.06 | 0.7 | 1.22 | 2.83 | 1.04 | 8.8 | 4.55 |
| Ability-Killer | 0.87 | 1.06 | 1.53+ | 1.67 | 2.77 | 1.17 | 5.67- | 3.03 |
| Ability-Collector | 1.1 | 1.22 | 1.2 | 1.62 | 2.33 | 1.25 | 5.3- | 4.27 |
| Variance-Runner | 2.17 | 1.16 | 2.13 | 2.46 | 0.53 | 0.99 | 1.83 | 4.45 |
| Variance-Killer | 1.87 | 0.72 | 1.77 | 1.28 | 0.83 | 1.24 | 1.17 | 1.93 |
| Variance-Collector | 1.5- | 0.92 | 1.03 | 0.84 | 0.03 | 0.18 | 0.07 | 0.36 |
| Event-Runner | 2.87 | 1.5 | 2.37 | 2.6 | 0.53 | 0.96 | 1.6 | 3.94 |
| Event-Killer | 4.23+ | 1.71 | 2.93 | 2.74 | 0.5 | 1.15 | 0.67 | 1.62 |
| Event-Collector | 2.53 | 1.73 | 5.67+ | 2.91 | 0.3 | 0.94 | 0.37 | 0.95 |
| Gameplay agent | Kill rate | Collect rate | Fail rate | Time | #Jump | Event type | Event num | Complete | |
|---|---|---|---|---|---|---|---|---|---|
| During generation | During test | ||||||||
| Collector | Collector | 0.27 | 0.78 | 1.29 | 3.83 | 8.47 | 4.43 | 21.47 | 1 |
| Runner | Collector | 0.32 | 0.07- | 2.11 | 4.8 | 6.1- | 3.73- | 13.1- | 0.95 |
| Killer | Collector | 0.3 | 0.25- | 1.03 | 3.2- | 5.97- | 3.87- | 13.27- | 1 |
| Collector | Runner | 0.07 | 0.09+ | 0.12 | 2.3- | 2.77- | 3.57+ | 7.2- | 1 |
| Runner | Runner | 0.01 | 0.01 | 0.58 | 3.4 | 6.37 | 3.07 | 13.8 | 1 |
| Killer | Runner | 0.07 | 0.03 | 0.14 | 2.5- | 3.67- | 3.17 | 8.53- | 1 |
| Collector | Killer | 0.88 | 0.11 | 0.93 | 3.07 | 4.23- | 4.43+ | 11.5- | 1 |
| Runner | Killer | 0.77 | 0 | 4.82 | 3.03 | 5.03 | 3.67 | 11.87 | 0.93 |
| Killer | Killer | 0.7 | 0.07 | 1.03 | 4.2 | 8.3 | 3.87 | 18.37 | 0.99 |
| Gameplay agent | Kill rate | Collect rate | Fail rate | Time | #Jump | Event type | Event num | Complete | |
|---|---|---|---|---|---|---|---|---|---|
| During generation | During test | ||||||||
| Collector | Collector | 0.46 | 0.86 | 0.64 | 5.6 | 8.47 | 4.6 | 23.17 | 0.98 |
| Runner | Collector | 0.47 | 0.57 | 2.18 | 3.07- | 5.67- | 4.47 | 14.33- | 0.98 |
| Killer | Collector | 0.31 | 0.55- | 0.87 | 5- | 6.6- | 4.37 | 16.2- | 0.98 |
| Collector | Runner | 0.07 | 0.17 | 0.11 | 2.2- | 2.77- | 3.77 | 7.83- | 1 |
| Runner | Runner | 0.16 | 0.34 | 0.54 | 2.9 | 5.23 | 4.07 | 13 | 1 |
| Killer | Runner | 0.13 | 0.09- | 0.15 | 2.43- | 3.2- | 3.73 | 8.5- | 1 |
| Collector | Killer | 0.84 | 0.2 | 1.42 | 2.97- | 3.9- | 4.53 | 11.33- | 0.98 |
| Runner | Killer | 0.8 | 0.24 | 2.55 | 2.93- | 4.8 | 4.4- | 12.87- | 0.97 |
| Killer | Killer | 0.92 | 0.25 | 0.72 | 3.93 | 6.27 | 4.63 | 17.63 | 1 |
| Gameplay agent | Kill rate | Collect rate | Fail rate | Time | #Jump | Event type | Event num | Complete | |
|---|---|---|---|---|---|---|---|---|---|
| During generation | During test | ||||||||
| Collector | Collector | 0.16 | 0.41 | 6.87 | 4.9 | 8.23 | 4.1 | 18.73 | 0.93 |
| Runner | Collector | 0.26 | 0.54 | 14.33+ | 3.33- | 4.5- | 4.1 | 11.2- | 0.84 |
| Killer | Collector | 0.19 | 0.38 | 7.95 | 3.67- | 5.17- | 3.93 | 12.03- | 0.93 |
| Collector | Runner | 0.08 | 0.06 | 2.14 | 2.27 | 2.87 | 3.43 | 7.37 | 0.98 |
| Runner | Runner | 0.16 | 0.08 | 7.37 | 2.33 | 3.13 | 3.53 | 7.97 | 0.93 |
| Killer | Runner | 0.06 | 0.01 | 0.46- | 2.27 | 2.9 | 3.27 | 7.2 | 1 |
| Collector | Killer | 0.44 | 0.08 | 8.36 | 2.93 | 3.93 | 3.77 | 10.57 | 0.92 |
| Runner | Killer | 0.74 | 0.23+ | 13.19+ | 2.57 | 3.33 | 4.23+ | 9.87 | 0.84 |
| Killer | Killer | 0.48 | 0.06 | 9.26 | 2.8 | 3.77 | 3.67 | 9.8 | 0.91 |
| Gameplay agent | Kill rate | Collect rate | Fail rate | Time | #Jump | Event type | Event num | Complete | |
|---|---|---|---|---|---|---|---|---|---|
| During generation | During test | ||||||||
| Collector | Collector | 0.1 | 0.38 | 2.97 | 2.53 | 4.6 | 3.6 | 10.07 | 0.98 |
| Runner | Collector | 0.06 | 0.18 | 12.7+ | 2.37 | 3.97 | 3.33 | 8.33 | 0.89 |
| Killer | Collector | 0.12 | 0.3 | 4.5 | 2.47 | 4.2 | 3.6 | 9.13 | 0.97 |
| Collector | Runner | 0.07 | 0.03 | 0.23- | 2.13 | 2.6 | 3.2 | 6.4 | 1 |
| Runner | Runner | 0.04 | 0 | 0.58 | 2.2 | 2.83 | 3.1 | 6.77 | 1 |
| Killer | Runner | 0.04 | 0 | 1.58 | 2.07 | 2.3- | 3.07 | 5.63- | 0.98- |
| Collector | Killer | 0.32 | 0.04 | 5.41 | 2.47 | 3.87 | 3.43 | 8.47 | 0.97 |
| Runner | Killer | 0.28 | 0 | 15.57+ | 2.2 | 3.43 | 3.3 | 7.27 | 0.84- |
| Killer | Killer | 0.35 | 0.01 | 5.33 | 2.43 | 3.43 | 3.4 | 7.43 | 0.97 |
| Gameplay agent | Kill rate | Collect rate | Fail rate | Time | #Jump | Event type | Event num | Complete | |
|---|---|---|---|---|---|---|---|---|---|
| During generation | During test | ||||||||
| Collector | Collector | 0.45 | 0.56 | 0.13 | 2.47 | 3.7 | 4.37 | 8.83 | 1 |
| Runner | Collector | 0.45 | 0.46 | 3.84+ | 2.9+ | 5.2+ | 4.13+ | 13.2 | 0.97 |
| Killer | Collector | 0.15- | 0.66 | 1.01+ | 4.5 | 4.4+ | 3.9- | 10.43+ | 0.96 |
| Collector | Runner | 0.14 | 0.1 | 0.05 | 2.1- | 1.83- | 3.27 | 5.07 | 1 |
| Runner | Runner | 0.09 | 0 | 0.63 | 2.4 | 2.7 | 3.17 | 6.63 | 1 |
| Killer | Runner | 0 | 0 | 0.06 | 2.13 | 2- | 3 | 5- | 1 |
| Collector | Killer | 0.81 | 0.35+ | 0.09- | 2.8 | 3.13 | 4.23 | 8.17 | 1 |
| Runner | Killer | 0.8 | 0.13 | 2.75 | 2.9+ | 3.77+ | 4.13 | 10.1+ | 0.97 |
| Killer | Killer | 0.94 | 0.04 | 0.35 | 2.57 | 2.67 | 4.07 | 7.13 | 1 |
V Conclusion & Future work
In this paper, we first analyse the metrics for evaluating game levels. Then, this work uses evaluation metrics that have no preference bias and designed agents with different personas to investigate whether the levels generated with different simulation agent can have different behaviour engagement. Experimental results on a platformer game show that our framework can adapt to different personas and generate levels for them specifically via changing the behaviour preference of evaluation agents. The work may guide game designers and researchers to study further on combining these different evaluation metrics to generate levels with more possibilities (e.g., dynamically changing the engagement for general players or particularly for players of a certain persona).
In this work, we assume that higher number (difficulty, diversity) of triggered events represents more engagement of players. A more reasonable way is to keep them within a range, neither too boring nor too diverse. One important future work is conducting human test to further verify whether those generated levels have different behaviours engagement. The evaluation agents can also be a combination of personas (e.g., combining Collector and Killer) or a machine learning based agent to imitate players better. It is also interesting to test our system on other game genres.
Acknowledgement
The authors would like to thank the anonymous reviewers for their valuable comments.
References
- [1] J. Togelius, A. J. Champandard, P. L. Lanzi, M. Mateas, A. Paiva, M. Preuss, and K. O. Stanley, “Procedural content generation: Goals, challenges and actionable steps,” in Artificial and Computational Intelligence in Games, vol. 6, 2013, pp. 61–75.
- [2] A. Summerville, S. Snodgrass, M. Guzdial, C. Holmgård, A. K. Hoover, A. Isaksen, A. Nealen, and J. Togelius, “Procedural content generation via machine learning (pcgml),” IEEE Transactions on Games, vol. 10, no. 3, pp. 257–270, 2018.
- [3] S. Risi and J. Togelius, “Increasing generality in machine learning through procedural content generation,” Nature Machine Intelligence, vol. 2, pp. 428–436, 2020.
- [4] J. Liu, A. Khalifa, Snodgrass, S. Risi, G. N. Yannakakis, and J. T. Togelius, “Deep learning for procedural content generation,” Neural Computing and Applications volume, vol. 33, pp. 19–37, 2021.
- [5] G. N. Yannakakis and J. Togelius, “Experience-driven procedural content generation,” IEEE Transactions on Affective Computing, vol. 2, no. 3, pp. 147–161, 2011.
- [6] C. Pedersen, J. Togelius, and G. N. Yannakakis, “Modeling player experience for content creation,” IEEE Transactions on Computational Intelligence and AI in Games, vol. 2, no. 1, pp. 54–67, 2010.
- [7] D. Gravina, A. Khalifa, A. Liapis, J. Togelius, and G. N. Yannakakis, “Procedural content generation through quality diversity,” in 2019 IEEE Conference on Games (CoG), 2019, pp. 1–8.
- [8] T. Shu, J. Liu, and G. N. Yannakakis, “Experience-driven PCG via reinforcement learning: A Super Mario Bros study,” in 2021 IEEE Conference on Games (CoG), 2021, pp. 1–9.
- [9] A. Alvarez, S. Dahlskog, J. Font, J. Holmberg, and S. Johansson, “Assessing aesthetic criteria in the evolutionary dungeon designer,” in Proceedings of the 13th International Conference on the Foundations of Digital Games, ser. FDG ’18, 2018. [Online]. Available: https://doi.org/10.1145/3235765.3235810
- [10] A. Sarkar and S. Cooper, “Sequential segment-based level generation and blending using variational autoencoders,” in International Conference on the Foundations of Digital Games, ser. FDG ’20, 2020. [Online]. Available: https://doi.org/10.1145/3402942.3409604
- [11] S.-G. Nam and K. Ikeda, “Generation of diverse stages in turn-based role-playing game using reinforcement learning,” 2019 IEEE Conference on Games (CoG), pp. 1–8, 2019.
- [12] D. Stammer, T. Günther, and M. Preuss, “Player-adaptive spelunky level generation,” in 2015 IEEE Conference on Computational Intelligence and Games (CIG), 2015, pp. 130–137.
- [13] H. Yu and T. Trawick, “Personalized procedural content generation to minimize frustration and boredom based on ranking algorithm,” 2011. [Online]. Available: https://www.aaai.org/ocs/index.php/AIIDE/AIIDE11/paper/view/4049
- [14] P. M. Fernandes, J. Jørgensen, and N. N. Poldervaart, “Adapting procedural content generation to player personas through evolution,” in 2021 IEEE Symposium Series on Computational Intelligence (SSCI). IEEE, 2021, pp. 01–09.
- [15] V. Volz, J. Schrum, J. Liu, S. M. Lucas, A. Smith, and S. Risi, “Evolving mario levels in the latent space of a deep convolutional generative adversarial network,” in Proceedings of the Genetic and Evolutionary Computation Conference. Association for Computing Machinery, 2018, p. 221–228.
- [16] G. N. Yannakakis and J. Hallam, “Real-time game adaptation for optimizing player satisfaction,” IEEE Transactions on Computational Intelligence and AI in Games, vol. 1, pp. 121–133, 2009.
- [17] D. Melhart, A. Liapis, and G. N. Yannakakis, “Towards general models of player experience: A study within genres,” in 2021 IEEE Conference on Games (CoG), 2021, pp. 01–08.
- [18] F. Bicho and C. Martinho, “Multi-dimensional player skill progression modelling for procedural content generation,” in Proceedings of the 13th International Conference on the Foundations of Digital Games, ser. FDG ’18, 2018. [Online]. Available: https://doi.org/10.1145/3235765.3235774
- [19] A. Hald, J. S. Hansen, J. Kristensen, and P. Burelli, “Procedural content generation of puzzle games using conditional generative adversarial networks,” in International Conference on the Foundations of Digital Games, ser. FDG ’20, 2020. [Online]. Available: https://doi.org/10.1145/3402942.3409601
- [20] M. C. Green, A. Khalifa, G. A. B. Barros, A. Nealen, and J. Togelius, “Generating levels that teach mechanics,” in Proceedings of the 13th International Conference on the Foundations of Digital Games, ser. FDG ’18, 2018. [Online]. Available: https://doi.org/10.1145/3235765.3235820
- [21] S. Snodgrass, O. Mohaddesi, J. Hart, G. R. Rodriguez, C. Holmgård, and C. Harteveld, “Like peas in pods: The player, environment, agents, system framework for the personalization of digital systems,” in Proceedings of the 14th International Conference on the Foundations of Digital Games, ser. FDG ’19, 2019. [Online]. Available: https://doi.org/10.1145/3337722.3337756
- [22] Y. Zhou and W. Li, “Discovering of game ais’ characters using a neural network based ai imitator for ai clustering,” in 2020 IEEE Conference on Games (CoG), 2020, pp. 198–205.
- [23] C. Holmgård, A. Liapis, J. Togelius, and G. N. Yannakakis, “Evolving models of player decision making: Personas versus clones,” Entertain. Comput., vol. 16, pp. 95–104, 2016.
- [24] A. Drachen, A. Canossa, and G. N. Yannakakis, “Player modeling using self-organization in tomb raider: Underworld,” 2009 IEEE Symposium on Computational Intelligence and Games, pp. 1–8, 2009.
- [25] D. Melhárt, A. Azadvar, A. Canossa, A. Liapis, and G. N. Yannakakis, “Your gameplay says it all: Modelling motivation in tom clancy’s the division,” 2019 IEEE Conference on Games (CoG), pp. 1–8, 2019.
- [26] R. A. Bartle, Designing virtual worlds. New Riders, 2004.
- [27] J. Togelius, S. Karakovskiy, and R. Baumgarten, “The 2009 mario ai competition,” in IEEE Congress on Evolutionary Computation, 2010, pp. 1–8.